The best tool to measure AI adoption depends on how many AI tools you run and what you need to know. If you run one AI tool, its own admin dashboard is a good start. If you run several, or need adoption by team, cost per team and the effect on how work gets done, you need a cross-tool platform that joins AI usage data to your org structure.
Worklytics wrote this guide, and Worklytics is one of the tools in it. Each section says what the tool measures, how it gets its data and where it falls short, with links to each vendor's own documentation.
Before comparing tools, decide which questions you need answered. Most AI adoption programs come back to five:
A tool that answers only the first question is a usage report. A tool that answers all five is an adoption measurement platform. Our guide to which AI adoption metrics matter covers the metrics in more depth.
| Tool or category | What it measures | Data source | Best for |
|---|---|---|---|
| ChatGPT Enterprise workspace analytics | Usage inside ChatGPT | Built in | ChatGPT-only programs |
| Claude usage analytics and Claude Code analytics | Usage inside Claude and Claude Code | Built in | Claude-only programs |
| Microsoft Copilot Dashboard (Viva Insights) | Microsoft 365 Copilot adoption and impact | Microsoft 365 | Copilot rollouts |
| GitHub Copilot and Cursor usage metrics | Coding assistant usage | Built in | One coding tool |
| Google Workspace Gemini usage reports | Gemini usage in Workspace | Built in | Gemini rollouts |
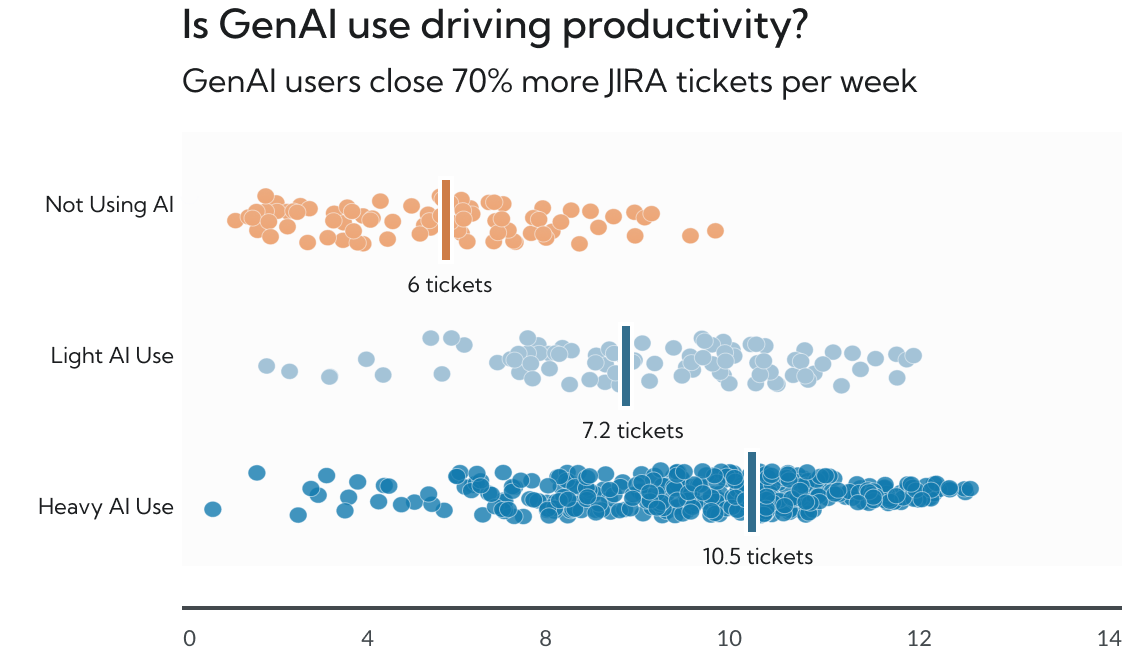
| Worklytics | Adoption, depth, task type, fluency and cost across AI tools, next to how work happens | Read-only admin APIs plus work and HR data | Several AI tools, adoption by team, impact |
| Engineering analytics platforms | Delivery metrics, sometimes with AI coding usage | Git, CI and issue trackers | Engineering-only questions |
| Endpoint and browser monitoring | AI sites visited, including unapproved ones | Software on employee computers | Shadow AI |
Every major AI vendor now includes usage reporting for enterprise plans:
Strengths: free with the license, and the most detailed view of their own product.
Where they fall short: each covers one tool. With two or more AI tools you get separate dashboards with different definitions of an active user, and none of them shows adoption by your own teams or next to the rest of the workday. The Microsoft Copilot Dashboard can filter by organizational attributes, but it still covers Copilot only.
Worklytics connects to the admin and usage APIs of your AI tools and of the systems where work happens: email, calendar, chat, documents, code, Jira and your HR system. Nothing is installed on employee devices.
Where it falls short: it only sees AI tools that have an admin or usage API, so it does not find unapproved AI sites.
Engineering analytics platforms connect to Git, CI and issue trackers to measure delivery: cycle time, review time, deployment frequency and similar metrics. Several now add usage data from AI coding assistants, so you can compare delivery for heavy and light users.
Where they fall short: they cover engineers only. Most AI use in a company happens outside engineering, in tools like ChatGPT, Claude, Copilot and Gemini, and these platforms do not see it.
These tools install a browser extension or desktop agent on each employee computer and record which AI sites people visit. Their strength is finding unapproved AI tools, which no API-based tool can do. See our guide to shadow AI for when that matters.
Where they fall short: software has to be deployed and maintained on every computer, coverage of phones is usually limited, and browser visits say little about depth of use or cost. We compare one of these tools with Worklytics in Worklytics vs Larridin.
You can export usage data from each AI tool, join it to HR data in a spreadsheet or BI tool, and add a survey on what people use AI for and how much time it saves. Our export guides cover ChatGPT Enterprise, Microsoft 365 Copilot, GitHub Copilot and others.
Where it falls short: every export has its own format and history limit, the work repeats every month, and surveys measure what people remember rather than what they did.
It depends on how many AI tools you run. For a single tool, the vendor's own admin dashboard is the simplest start. For several AI tools, adoption by team and the effect on how work gets done, a cross-tool platform such as Worklytics joins each tool's usage data to your org structure in one view.
Yes. Vendor admin dashboards and API-based platforms such as Worklytics read the usage data AI vendors already record, so nothing is installed on laptops or phones. Only tools that detect unapproved AI sites need an extension or desktop agent.
At minimum: active users and days used per week, adoption by team and role, depth of use such as sessions and task types, and cost per team or per active user. The most useful tools also show whether AI use is changing meetings, focus time and delivery.
Each vendor defines an active user differently, so comparing their dashboards side by side is misleading. Use a platform that pulls usage from every tool through its admin API and applies one definition, then breaks it down by your teams.
They do not need to. Worklytics never stores prompt or response text and reports results for groups above a minimum size. Ask any vendor what content it stores and whether it reports on individuals before you connect it.