See which teams actually use their GitHub Copilot seats, where seats sit idle, and what changes in delivery. Worklytics turns GitHub's Copilot data into team-level adoption and impact metrics, without reading any code.


The problem
GitHub's own reports show Copilot seats and recent activity. They can't tell you which teams get value, how Copilot changes delivery, or how it compares with Cursor, Claude Code and Codex.
Usage and cost are not tied to your HR structure, so you cannot see which departments, managers or locations justify their seats.
A one-line question and a long working session look the same in seat activation data. They need different fixes.
If you also run Cursor, Claude Code or Codex, there is no single view of your AI coding tools.
A vendor dashboard cannot show how much of the working day involves AI, or how it changes focus time, meetings and output.
See who adopts GitHub Copilot and why, what it changes in the engineering week, and where seats go unused, by team.
What Worklytics adds
GitHub reports on its own product. Worklytics connects Copilot to your org structure, your other AI coding tools and the engineering work itself.
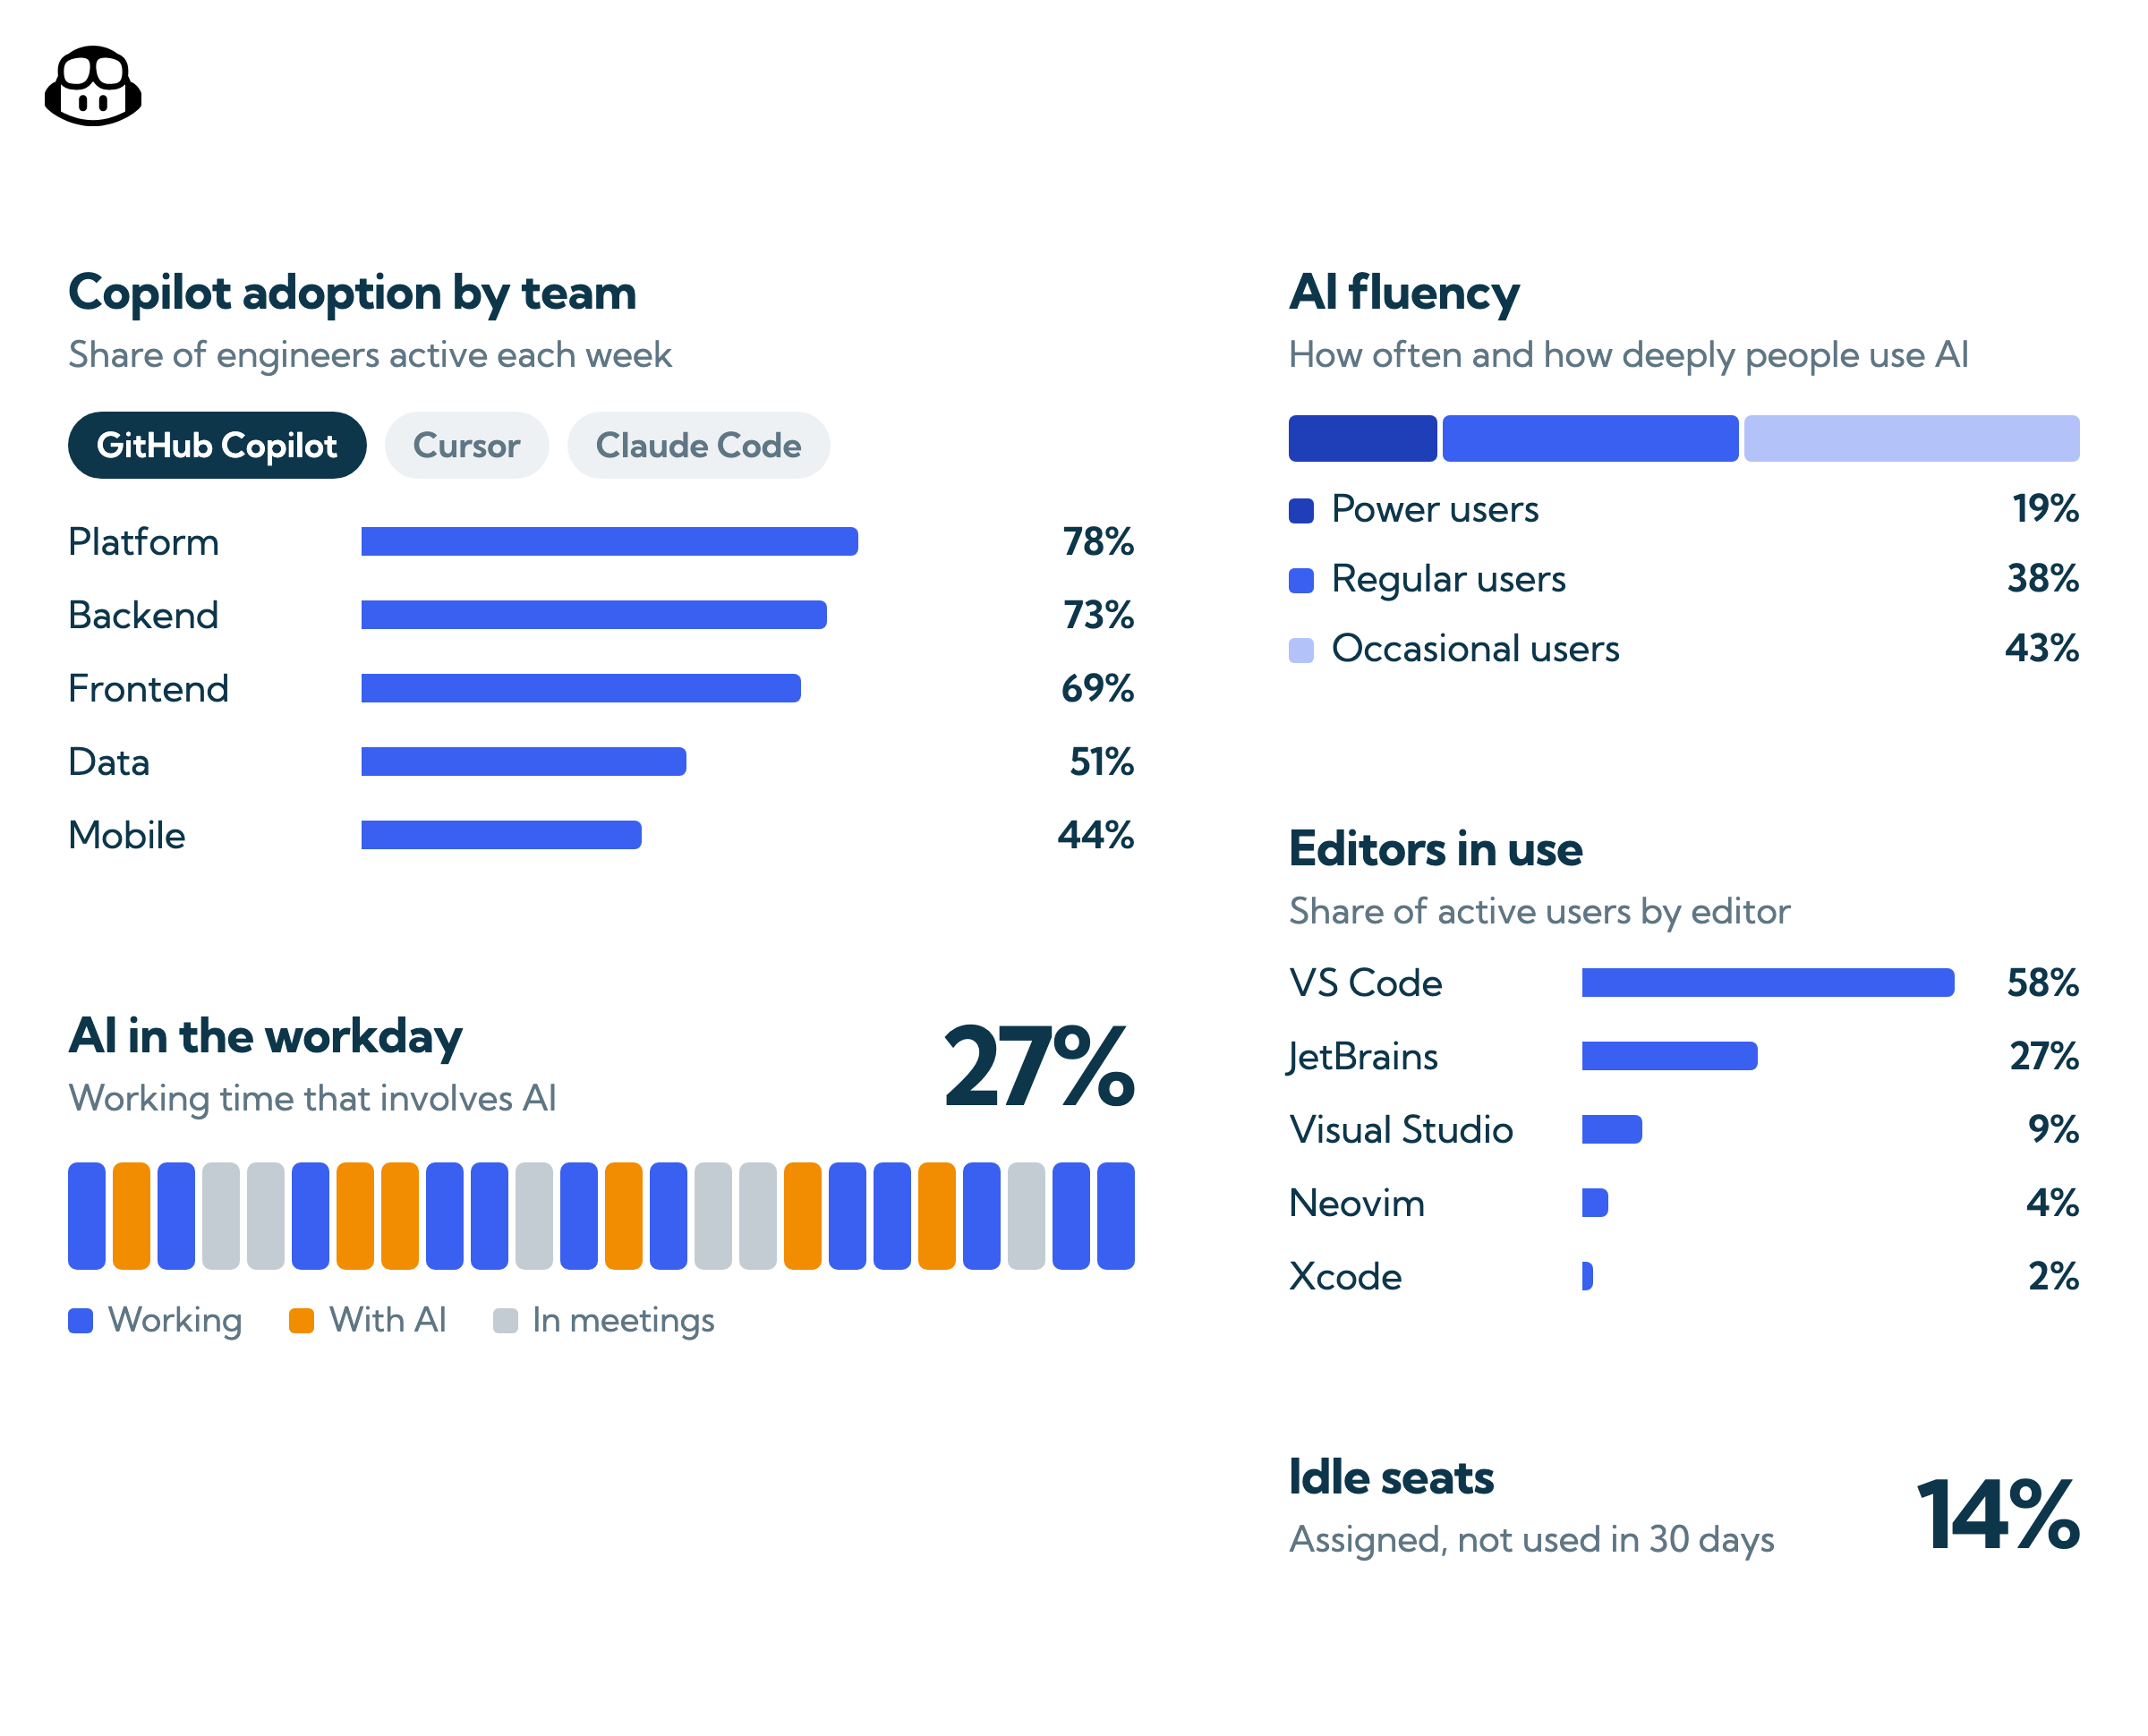
Active users and active days for GitHub Copilot by team, manager, location and tenure, from your HR data.
Compare each team with the rest of your organization and with peer companies (benchmarks in beta).
Fluency goes beyond logins: how often and how intensively people use AI, and AI penetration, the share of available working time that involves AI.
See which teams have made AI part of daily work and which are still experimenting, and track movement after training.
See which seats are active, which are idle, and which editors people use, such as VS Code or JetBrains.
Shows where Copilot is part of daily work and where seats are going unused.
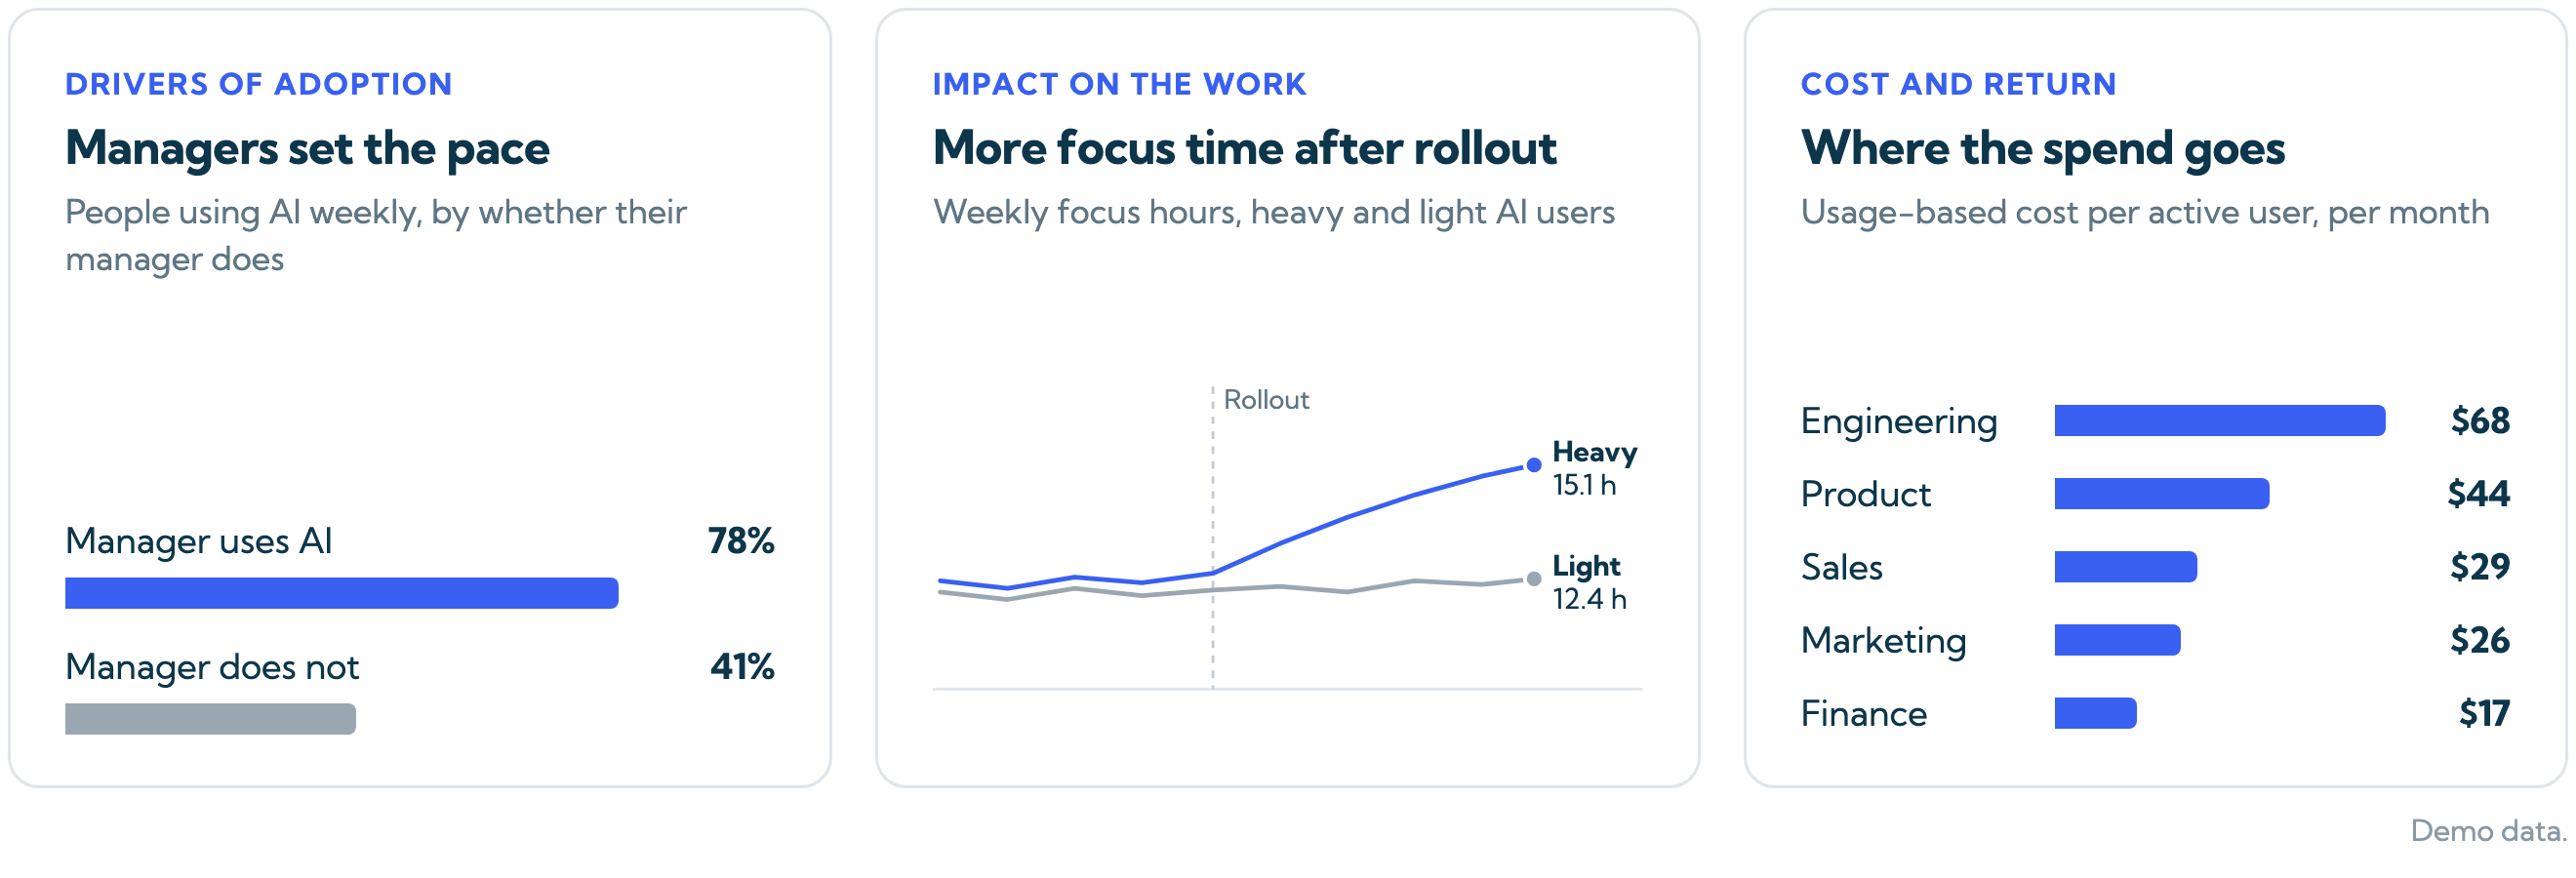
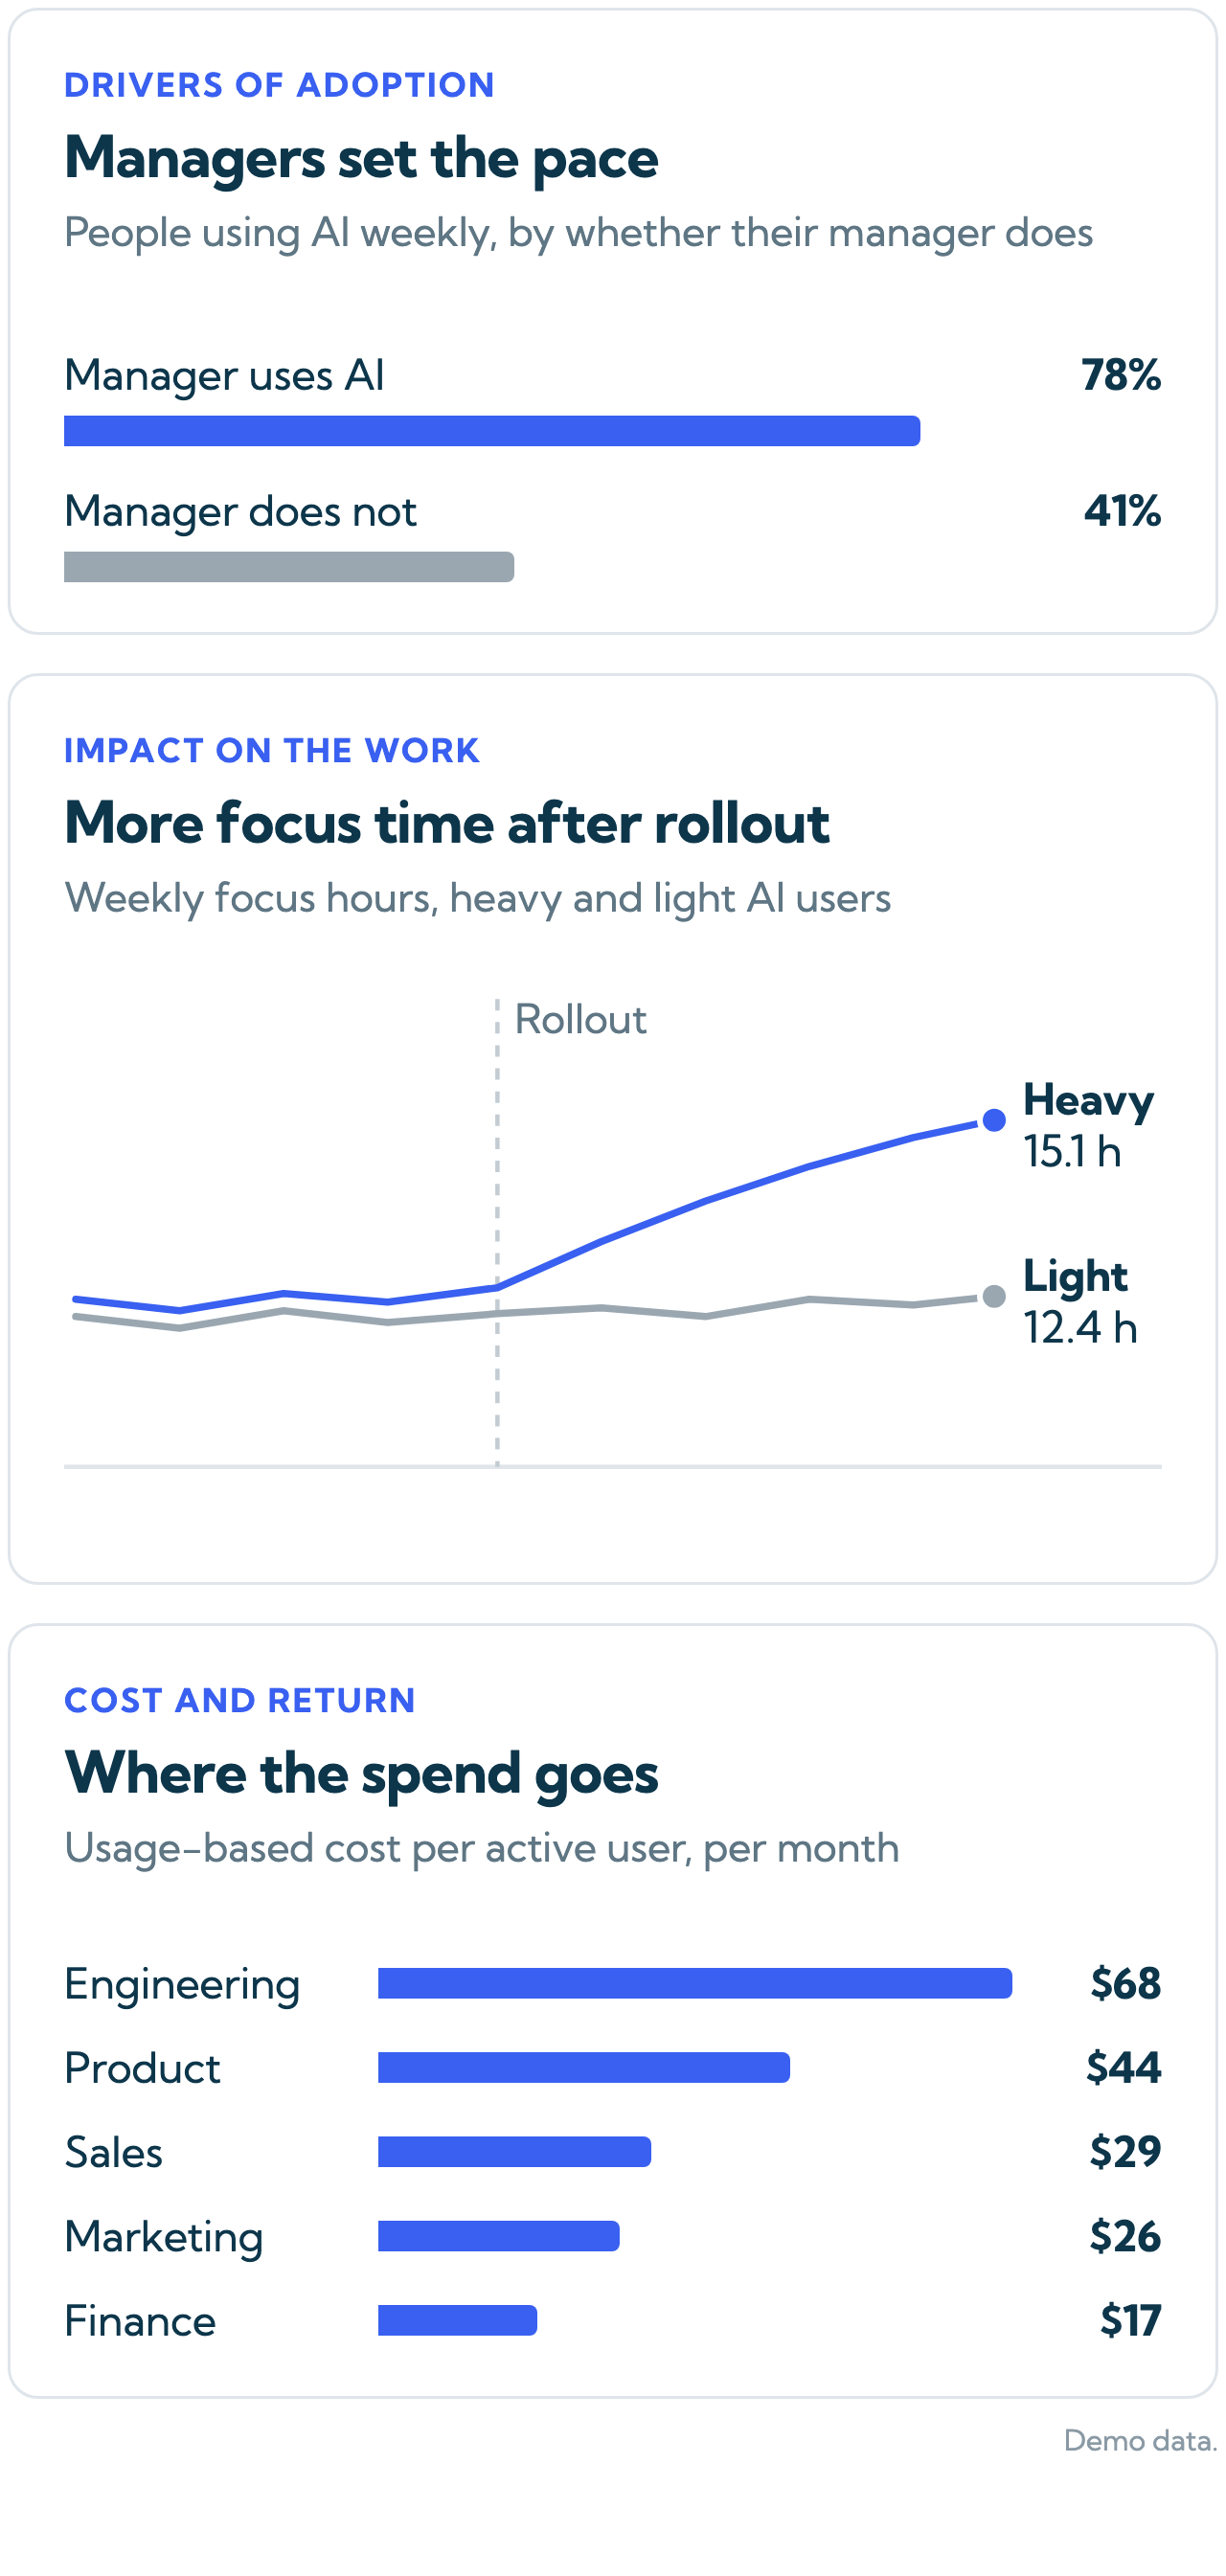
Find what predicts AI use in your organization: whether a person's manager uses AI, tenure, role and team norms.
Aim enablement where it will move adoption most, starting with managers.
Compare heavy and light Copilot users, before and after rollout, on pull request throughput, review cycle time, focus time and meeting load.
Shows whether AI is changing the work itself, not just adding another tool.
Licensed seats next to active use by team, so idle seats are visible before renewal.
See where spend goes and what it returns before you renew or consolidate tools.
Worklytics vs. native analytics
GitHub's Copilot reports cover seats and activity well. These are the gaps for teams that run more than one AI coding tool or need to connect AI use to the work.
| Capability | GitHub reports | Worklytics |
|---|---|---|
| Seat activation & weekly active users | ✓ | ✓ |
| Active days per user, trended | Partial | ✓ |
| Idle seats by team | ✗ | ✓ |
| Impact on pull requests and review time | ✗ | ✓ |
| Cross-tool view (Cursor, Claude Code, Codex) | Copilot only | All AI tools unified |
| Breakdowns by manager, tenure and location | GitHub teams only | ✓ |
| Impact on focus time, meetings, collaboration and output | ✗ | ✓ |
| AI penetration of the working day | Not available | By team, trended |
| User-level pseudonymization (no raw data) | Basic aggregation | SHA-256, minimum group sizes |
How it works
Worklytics reads Copilot seat and activity data through GitHub's API. No agent, no SDK and no code changes, and nothing is written back to your organization.
Personal identifiers are hashed with SHA-256 before analysis, and results are shown only for groups above a minimum size. Prompt and response text is never stored. With the Worklytics proxy, this happens before data leaves your environment.
Connect your HRIS, calendar or GitHub to see Copilot use by team and next to pull requests, reviews, meetings and focus time. Copilot works on its own too.
Adoption, fluency, task, impact and cost views come pre-built. Most teams see metrics within a week of setup, with trends building over the following 30 days.
Privacy & Compliance
Worklytics measures AI use without reading employee content. It connects through admin-level APIs only, is audited annually against the SOC 2 standard, and is privacy-first by design.


The data is already there. Worklytics connects through read-only APIs and gives IT, HR and leadership pre-built views, each with a clear action to take.