
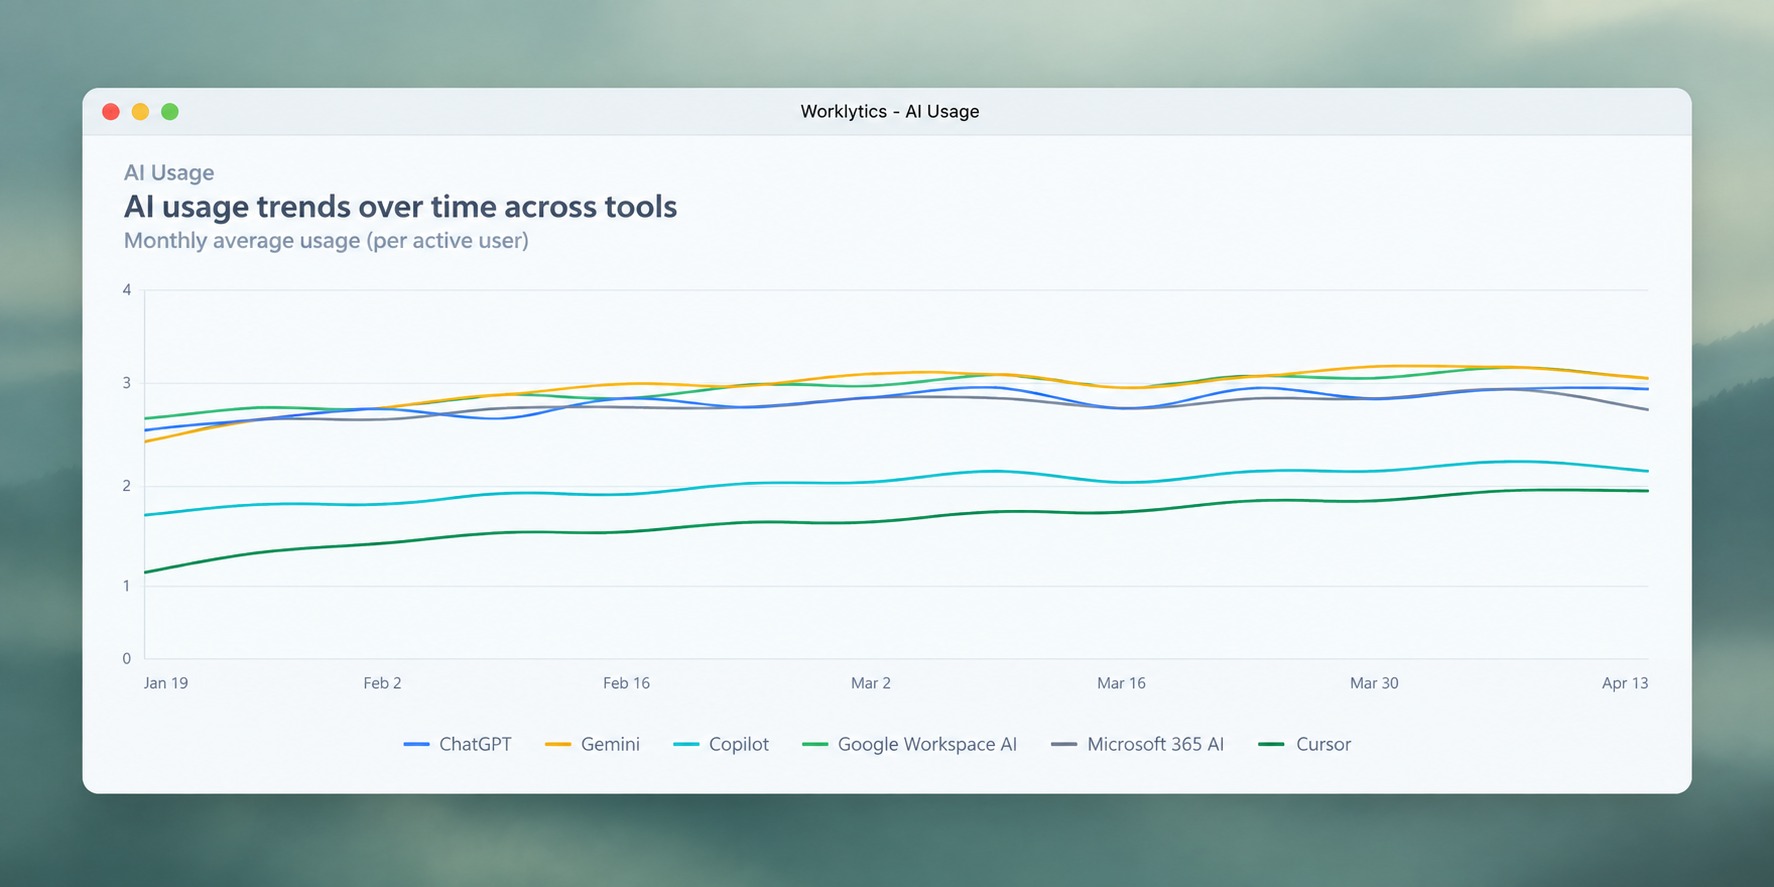
Microsoft gives you three built-in ways to export Microsoft 365 Copilot usage data: the admin center report, the Microsoft Graph API, and the Copilot Dashboard in Viva Insights. Each one hands you a file that shows who has a license and who clicked. None of them tells you whether Copilot actually changed how work gets done. This guide covers both halves: how to pull the raw data from Teams, Word, Excel, and PowerPoint, and how to turn it into a real read on adoption, engagement, productivity, and impact.
There are three official sources, and they are meant for different jobs.
Pick the admin center for a one-time check, the Graph API when you want the pull to run on a schedule, and the Viva Insights export when you need clean data for a spreadsheet model. The three sections below walk through each.
This is the quickest route and needs no code.
What you get in the file:
Three limits worth knowing before you build anything on this file. Copilot activity for a given day usually appears within 48 hours. The report holds a maximum of 180 days, so anything older is gone unless you exported it. And by default user names are masked, so if you need named rows you have to turn that on in report settings, which many privacy teams will not allow.
When you want the export to run on a schedule instead of by hand, use the Microsoft Graph reports API. The call is:
GET
https://graph.microsoft.com/v1.0/copilot/reports/getMicrosoft365CopilotUsageUserDetail(period='D30')
Set period to D7, D30, D90, or D180. The app or account making the call needs the Reports.Read.All permission. The response returns one record per user with last activity dates per app, and, since the reporting update, per-user prompt counts and active day counts.
Two constraints shape what you can do with it. The API only returns users who hold a Microsoft 365 Copilot license, so any Copilot Chat use by unlicensed staff is invisible here. And Microsoft is explicit that the audit log is not a substitute: usage metrics you build on top of Purview audit data will not match the official reports, so use the reports API for adoption reporting and keep audit logs for security and compliance work.
The Copilot Dashboard in Viva Insights is the analyst-facing view, and its data export is the cleanest of the three.
The requirements are stricter. You need at least 50 Copilot or Viva Insights licenses and global access to the dashboard, and Microsoft removes personal identifiers from the export by default. Microsoft also documents this export as a preview feature, so the exact fields can still change. That care with personal data is the right instinct, and it points at the real limit all three exports share.
Every method above answers the same narrow question: did this licensed person trigger Copilot, and when. That is a starting line, not a finish line. A person can submit a prompt every day and still produce nothing better than before. Two facts from Microsoft's own definitions make the gap concrete.
First, "active" means a user submitted a prompt. Opening the Copilot pane in Word without typing anything does not count, so your active-user number measures intent to try, not results. Second, the apps behave differently: Edit with Word counts as a Copilot Chat prompt, but Edit with Excel and Edit with PowerPoint do not, so a raw prompt count quietly understates the exact spreadsheet and slide work most teams bought Copilot to speed up.
In Copilot rollouts, the widest gap tends to sit between licensed users and people who still use it a month later, and it is usually widest in Excel and PowerPoint, because those features reward deliberate prompting more than summarizing a Teams meeting or an Outlook thread does. The native reports show the drop-off but not the reason, and never the payoff. To close that, you have to connect Copilot activity to how work actually flows. That is where a workforce analytics layer comes in.

Worklytics connects to Microsoft Copilot and Microsoft 365 and reads the same activity signal, then classifies it into real work categories such as drafting, analysis, summarization, research, and email, and lines it up against how teams collaborate. The four sections below map to the four questions the raw export leaves open.
Adoption is not the license count. It is the share of licensed people who use Copilot at least once, and then the share who use it in a way that matters for their role. Worklytics reports activation rate, the percentage of licensed employees who have used Copilot, and breaks it down by department, team, and manager so you can see exactly where a rollout stalled. Because it reads every connected tool, it also shows where Copilot is picking up work versus where a team quietly leans on a different assistant instead.
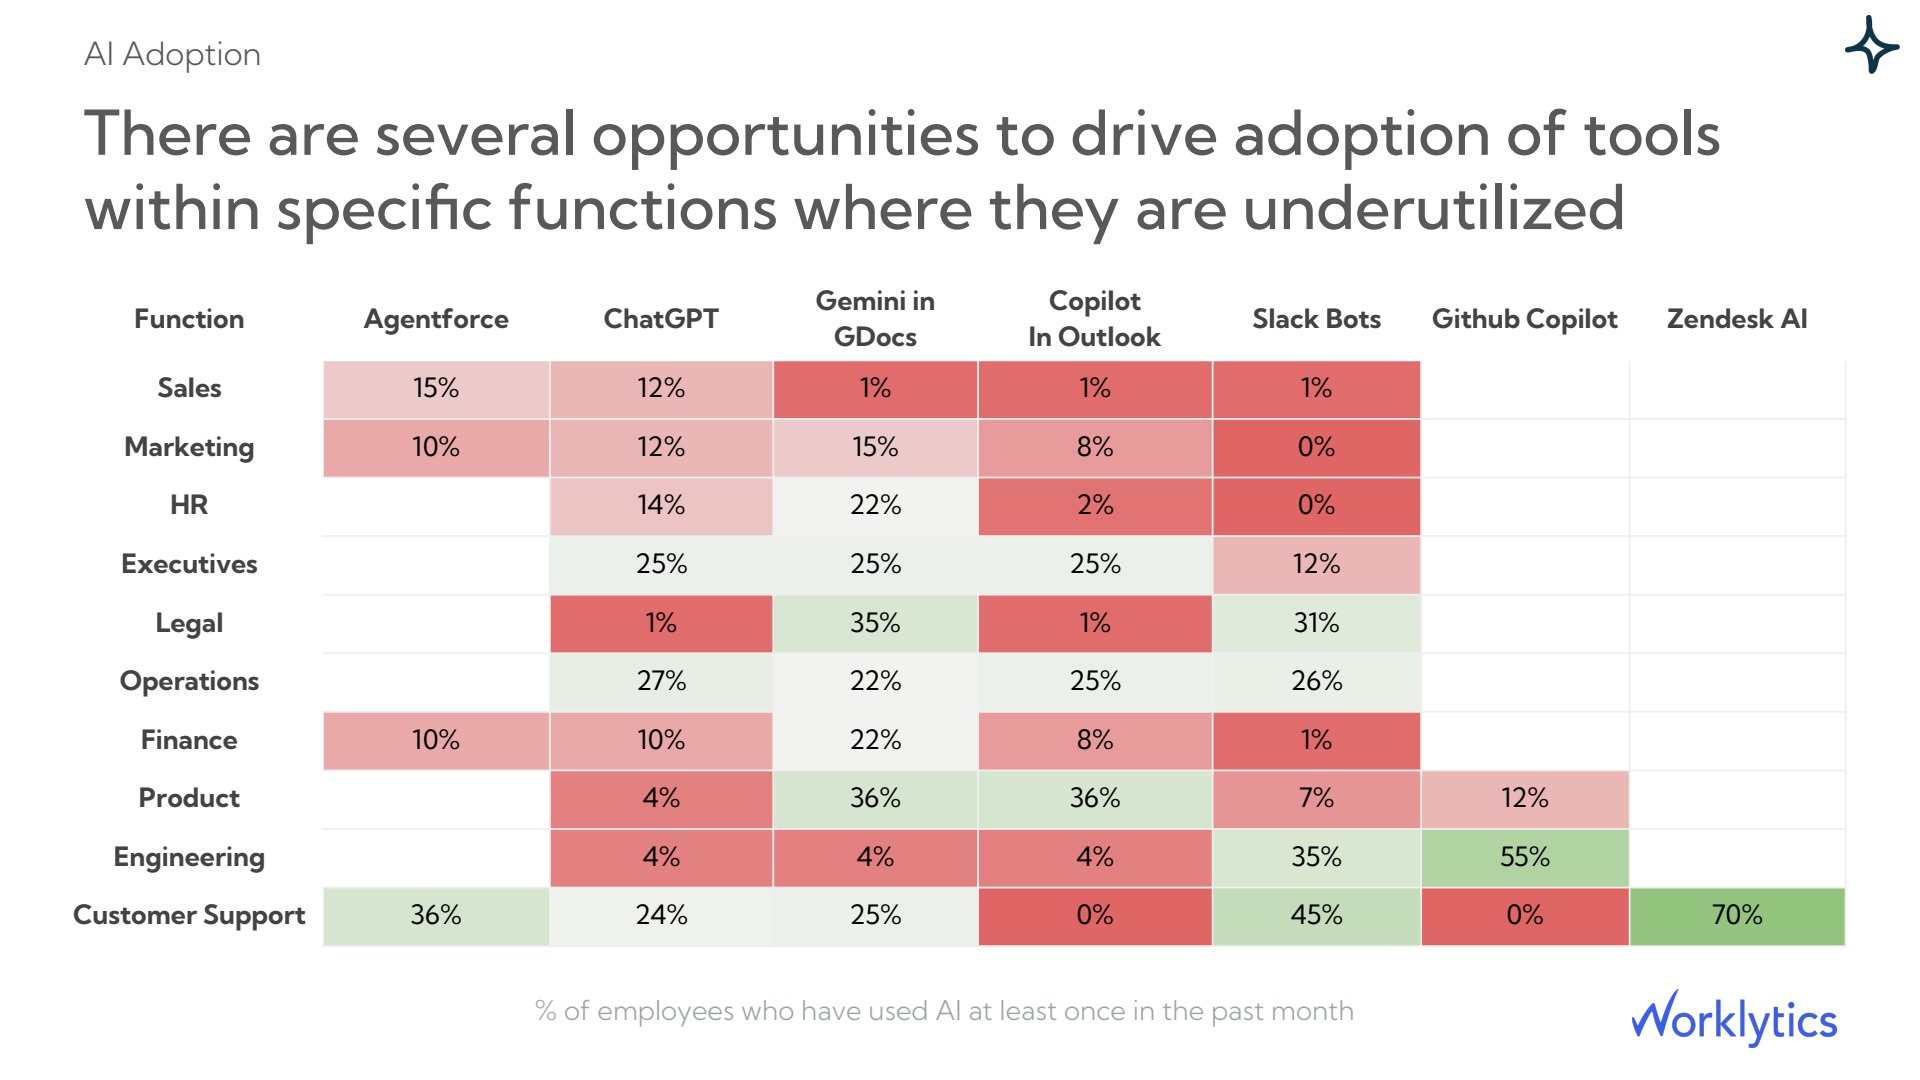
This is the difference between "we deployed 5,000 licenses" and "1,900 of those people used Copilot in Excel this month, and the sales org has not touched it." For a fuller list of the signals that separate real adoption from a license report, see which AI adoption metrics actually matter.
A first prompt is easy. The second month is the test. Worklytics tracks active usage frequency, so you can sort people into weekly-active, occasional, and not-yet-active, and it flags adoption laggards, the departments or managers where uptake started and then flattened. It also identifies power users, the small group getting deep value, whose habits are the template you want other teams to copy.

Microsoft's report will tell you last activity dates. It will not tell you that a team's usage is being carried by two people while the other eight tried Copilot once in March. That distinction decides whether you invest in more licenses or in training the teams you already paid for.
This is the number leadership asks for and the native exports cannot produce. Worklytics classifies Copilot activity into work tasks and estimates the time each task pattern saves per person, so "prompts submitted" becomes "hours returned to the drafting, analysis, and meeting-prep work Copilot touched." It pairs that with focus time, the share of the week people spend in uninterrupted deep work, so you can see whether Copilot is freeing up real capacity or just adding another tab.
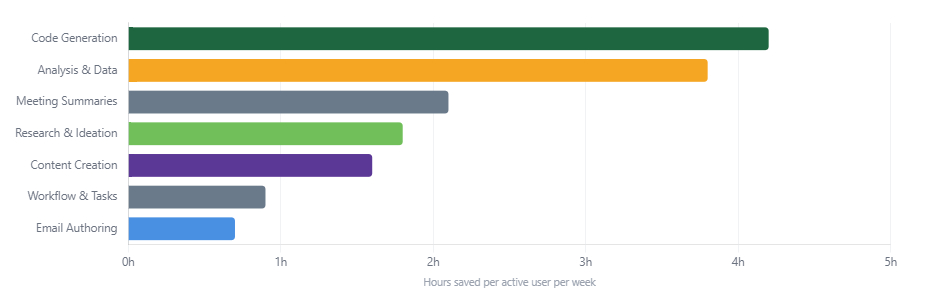
Reading time saved by task also tells you where Copilot earns its cost and where it does not, which is a sharper input to a renewal decision than an active-user rate. For the wider view on moving from activity metrics to output, see how to measure employee AI productivity.
Time saved only counts if it lands somewhere useful. Worklytics measures impact by correlating Copilot adoption with team-level outcomes: meeting load, collaboration patterns, and output in the teams with the highest adoption. Because Teams is a core Copilot surface, one of the clearest signals is meetings that now include an AI notetaker or recap, which frees attendees from writing notes and shortens follow-up.
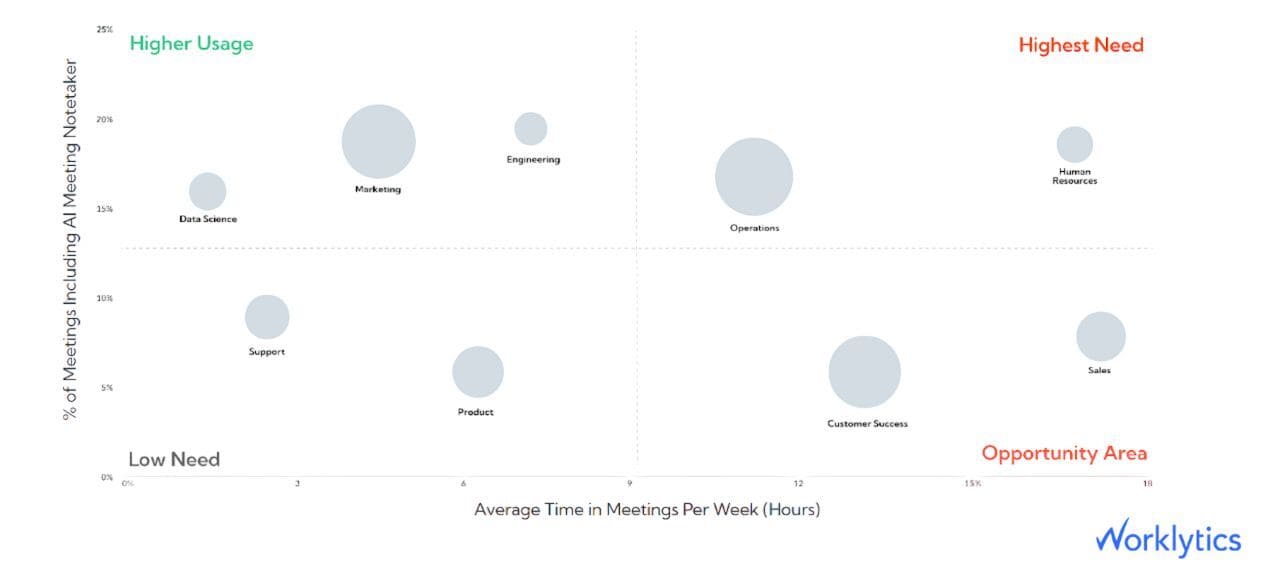
Whenever you are measuring meeting effectiveness, collaboration, or manager effectiveness alongside AI use, this is the layer that connects them. It answers the question a prompt count never can: are the teams using Copilot the most also the teams meeting less, shipping more, or collaborating better. See how the same approach applied to another assistant in tracking Claude Enterprise usage by team.
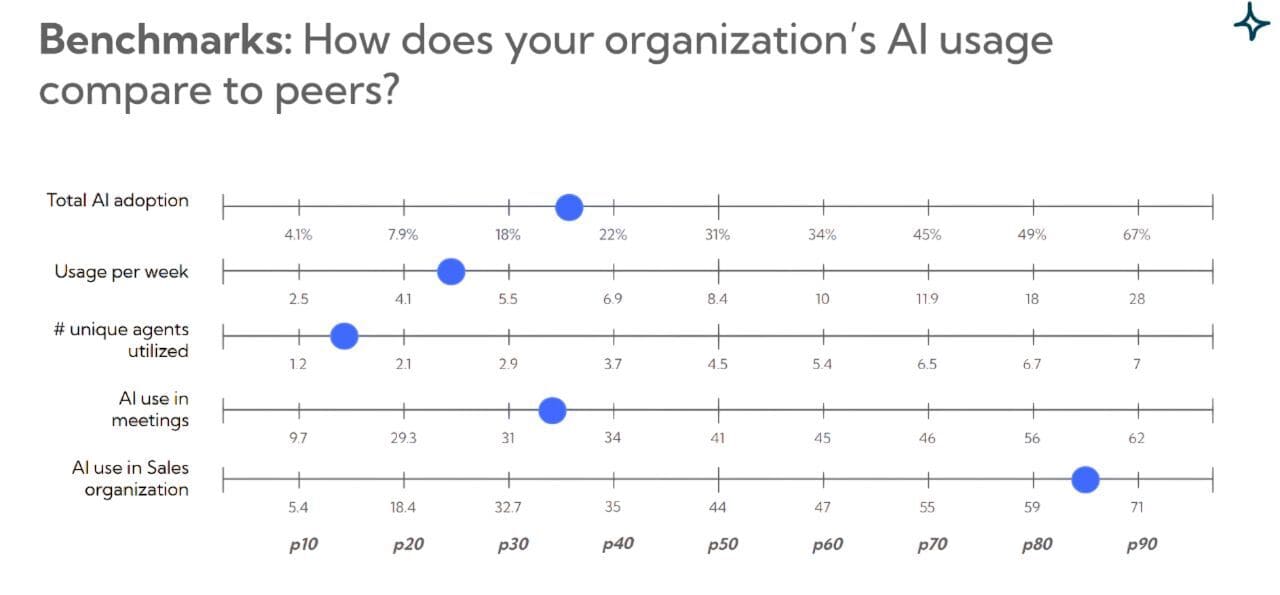
An activation rate on its own has no context. Sixty percent could be excellent or poor depending on your industry and rollout stage. Worklytics Benchmark compares your Copilot adoption and usage patterns against peer organizations, so a single number becomes a position: ahead, on pace, or behind. That turns a status report into a target and shows leadership where the organization stands rather than just where it is.
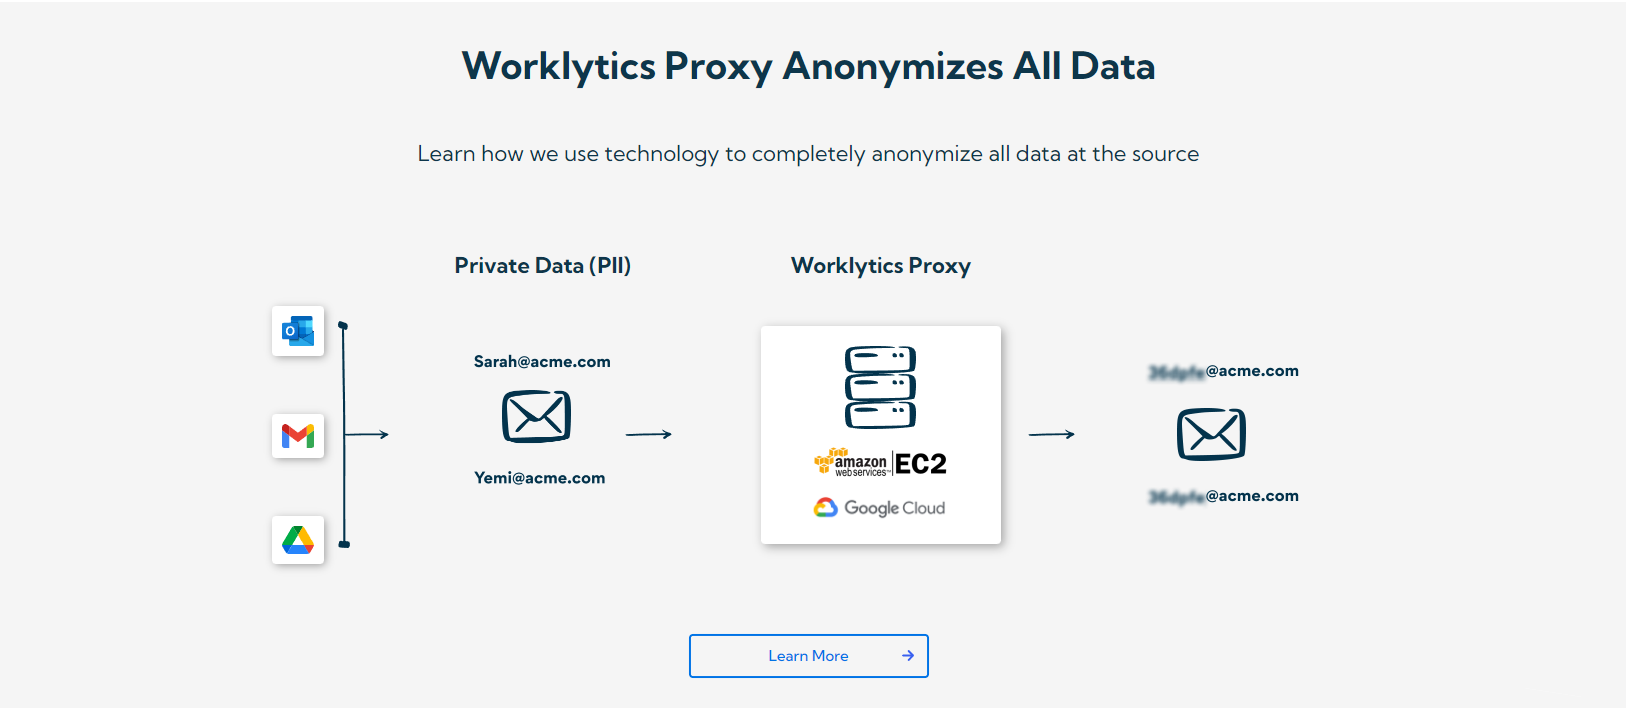
Microsoft removes personal identifiers from the Viva Insights export by default and hides user names in the admin center report. Worklytics is built the same way. It works from aggregated and anonymized activity signals, never the content of a chat, document, or message, and reports at the group level in line with GDPR and similar rules. You measure Copilot adoption and its effect on how teams work without turning a rollout into monitoring of individuals.
For the full method, see how to track employee AI usage without invading privacy.
Can I export Microsoft 365 Copilot usage data to Excel?
Yes. In the Microsoft 365 admin center, go to Reports > Usage > Microsoft Copilot > Copilot, then select the ellipses on a chart and choose Export, or use the Export button on the user activity table to download every user's row as a CSV you can open in Excel.
How far back does Microsoft 365 Copilot usage data go?
The admin center report holds a maximum of 180 days. The Copilot Dashboard in Viva Insights exports 6 months of data by week or 28 days by day. If you need history beyond those windows, you have to export and store it yourself, or use an analytics platform that keeps a longer record.
Does the Copilot usage report show Teams, Word, Excel, and PowerPoint separately?
Yes. The Adoption by app view and the per-user table break active users and last activity dates out by app, including Teams, Word, Excel, PowerPoint, Outlook, OneNote, and Loop.
Can I pull Copilot data automatically instead of exporting by hand?
Yes. Call the Microsoft Graph endpoint getMicrosoft365CopilotUsageUserDetail with a period of D7, D30, D90, or D180. The caller needs Reports.Read.All. It returns per-user activity and prompt counts, but only for people who hold a Copilot license.
Why does the report show low active users even though people opened Copilot?
Microsoft counts a user as active only when they submit a prompt. Opening the Copilot pane in an app without typing a prompt does not count, so the active-user number reflects real interactions, not people who simply opened the tool.
Does the export include Copilot Chat used without a license?
The admin center report and the Graph API only include licensed users. The Copilot Dashboard export in Viva Insights does add fields for Copilot Chat used without a license, which is one reason analysts prefer it.
How do I measure whether Copilot actually saves time, not just who clicked it?
The native exports show activity, not outcomes. Connect the usage data to work patterns with a platform like Worklytics, which classifies Copilot activity into tasks, estimates hours saved, and correlates adoption with team output and collaboration.
Can I track Copilot adoption without monitoring individual employees?
Yes. Worklytics reports on aggregated, anonymized activity and never reads the content of documents, chats, or messages, so you can measure adoption, engagement, and impact at the group level while staying compliant with GDPR and similar rules. See how to track AI usage without invading privacy.
Exporting Copilot data from Microsoft tells you who has a license and who pressed the button. That is necessary, and it is not enough to defend the spend or improve the rollout. Worklytics turns that activity into the four answers leadership needs: who is really using Copilot, whether they keep using it, how much time it saves, and what it changes about how teams work, all without surveilling anyone. See how MeasureAI works.



