To measure AI's impact on employee productivity, track three things at team level: whether people use AI (adoption), how much of their work it touches (depth), and whether work patterns and outcomes change in teams that use it heavily compared with teams that don't (impact). Use aggregated data from the tools your company already runs, not individual monitoring and not self-reported surveys alone.
Hours worked, tickets closed and lines of code were never perfect proxies for performance, and AI makes them weaker still. When an assistant drafts the first version of a document or a coding agent writes the boilerplate, output counts go up or down for reasons that have little to do with how well a team works. This guide covers what to measure instead, how to do it across thousands of employees, and how to keep it about teams rather than individuals.
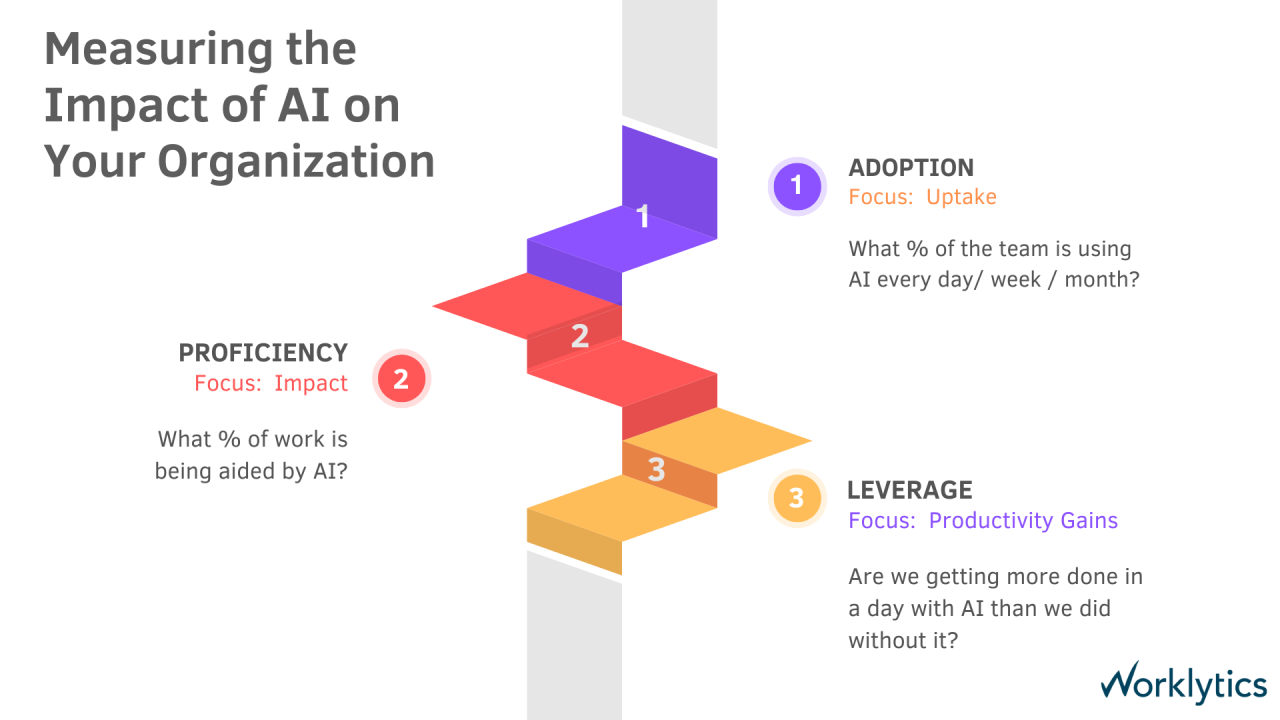
Measure it in three layers, always for groups of people rather than individuals. Each layer answers a different question, and you need all three before you can say AI is improving performance.
Start with the share of licensed employees who actually use AI tools, and how many days a week they use them. Count AI active days once per person across all tools, so someone who uses three assistants on the same day isn't counted three times. Break the numbers down by department, role and manager group to find where adoption has stalled. For the full list of adoption KPIs, see which AI adoption metrics matter.
Adoption shows that people opened a tool. Depth shows whether AI has become part of how they work. Two useful measures:
For AI agents and coding assistants, look past seat counts. Some tools report sessions, accepted versus rejected edits, and pull requests attributed to the agent, which says far more than "has a license."
Compare groups with high and low AI depth over the same period, or the same teams before and after a rollout. Look at:
If heavy-AI teams gain focus time and keep or improve their outcomes, AI is helping. If adoption is high but nothing changes, the tool is being used shallowly or in the wrong places. To turn time saved into a dollar figure, use the formula in our guide to measuring AI ROI.
Team-level measurement answers the question leaders actually have ("is our AI investment changing how work gets done?") without turning AI tools into a surveillance system. It also scales: the same three layers work for 200 people or 20,000. For more on this choice, see team vs. individual productivity.
As AI becomes embedded in daily workflows, the traditional links between activity and productivity are weakening. Roles have shifted. In tech alone, developers now rely on AI assistants for boilerplate code while support teams automate ticket resolution with bots. This shift renders old metrics such as calls handled, tickets closed, and lines of code less relevant and often misleading.
Yet many organizations cling to these outdated metrics. This has led to the phenomenon known as “productivity theater,” where employees focus on appearing busy rather than doing meaningful work. They attend every optional meeting, fire off late-night emails, and micromanage visibility, all because they’re evaluated on presence rather than impact.
In an AI-enhanced environment, measuring employee performance demands a broader, more contextual view. Here’s what that includes:
First and foremost, align metrics with business outcomes and mission, not just activities. This may sound obvious, yet many teams still track what’s easy to count rather than what counts. In the AI era, where technology takes care of many low-level tasks, employees’ performance should be gauged by the impact of their work.
Frameworks like the Balanced Scorecard and OKRs (Objectives and Key Results) are well-suited for this purpose. They help align individual goals with broader business outcomes, something significant in hybrid and distributed teams.
As AI takes over routine tasks, the value of human employees is increasingly defined by their ability to adapt, learn, and innovate. Performance metrics must evolve to capture these qualities, particularly in rapidly changing tech environments. Key areas to measure include:
Together, these indicators reflect a more holistic view of performance, one that aligns with how work is evolving and where competitive advantage increasingly comes from: human adaptability.
The modern workplace thrives on collaborative intelligence. In tech teams especially, no single person builds a product alone.
Organizational Network Analysis (ONA) maps collaboration across email, chat, calendar and project tools to show how knowledge moves between groups and where silos exist. In an AI rollout, use it at group level: check whether cross-group collaboration holds up or drops as teams lean on AI for drafting and summarizing, and whether some groups become isolated. These patterns don't show up in output counts.

In today’s always-on digital environment, it’s easy for the workload to spiral out of control, especially when AI increases speed and expectations. That’s why measuring well-being is not a side initiative; it’s an operational imperative. Key indicators include:


Including these measures makes performance management more human. It asks "What did the team deliver?" and also "Is this pace sustainable?" To measure AI's impact on employee experience, track the same team-level signals before and after rollout: focus time, meeting load and after-hours work. If AI saves time but after-hours work keeps rising, the time saved is being absorbed rather than given back.
Modern analytics platforms are evolving to give leaders real-time visibility into how AI tools are being adopted and used across their organizations. Instead of just tracking meetings or collaboration patterns, these AI-focused dashboards surface insights such as which teams are actively using AI assistants, how frequently they engage with tools like GitHub Copilot or Microsoft 365 Copilot, and whether AI usage is correlating with productivity gains or reduced manual workload.
Leaders can quickly identify adoption gaps, recognize teams leading the way, and adjust support or training efforts accordingly, all without invasive oversight.
Worklytics brings usage data from tools like Microsoft Copilot, ChatGPT, Claude, Gemini and Slack into one view, tracks adoption by team and role, and classifies AI activity into work categories such as coding, research, analysis, summarization and drafting. You can see how it works on the AI adoption page.
Microsoft's Productivity Score is a useful warning. It drew criticism over privacy, and in December 2020 Microsoft removed user names from the product and limited its people measures to organization-level data.
Employees want to feel enabled, not watched. That’s why leading organizations today favor aggregate, anonymized metrics, which measure patterns at the team or organizational level rather than singling out individuals.
Under the GDPR, people have the right to know what personal data is collected about them and how it is used, and employees are no exception. In California, the CCPA exemption for employment-related data expired on December 31, 2022, so employee data is now covered too. Internal performance and AI analytics fall under these rules. Companies must:
A people analytics charter can establish clear boundaries and expectations.
If AI is used to flag high performers or suggest promotions, bias audits are critical. Models can reinforce existing inequities if trained on biased data. For instance, rewarding after-hours work may unfairly penalize caregivers. Regular reviews and human-in-the-loop decision-making help avoid this.
Trust, transparency, and fairness are not just compliance issues; they’re cultural imperatives in the AI-powered workplace.
Putting this into practice takes data you probably already have. Worklytics connects to the tools your teams use every day, including Microsoft 365, Google Workspace, Slack, GitHub and AI tools such as Copilot, ChatGPT, Claude and Gemini, and turns their metadata into team-level metrics:

Privacy is built in. Worklytics analyzes metadata, never message or prompt content. Personal identifiers are pseudonymized (hashed with SHA-256) before analysis, and results are only shown for groups above a minimum size, typically 5 to 8 people. The goal is to show which teams AI is helping and where they need support, not to rank individuals.
Measuring performance in the age of AI isn't about tracking more data. It's about tracking the right data: whether AI is used, how deeply, and what changes in the work as a result. That means moving from activity counts to outcomes, and from watching individuals to understanding teams.
The future of work is not just AI-enabled, it’s human-centered.
With clear team-level metrics and a privacy-first approach, leaders can show where AI is improving performance, where adoption is shallow, and where teams need help.
Measure three layers at team level: adoption (who uses AI and how often), depth (how much of the workday and which tasks AI touches), and impact (how focus time, meeting load and team outcomes change in heavy-AI teams compared with light-AI teams). Use aggregated data from existing work tools rather than individual monitoring or surveys alone.
Look past logins. Track how many days a week people use AI, the share of their working time with AI use, and which tasks they use it for. Effective use shows up as AI built into everyday work, alongside steady or better team outcomes.
Use data your tools already collect, such as AI tool usage, calendar and collaboration metadata, instead of surveys or manual tracking. Aggregate it by department, role and manager group, then compare groups with high and low AI use over the same period. This scales to any company size and keeps the analysis at team level.
Start with the reporting from the agent's vendor, then combine it with your other work data. Some coding agents, such as Claude Code, report sessions, accepted and rejected edits, and pull requests attributed to the agent. Worklytics combines this kind of data with usage from other AI tools and work patterns, at team level.
Track team-level work patterns before and after AI rollout: focus time, meeting load and after-hours work. Pair them with pulse surveys. If AI saves time but after-hours work keeps rising, the gain is not reaching employees.