
.jpg)
The surge of generative AI in the workplace has been unprecedented. Tools like Claude are becoming fixtures across industries, from coding to customer support. Clearly, AI adoption is accelerating.
Yet amid this rapid uptake, organizations face a critical question:
Are our employees actually using Claude Enterprise effectively, and how do we track that usage to drive value?
Simply deploying Claude Enterprise isn’t enough; you need insight into how it’s being utilized on a day-to-day basis. Importantly, tracking AI tool usage is not about snooping or micromanaging – it’s about gaining actionable insight.
Without tracking Claude Enterprise usage, it’s hard to know whether Claude AI is delivering value and where it’s underutilized.
Usage data reveals these disparities. For example, you might discover that developers and analysts are heavy Claude users, but your sales or operations teams hardly touch it. This oversight is crucial because most organizations currently lack visibility into the extent of AI usage across their workforce.
Finally, consider the productivity payoff. When used effectively, AI assistants like Claude can significantly enhance efficiency and productivity.
If your org also runs OpenAI's tools, the same approach works for tracking ChatGPT Enterprise usage.
Claude Enterprise provides administrators with a dedicated Analytics dashboard to monitor how their organization interacts with the AI. Admins and Owners can track team activity, feature adoption, and overall engagement through several key metrics:
Owners and Primary Owners can access analytics under Settings → Analytics in claude.ai. The dashboard is now split into several views:
Reports support daily, weekly, and monthly views with custom date ranges going back up to 90 days, and you can export detailed per-user, per-model CSV reports covering request counts, token consumption, and estimated spend, updated daily.
Two newer features make this data more accessible: analytics chat lets admins ask usage questions in plain language ("who are our top spenders this month?"), and the Analytics API gives Enterprise customers programmatic access to the same metrics for custom reporting — data refreshes every four hours.
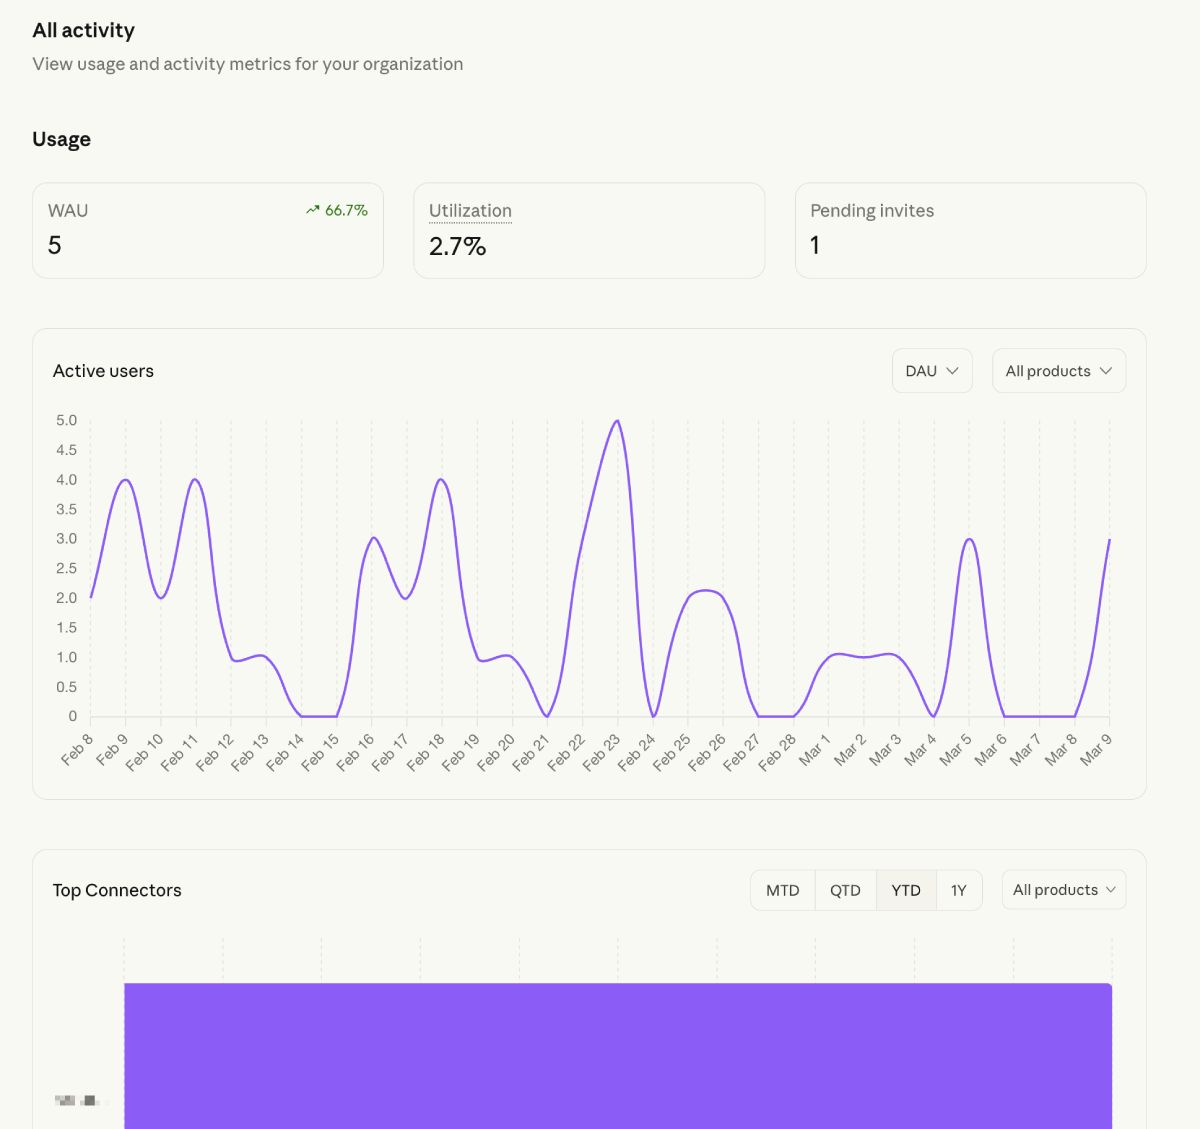
These tools allow leadership to identify power users, optimize seat assignments, and ensure the platform is being used efficiently across the company.
To monitor how your team is utilizing Claude, administrators can access comprehensive insights through the Admin Console. Follow these steps to track activity and export detailed usage data:
By regularly reviewing these reports, you can identify high-impact use cases and ensure seats are allocated to the employees getting the most value from the platform.
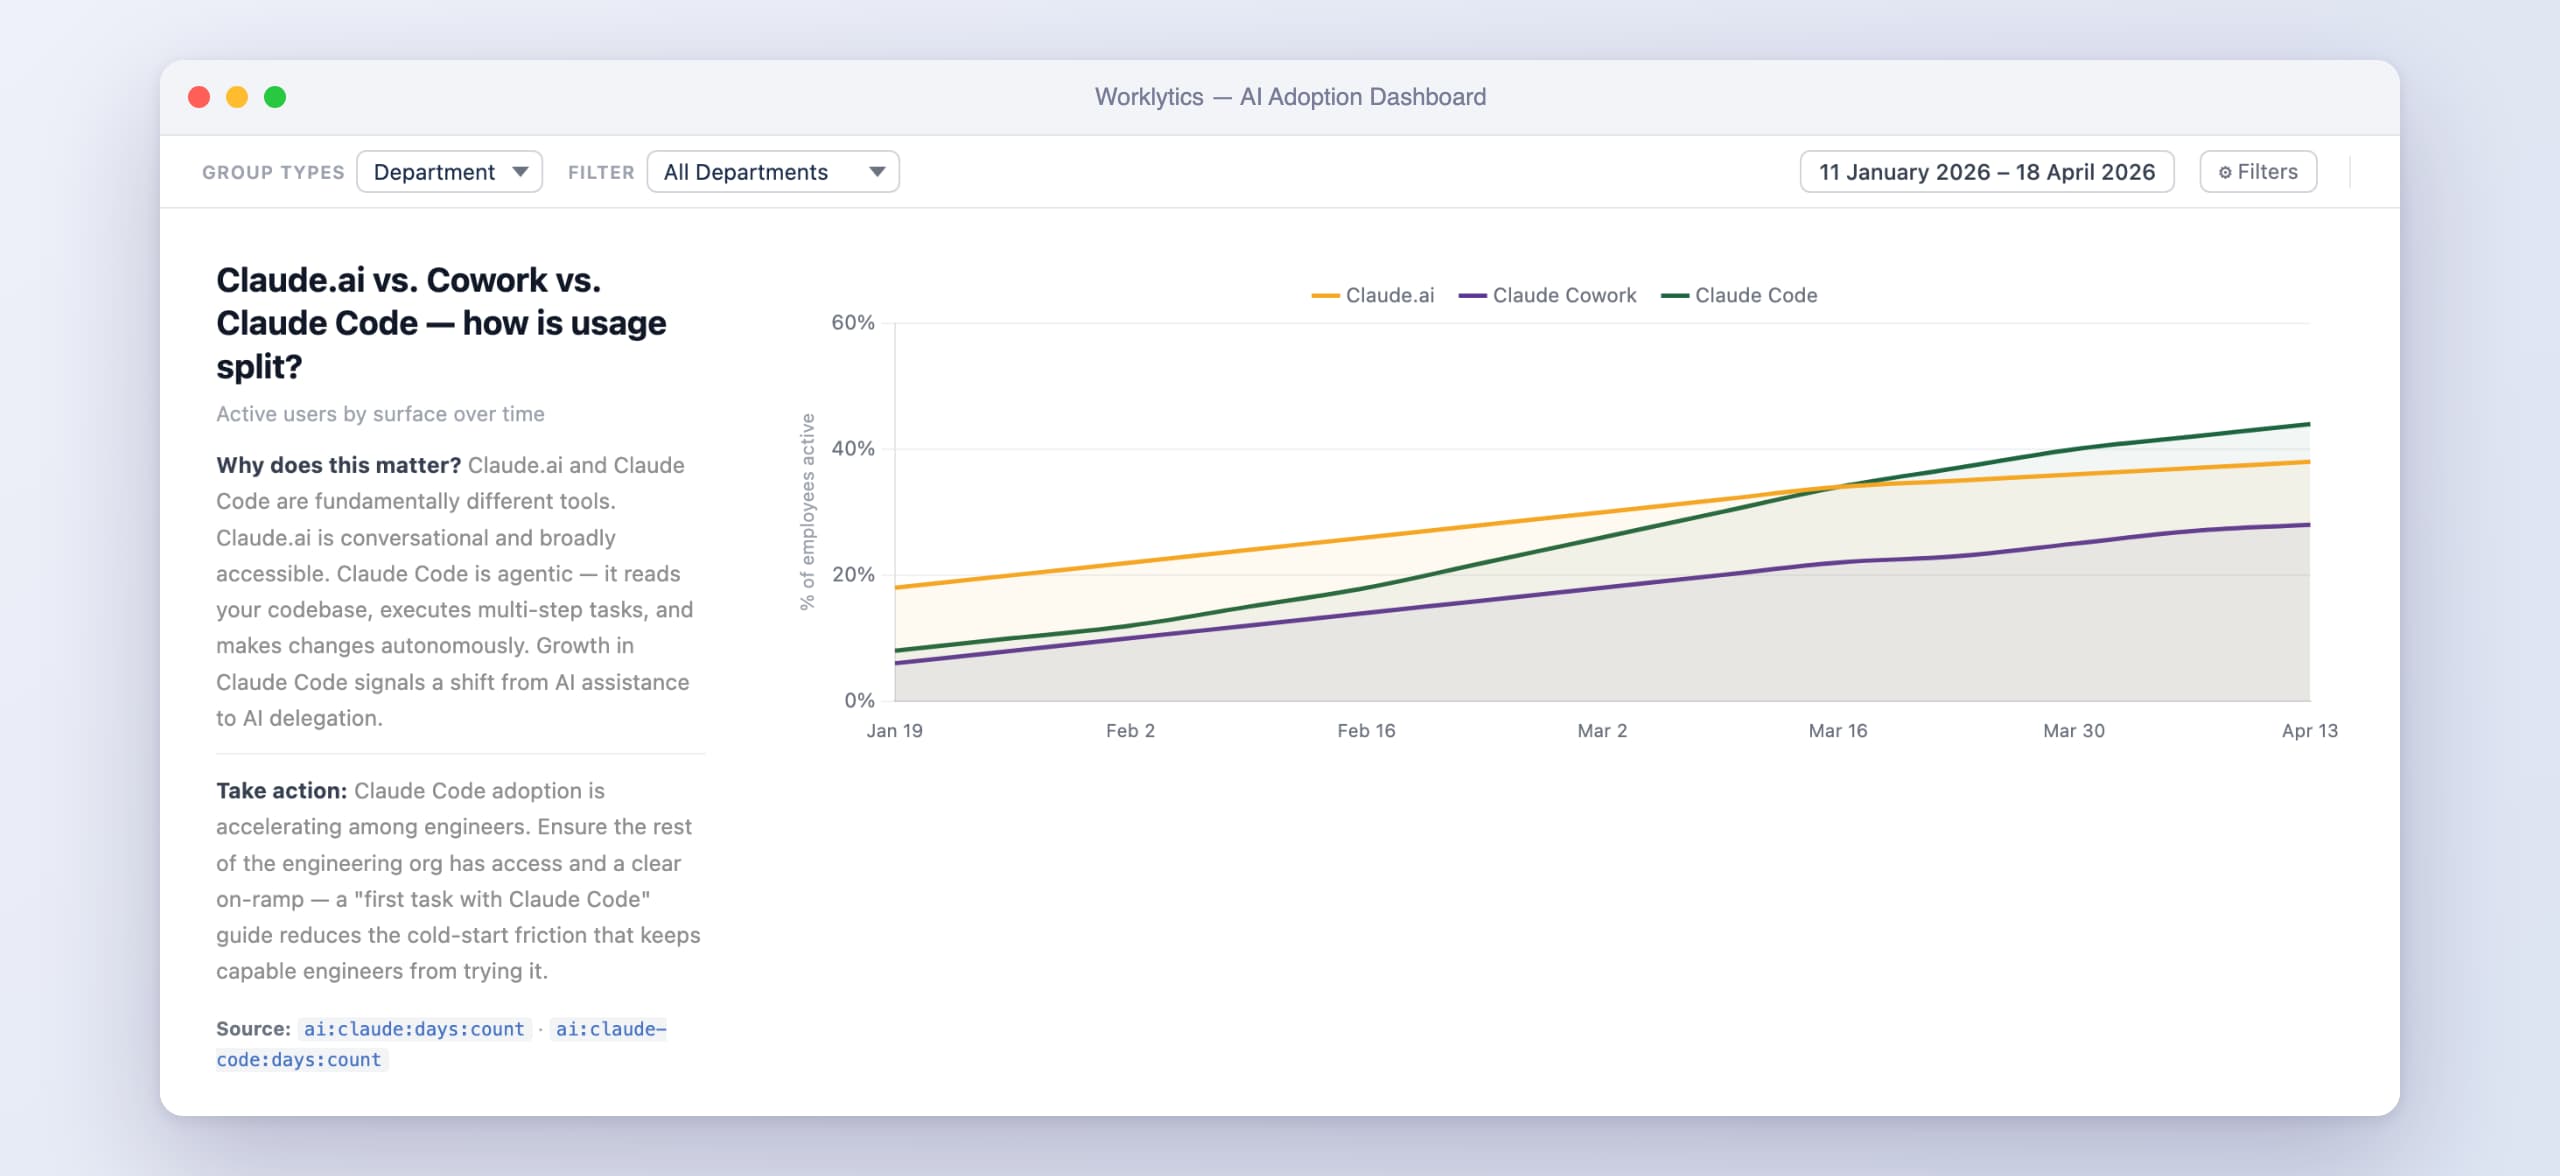
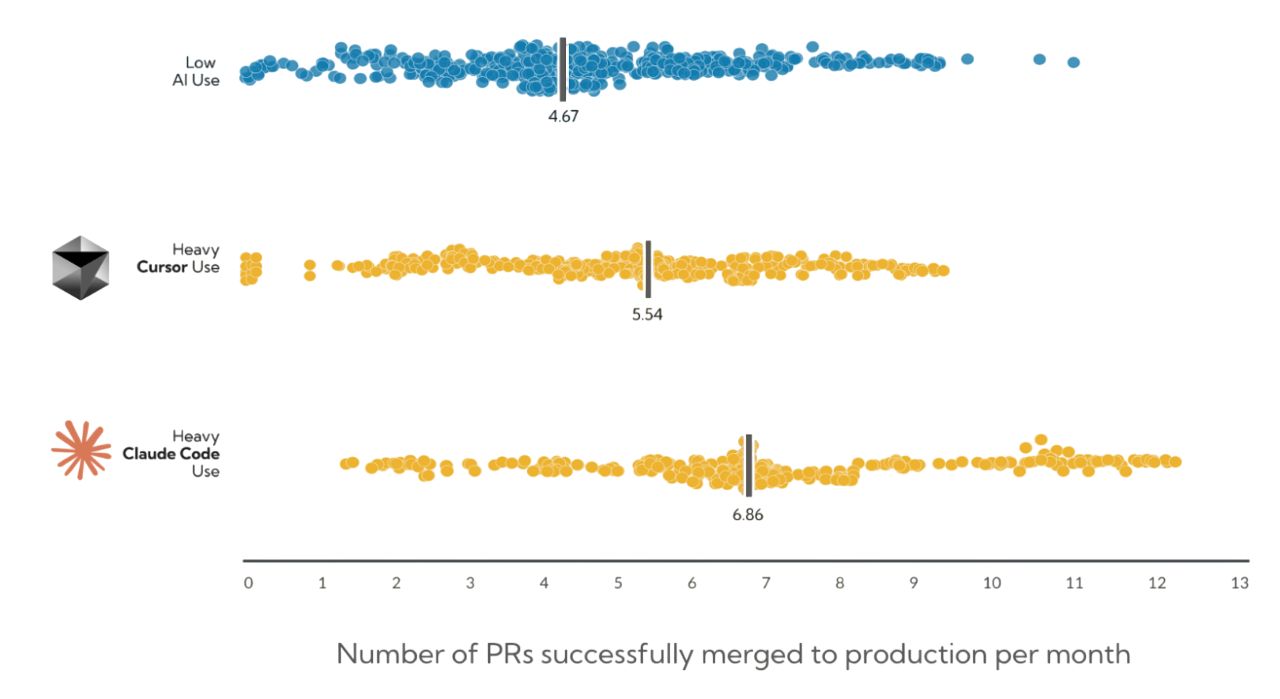
Engineering teams get a separate, dedicated dashboard at claude.ai/analytics/claude-code covering daily active users, suggestion accept rates, and — with the GitHub integration — contribution metrics showing how many merged PRs and shipped lines of code involved Claude Code assistance. Setup steps, the PR-attribution methodology, token costs, and what admins can and can't see are covered in our full guide to tracking Claude Code usage.
Engineering teams comparing assistants should also see our guides to Cursor usage analytics and Copilot utilization.
Controlling Claude Enterprise costs with spend limits
Consumption is measured in tokens, and not all usage is equal — Claude Code and Cowork sessions consume significantly more tokens than standard chat. Admins can cap spending at three levels, with individual limits overriding group limits, which override org-wide limits:
Anthropic recommends reviewing group consumption weekly during initial rollout and monthly thereafter.
Audit logs and conversation-level access: the Compliance API
The standard analytics dashboard shows usage metadata — who is using Claude, how often, and at what cost — but not what anyone said. For organizations with governance, legal, or DLP requirements, Claude Enterprise's Compliance API goes further. It provides programmatic access to the organization's activity feed, audit log events, the directory of users, roles and groups, and — for claude.ai organizations — the underlying chats, uploaded files, and project contents. Security teams typically feed this into DLP and SIEM tools like Microsoft Purview, Netskope, or Datadog Cloud SIEM.
Access is tightly scoped: a Primary Owner must create a Compliance Access Key in claude.ai to unlock the full API, while Admin API keys created in Claude Console reach the activity feed only.
Tracking employees’ Claude usage isn’t a compliance exercise or vanity project – it’s a strategic initiative to drive more value from AI. Once you have visibility into the who, how, and how much, the next step is leveraging those insights to benefit your people and the business. Here are ways that usage data can be turned into action and value:
Your data will likely reveal a set of “AI champions” or power users – individuals or teams who have enthusiastically adopted Claude and are getting results. These champions are gold. Their examples can inspire others. By celebrating the early adopters, you also reinforce a culture that values innovation. One platform even flags top AI adopters automatically, making it easy to spot your internal experts. Tapping into these champions accelerates learning across the organization.
Conversely, the data will expose areas where usage is low or where specific features aren’t being utilized. Instead of broad, one-size-fits-all training, you can tailor enablement to exactly what’s needed. For instance, if the sales department’s usage is low, organize a “Claude for Sales” workshop to brainstorm how reps could use AI for proposals or research. Because you have baseline measurements, you can then measure the impact of these training efforts. This feedback loop ensures your investments in training or communication are actually moving the needle.
Usage insights can inform your AI governance and support model. For example, if employees are using Claude heavily for certain tasks, you might prioritize building more integration or support for those tasks. If you notice that employees in a regulated department are using Claude despite strict data policies, it may prompt a review of whether additional guardrails or guidance are needed to prevent the accidental sharing of sensitive information. By aligning policy with actual usage patterns, you ensure governance is realistic and supportive of productivity rather than a blunt obstacle.
Ultimately, leadership cares about outcomes – is Claude (and AI broadly) making a positive difference? While isolating AI’s impact on productivity or revenue is complex, usage metrics are a necessary first step in any ROI calculation.
High adoption is a prerequisite for reaping any benefits.
Some organizations have built multi-level AI impact dashboards, where Tier 1 metrics are usage stats, Tier 2 metrics look at efficiency (e.g. time saved per task, which can be estimated via surveys or before/after studies), and Tier 3 metrics link to business outcomes like customer satisfaction or sales growth.
Companies that actively measure AI usage and learn from top performers are already seeing meaningful productivity gains compared to those that don’t. This measurement culture is itself a competitive advantage.
As your organization matures in AI adoption, you can start to benchmark internally and externally.
Internally, set targets or benchmarks – e.g. aim for 70% of employees to use Claude at least monthly by next quarter, or for each department to increase usage 2X.
If you find your company is behind the industry norm in AI utilization, that’s a call to action to accelerate efforts or risk falling behind competitively. And if you’re ahead, that can be a point of pride and further motivation to maintain leadership. The key is to treat AI adoption as an ongoing journey – regularly review the metrics, celebrate progress, and set new goals as needed.
In conclusion, tracking employee usage of Claude Enterprise is a vital practice for any organization serious about harnessing AI’s potential. It provides the strategic visibility needed to guide adoption, ensure compliance, and maximize the return on your AI investments.
By tracking Claude usage and acting on the insights, you ensure that AI becomes not just a buzzword at your company, but a measurable driver of performance and innovation.
Can my employer see my Claude chats?
By default, no. Claude Enterprise's analytics dashboard shows admins usage metadata — active users, message frequency, projects, and spend — not conversation content. However, if your organization has enabled the Compliance API, a Primary Owner can grant programmatic access to chats, uploaded files, and project contents for compliance and data-loss-prevention purposes. Whether your conversations are reviewable depends on your organization's specific configuration and policy.
Does Claude Enterprise have audit logs?
Yes. Audit log events are available through the Compliance API, giving security and legal teams a view of activity across Claude deployments, with the ability to retrieve or delete content and stream events into SIEM tooling.
How do I export Claude usage data?
Three ways: CSV export from the analytics dashboard (per-user, per-model, up to 90 days back, updated daily), the Analytics API for programmatic access (refreshes every four hours), and for Claude Code contribution data, a full-org CSV export from the leaderboard.
What's the difference between Team and Enterprise analytics?
Both plans include the core analytics dashboard and Claude Code analytics. Enterprise adds the Analytics API, the Compliance API, and spend reporting for organizations with usage credits enabled.
How do I measure whether Claude is actually improving productivity?
Native analytics tell you who uses Claude and how much — they can't tell you what changed as a result. Connecting usage data to outcome metrics (focus time, cycle time, collaboration patterns) requires combining it with your other workplace data, which is what Worklytics does


