.jpg)
Claude Code has gone from terminal curiosity to a primary way software gets written in many organizations. That shift raises a question engineering leaders are now expected to answer: how much of our shipped code involves Claude Code, who has adopted it, and is it worth what we're paying for it? Unlike chat-based AI tools, agentic coding assistants do real, attributable work - which means the measurement story is both richer and easier to get wrong.
Anthropic now ships substantial analytics for Claude Code. This guide covers what the native dashboards measure, how PR attribution actually works, where the costs show up, what admins can and can't see, and where native analytics stop being enough.
Where you look depends on how your organization buys Claude:
The Team/Enterprise dashboard tracks four things:
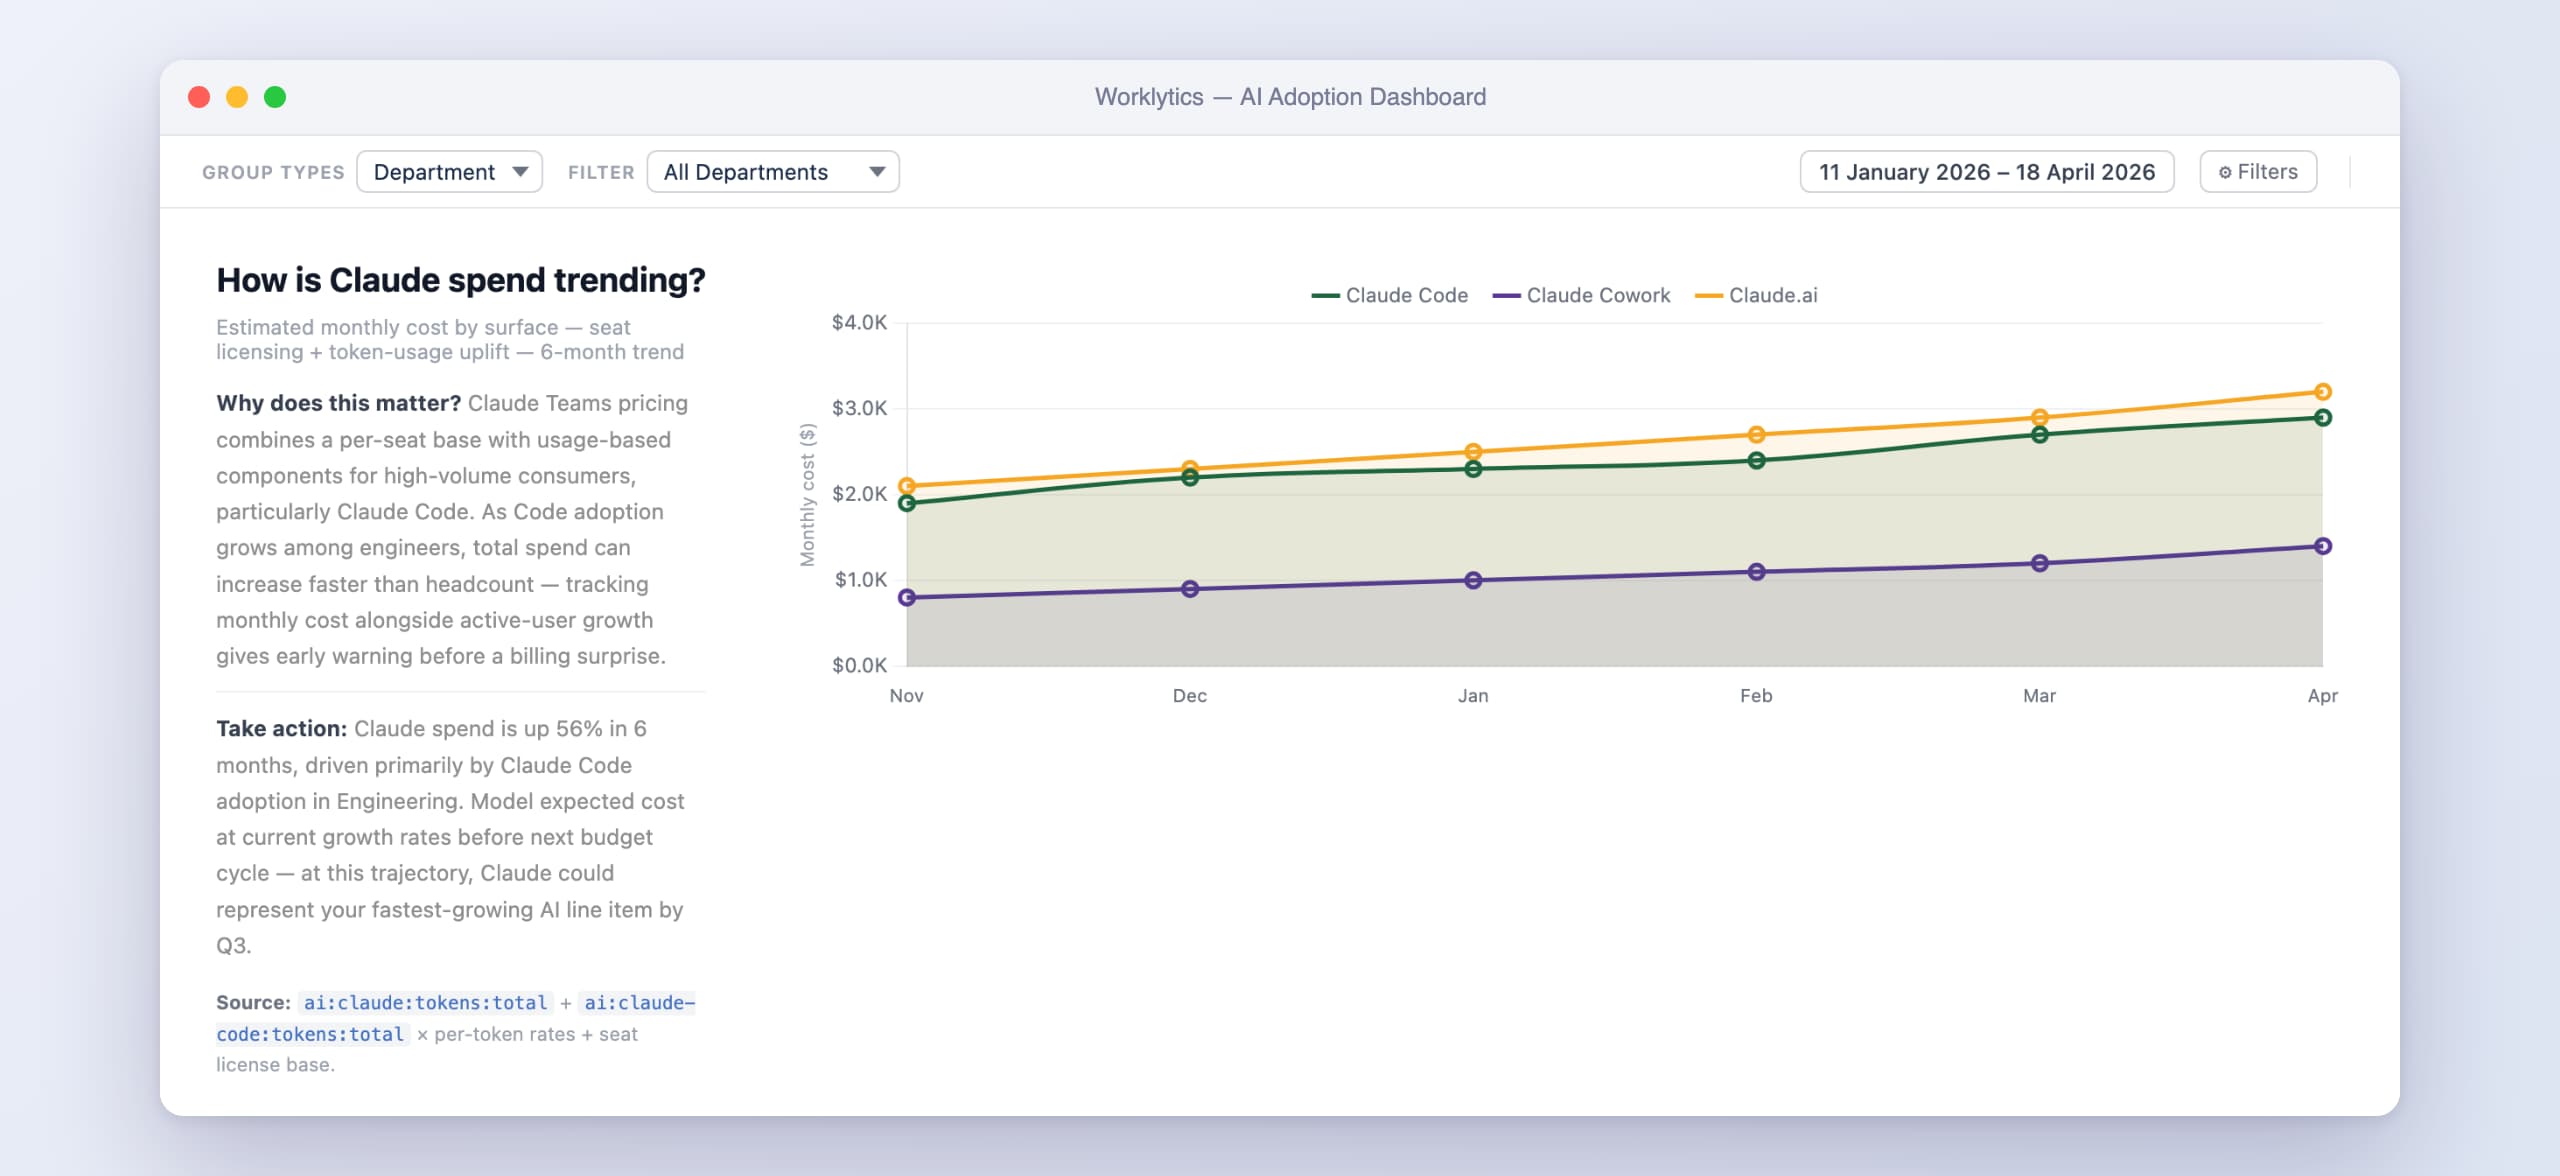
The Console version for API customers adds spend tracking: daily API costs alongside user counts, plus a per-user table of spend and accepted lines for the current month. (Anthropic notes these spend figures are estimates - reconcile against your billing page.)
This is the most interesting part of Claude Code's analytics, because it answers the question usage metrics can't: did any of this make it to production?
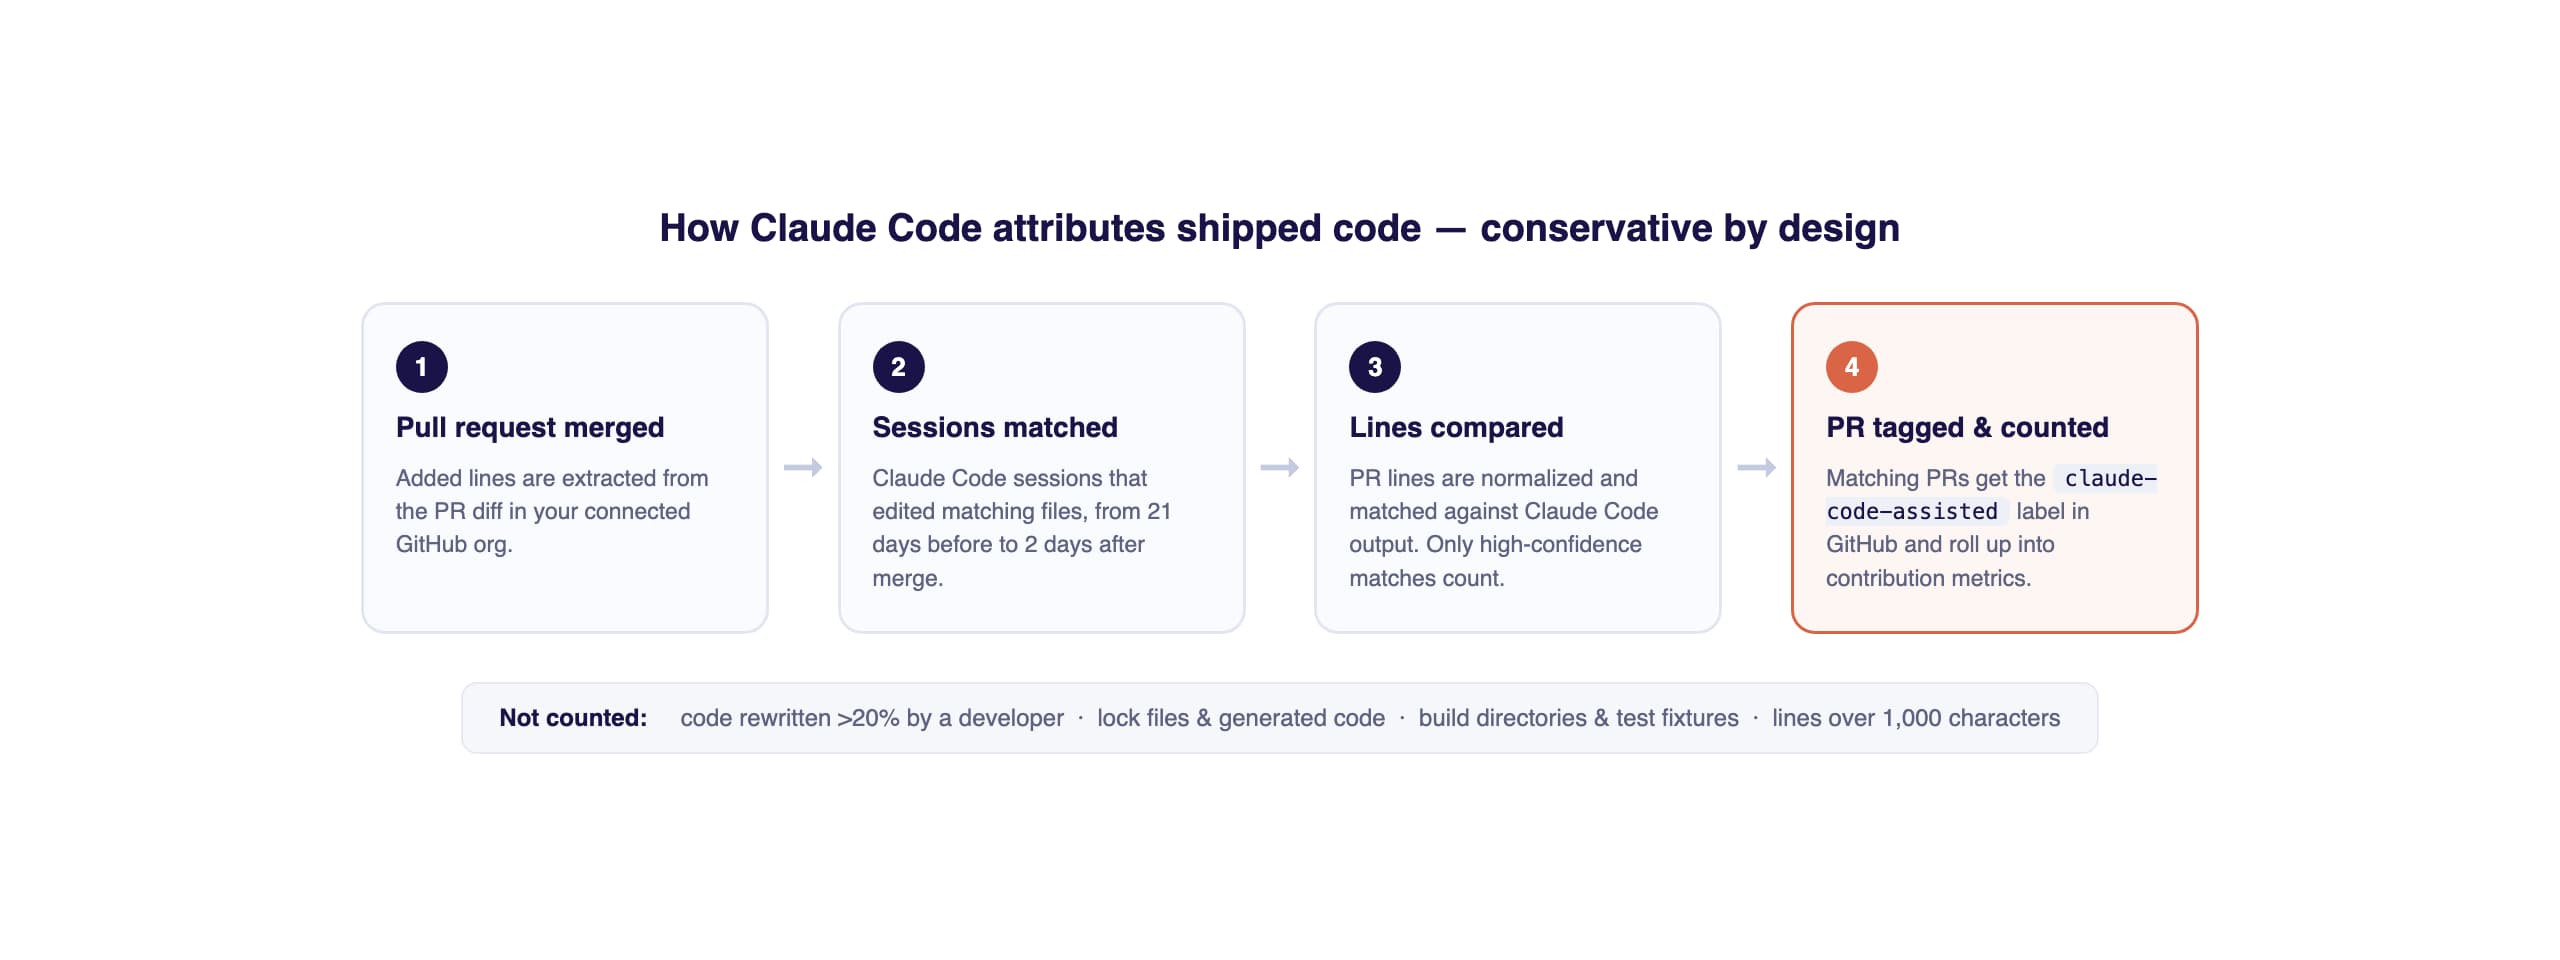
With the GitHub integration enabled (a GitHub admin installs the Claude GitHub app, then a Claude Owner enables analytics under admin settings), Claude Code matches session activity against merged pull requests. PRs containing code written during a Claude Code session get counted as "PRs with Claude Code" and labeled claude-code-assisted in GitHub - which means you can query them directly in your own tooling.
The attribution methodology is deliberately conservative, and that's worth understanding before you present these numbers to a board:
In other words, the "lines of code with Claude Code" number is a floor, not a ceiling. If your dashboard says 30% of shipped code involved Claude Code, the true figure is higher.
Two caveats: contribution metrics are in public beta on Teams and Enterprise plans, and they are not available for organizations with Zero Data Retention enabled - ZDR orgs see usage metrics only. They also only cover your claude.ai organization; usage through the Console API isn't included.
Claude Code sessions consume dramatically more tokens than chat usage - a single agentic session can run through more tokens than a user's entire week of conversations. Three ways to keep visibility:
If you're managing AI spend across multiple tools, see our guide to tracking LLM token usage and cost for the attribution architecture that makes these numbers actionable.
A question every engineering leader gets from their team: is this surveillance?
Claude Code's analytics show usage and contribution metadata - sessions, accepted lines, PR involvement - not the prompts developers write or the conversations they have. The leaderboard shows who uses Claude Code most, not what they asked it.
Conversation-level access exists only through Claude Enterprise's Compliance API, which requires a Primary Owner to create a dedicated access key and is designed for security and legal teams running DLP and audit workflows - not for managers reading prompts. We cover that boundary in detail in our guide to tracking Claude Enterprise usage.
This distinction matters beyond ethics: teams that believe they're being watched use AI tools less, and visibly metadata-only measurement is one of the compliance-safer approaches to workplace analytics under GDPR and similar regimes.
Three gaps show up once you operationalize this:
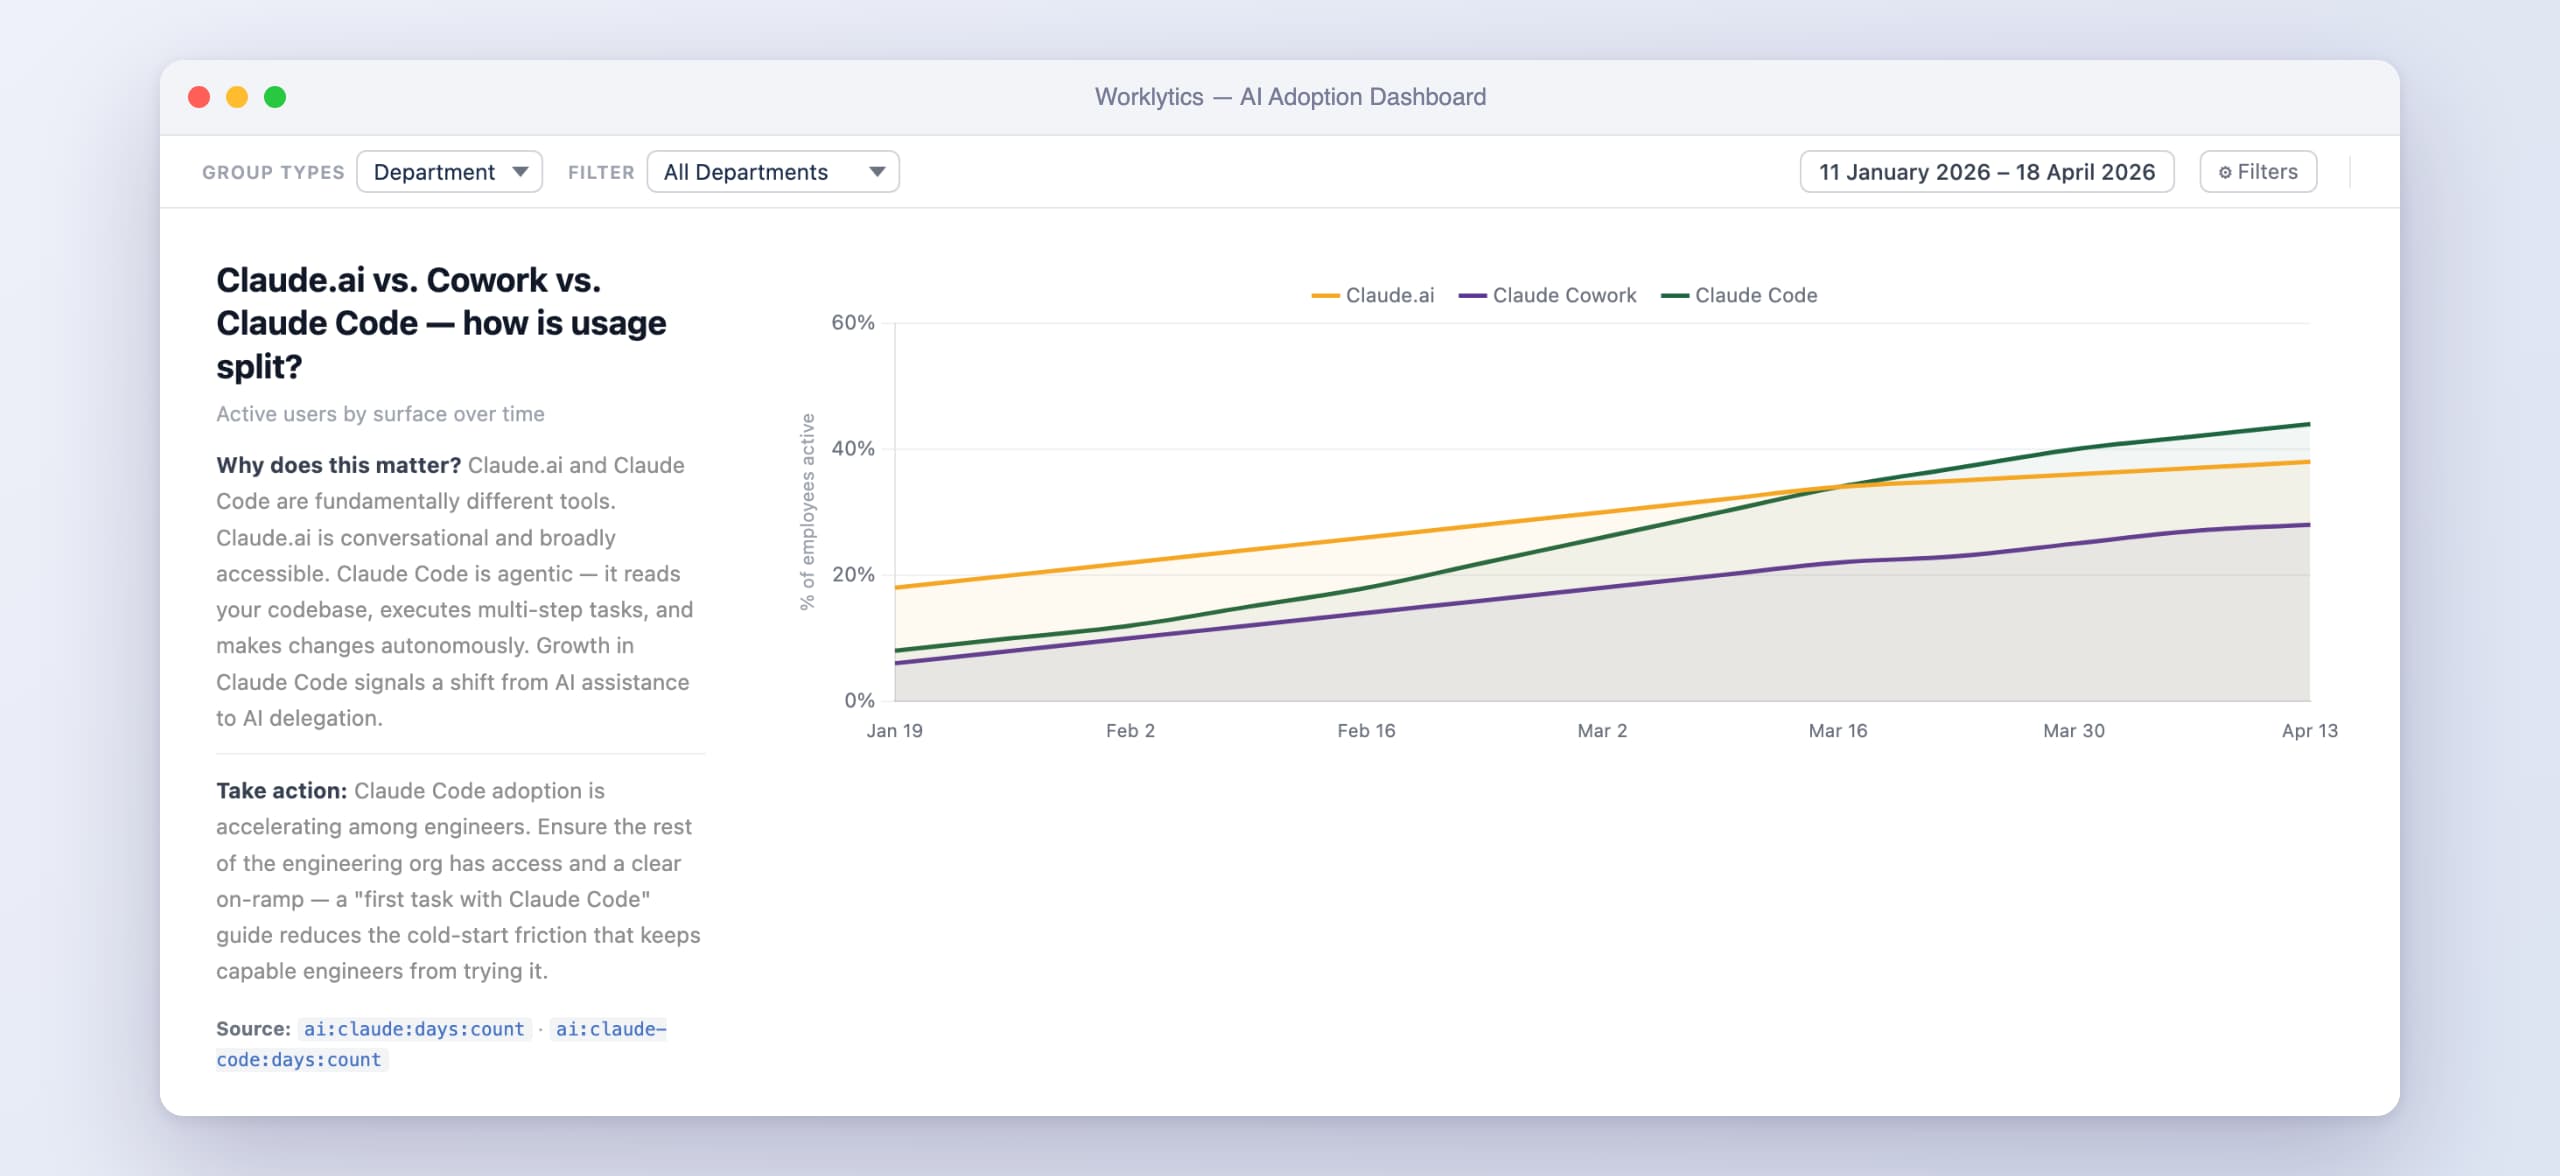
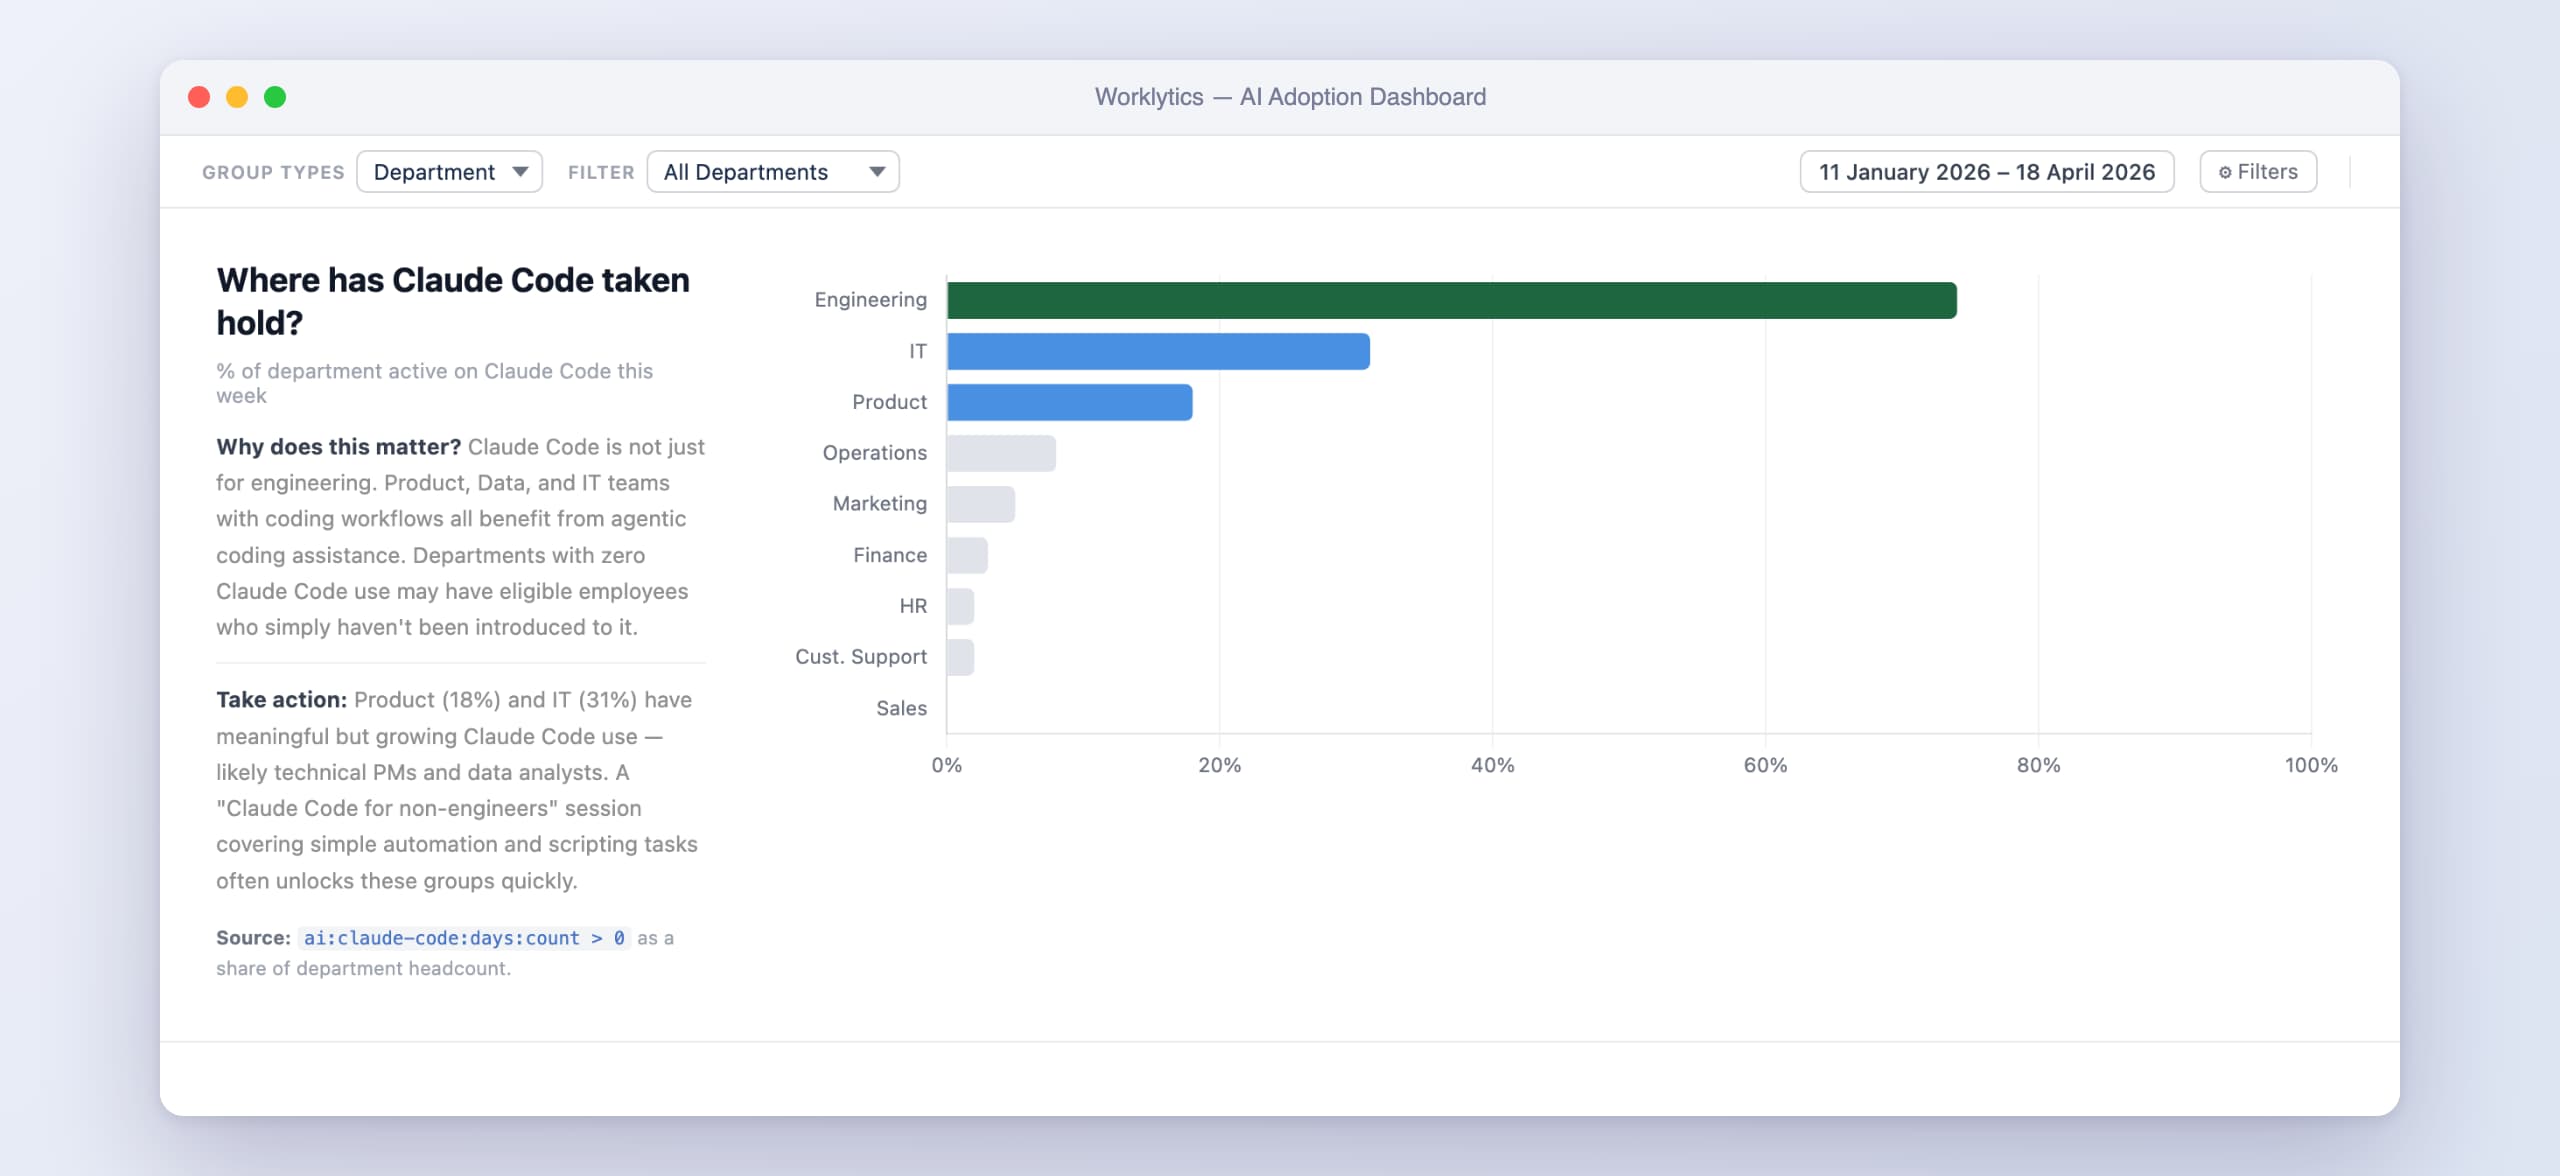
This is the gap Worklytics closes. We combine Claude Code usage signals with data from your other AI tools (Cursor, Copilot, ChatGPT Enterprise, Gemini) and your collaboration stack to show AI adoption by team and role, benchmark it against 2025–26 software engineering productivity baselines, and connect adoption to outcome metrics - all privacy-first, with no prompt content collected. Explore the AI adoption dashboard to see what that looks like in practice.
Running OpenAI's agent too? See our guide to tracking Codex usage across your org.
Can admins see Claude Code prompts?
No. Claude Code's analytics dashboards show usage and contribution metrics - sessions, lines of code accepted, PRs shipped with assistance - not prompt or conversation content. Conversation-level access exists only through Claude Enterprise's Compliance API, which is restricted to keys created by a Primary Owner for compliance workflows.
How does Claude Code decide a PR was "AI-assisted"?
When contribution metrics are enabled, merged PR diffs are matched against Claude Code session output from a window of 21 days before to 2 days after the merge. Only high-confidence matches count, code rewritten more than 20% by a developer is excluded, and auto-generated files are filtered out. Matching PRs are labeled claude-code-assisted in GitHub.
Does Claude Code analytics work with Zero Data Retention?
Partially. Organizations with ZDR enabled get usage metrics (active users, sessions, accept rates) but not contribution metrics, which require session data that ZDR prevents retaining.
Can individual developers on Pro or Max plans see this?
No - the analytics dashboards are for Team, Enterprise, and Console (API) organizations. Individual plans don't include usage analytics.
How do I export Claude Code usage data?
Three routes: the leaderboard's "Export all users" CSV (full contribution data, not just the top 10), the Claude Code Analytics API for programmatic access, and OpenTelemetry export for real-time token and cost metrics in your own stack.