
TLDR:
Most cloud services bill on a fixed unit: a request, a compute hour, a GB of storage. The cost of a single API call is predictable before you make it. LLM pricing breaks this model entirely.
The cost of a single call to any major language model depends on four variables that only resolve at runtime:
A prompt containing a long document context might cost thirty times more than a short question, even though they produce identically sized responses. A coding assistant that writes verbose explanations will cost more per session than one configured to respond concisely. A reasoning-capable model like OpenAI's o-series incurs chain-of-thought token costs that are invisible in the response but fully billed. None of this is captured by request counts or uptime metrics.
The practical consequence: LLM costs compound quietly. Developers testing prompts, automation jobs running overnight, or a new feature passing unnecessarily large context windows can each double a monthly bill without triggering any standard infrastructure alert. Teams that treat LLM APIs like any other third-party service discover the problem only when the invoice arrives.
A token is not a word. Most large language models use subword tokenization, typically via byte-pair encoding (BPE). In practice, a token averages roughly 0.75 words in English, meaning a 1,000-word document is approximately 1,333 tokens.
Tokenization varies significantly by content type:
Understanding this matters because prompt engineering decisions are directly cost decisions. Adding a 500-word background context to every prompt adds roughly 667 input tokens to every call. At GPT-4o's pricing of $2.50 per million input tokens, that addition costs $0.00167 per call — and across 100,000 daily calls, that is $167 per day, or roughly $5,000 per month from a single prompt design choice.
Key implication: Tracking "API cost" at the invoice level tells you the total but hides the model mix, the input/output split, and the cache utilization rate. Each of these is a distinct optimization lever that requires token-level data to act on.
If your pipelines ingest web content as context, using a structured web scraping tool to extract clean data rather than raw HTML reduces markup overhead from your input token count.
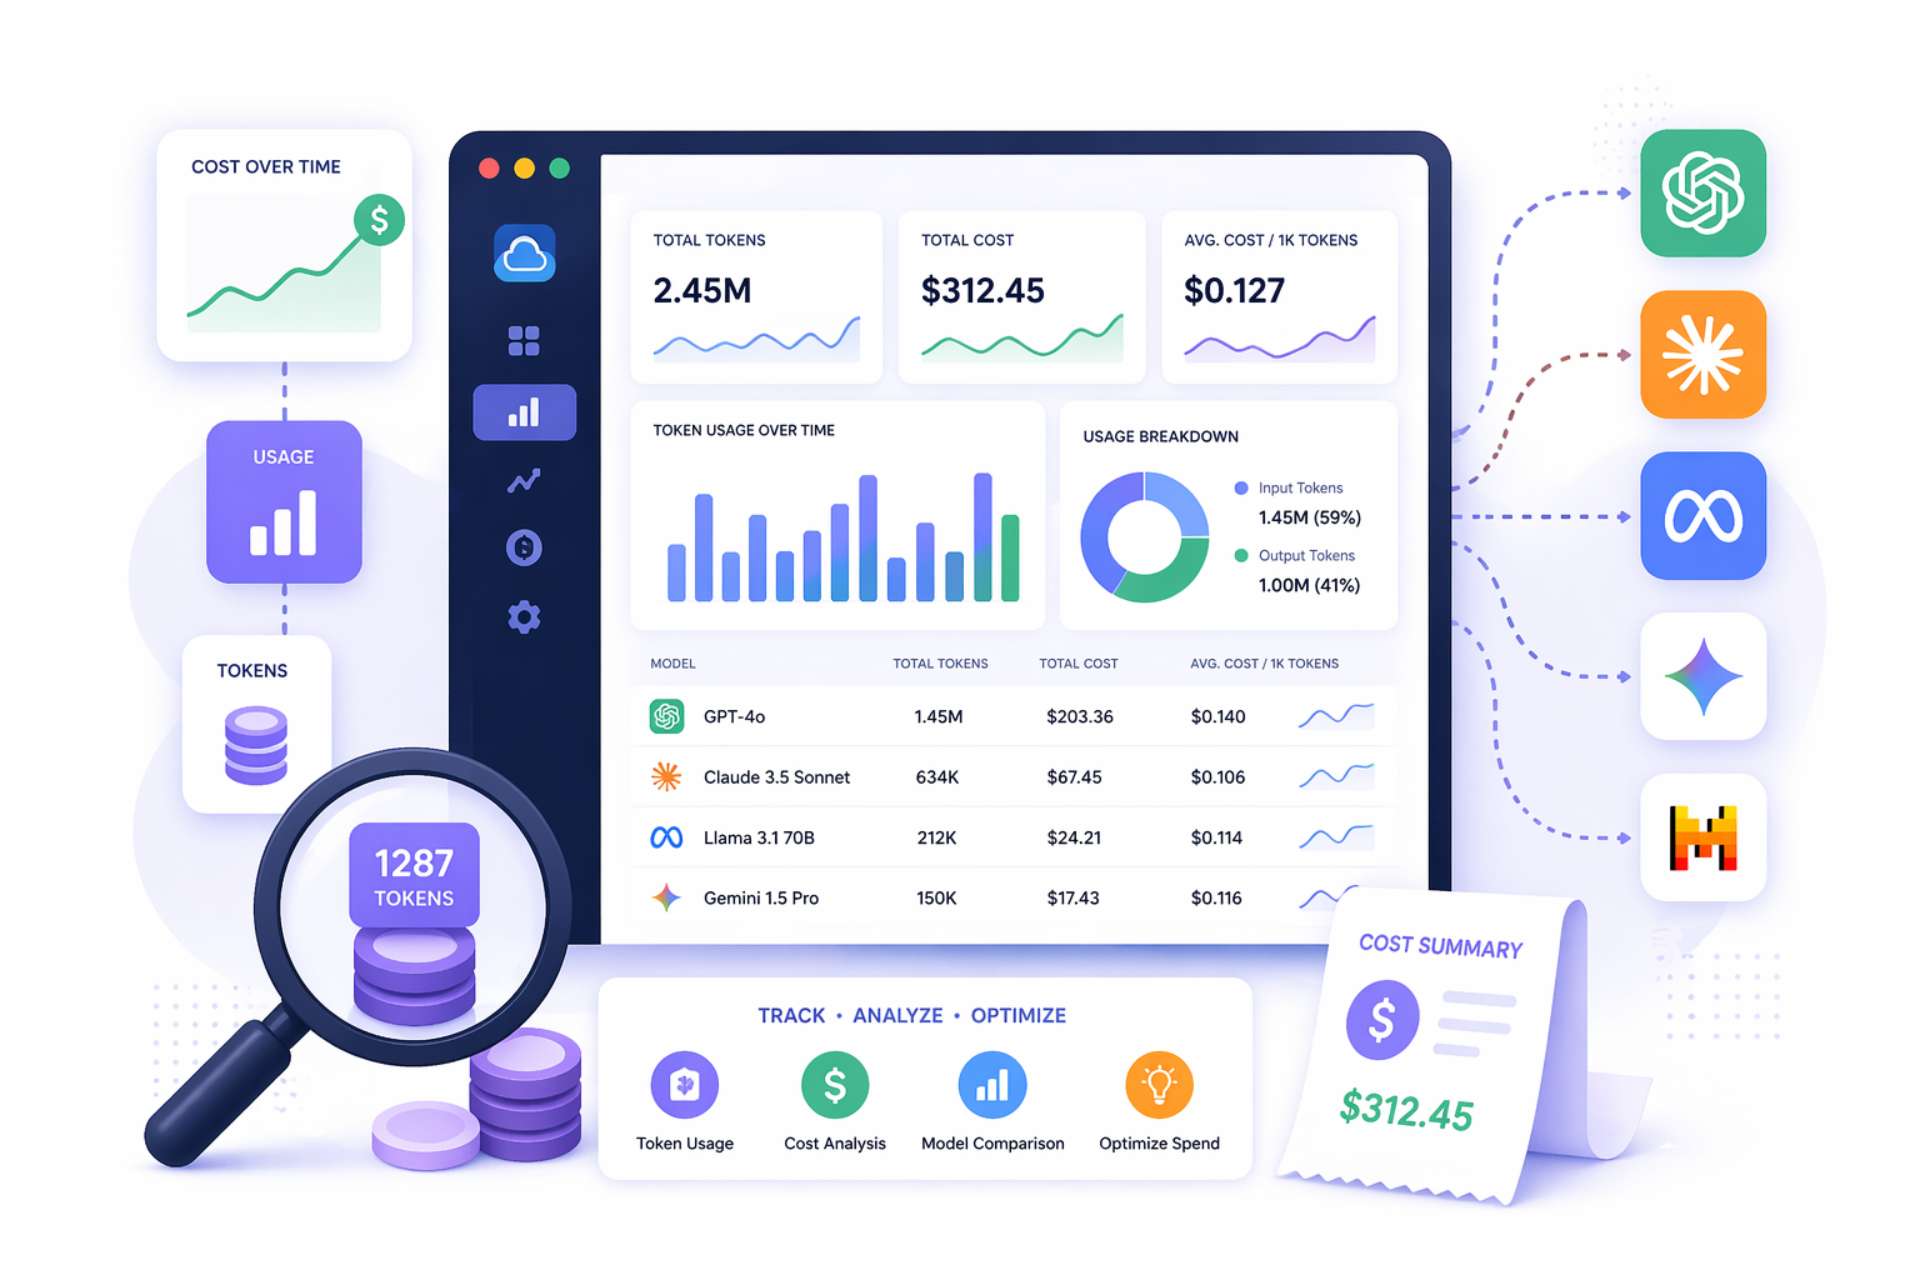
The single most common LLM cost management failure is monitoring aggregate spend without attribution. A dashboard showing "$14,300 spent this month on OpenAI" answers no actionable question:
For every token consumed, your tracking system needs to answer:
The challenge is structural. Most application code calls LLM APIs deep inside functions that have no native context about the business layer above them. A summarization function does not know whether it was called from the document search feature or the email assistant. Without explicit propagation of metadata through the call stack, all cost data lands in the same undifferentiated bucket.
Attribution is a code architecture decision, not just a monitoring configuration. Teams that build it in from the start spend far less effort on cost governance than teams that try to retrofit it after deployment.
Effective token tracking requires instrumentation at four distinct points in the request lifecycle, not just one. Skipping any layer creates a gap that attribution cannot fill.
This is where token counts originate. Every response from OpenAI, Anthropic, and most major providers includes a usage object:
json
{
 "usage": {
   "prompt_tokens": 312,
   "completion_tokens": 87,
   "total_tokens": 399
 }
}
This data is available without any external tool and should be logged on every call. If you are not capturing the usage object from every LLM response, you are discarding the most accurate cost data available.
Raw token counts mean nothing without context. The application layer is where you attach business metadata:
This metadata should be attached at request time, not reconstructed from logs after the fact.
An LLM proxy routes all model traffic through a centralized endpoint before it reaches the provider. This creates a single checkpoint where metadata tagging, token logging, budget enforcement, and model routing all happen automatically, regardless of which application code or team made the call.
The tradeoff is an additional network hop and a dependency on the proxy's availability.
This is where token and cost data is aggregated, visualized, and linked to broader system context. Platforms built on OpenTelemetry propagate application trace context into LLM spans, so you can see not just that a call cost $0.02 but exactly which user action, API endpoint, and function call triggered it.
Metadata tagging is the mechanism that makes attribution work at scale. Every LLM API call should carry a consistent set of key-value pairs identifying its origin.
Partial tagging is the primary reason attribution data becomes unreliable. The main application attaches tags, but internal microservices or background jobs do not, creating gaps that make the data useless for governance purposes.
The tagging standard should be enforced at the infrastructure level through the proxy layer, rather than left to individual developers to implement service by service.
When using an OpenTelemetry-based observability framework, trace context propagation handles much of this automatically. A trace started at the HTTP request boundary carries identifiers like user_id and session_id that are automatically linked to any LLM generation spans created within that trace, without requiring each function to explicitly pass those values down the call stack.
Some tools now ship this natively: Claude Code, for example, supports OpenTelemetry export out of the box, giving you per-user token counts and cost estimates without custom instrumentation.
The tooling landscape for LLM cost tracking has matured significantly through 2024 and 2025. The right choice depends on your team's priorities across four dimensions: engineering control, data sovereignty, provider coverage, and integration complexity.
The criteria that most consistently predict satisfaction:
Tracking token costs tells you what you are spending. It does not tell you whether that spending is working. The missing layer is the connection between LLM expenditure and the human outcomes it is supposed to drive:
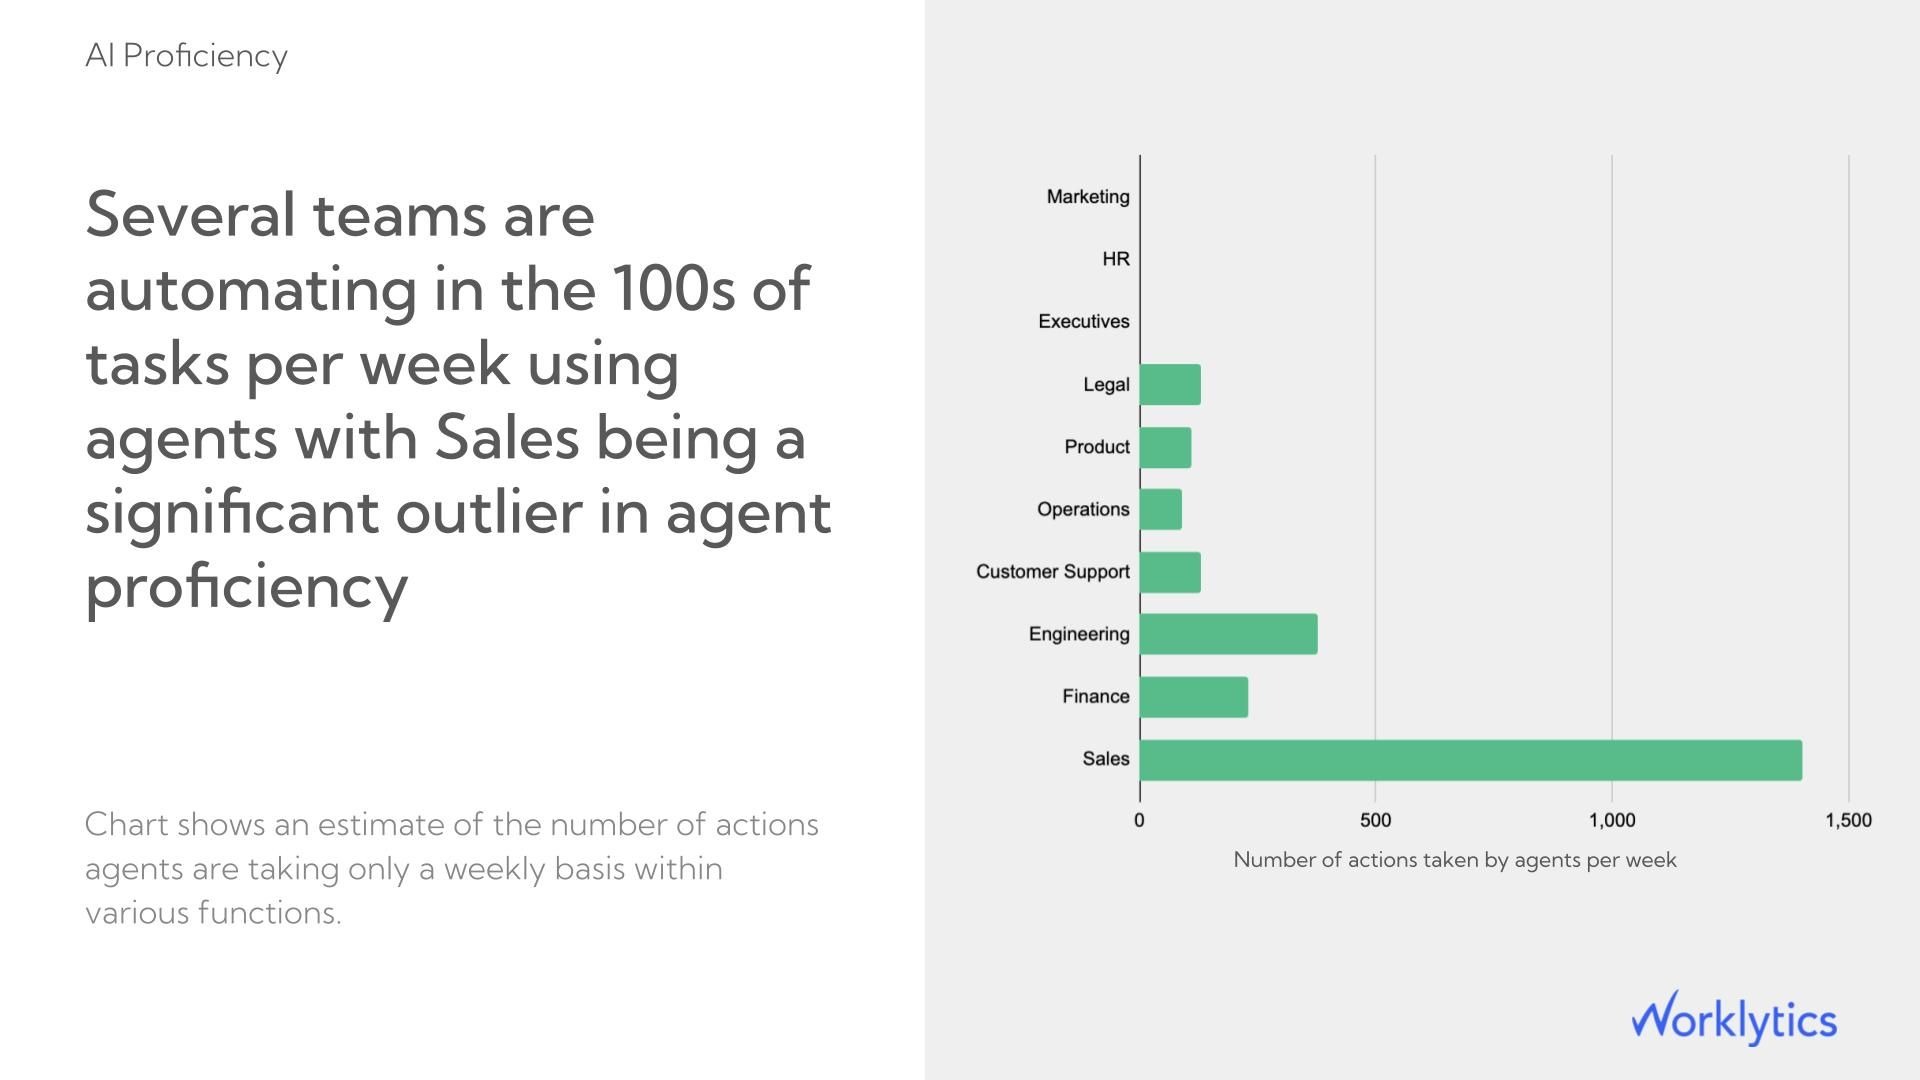
An organization with granular LLM cost attribution by team knows that its engineering team is spending three times more on Copilot than its sales team. But without behavioral signals tied to those same teams, it cannot determine whether that spend reflects high-value usage or inefficient prompt patterns.
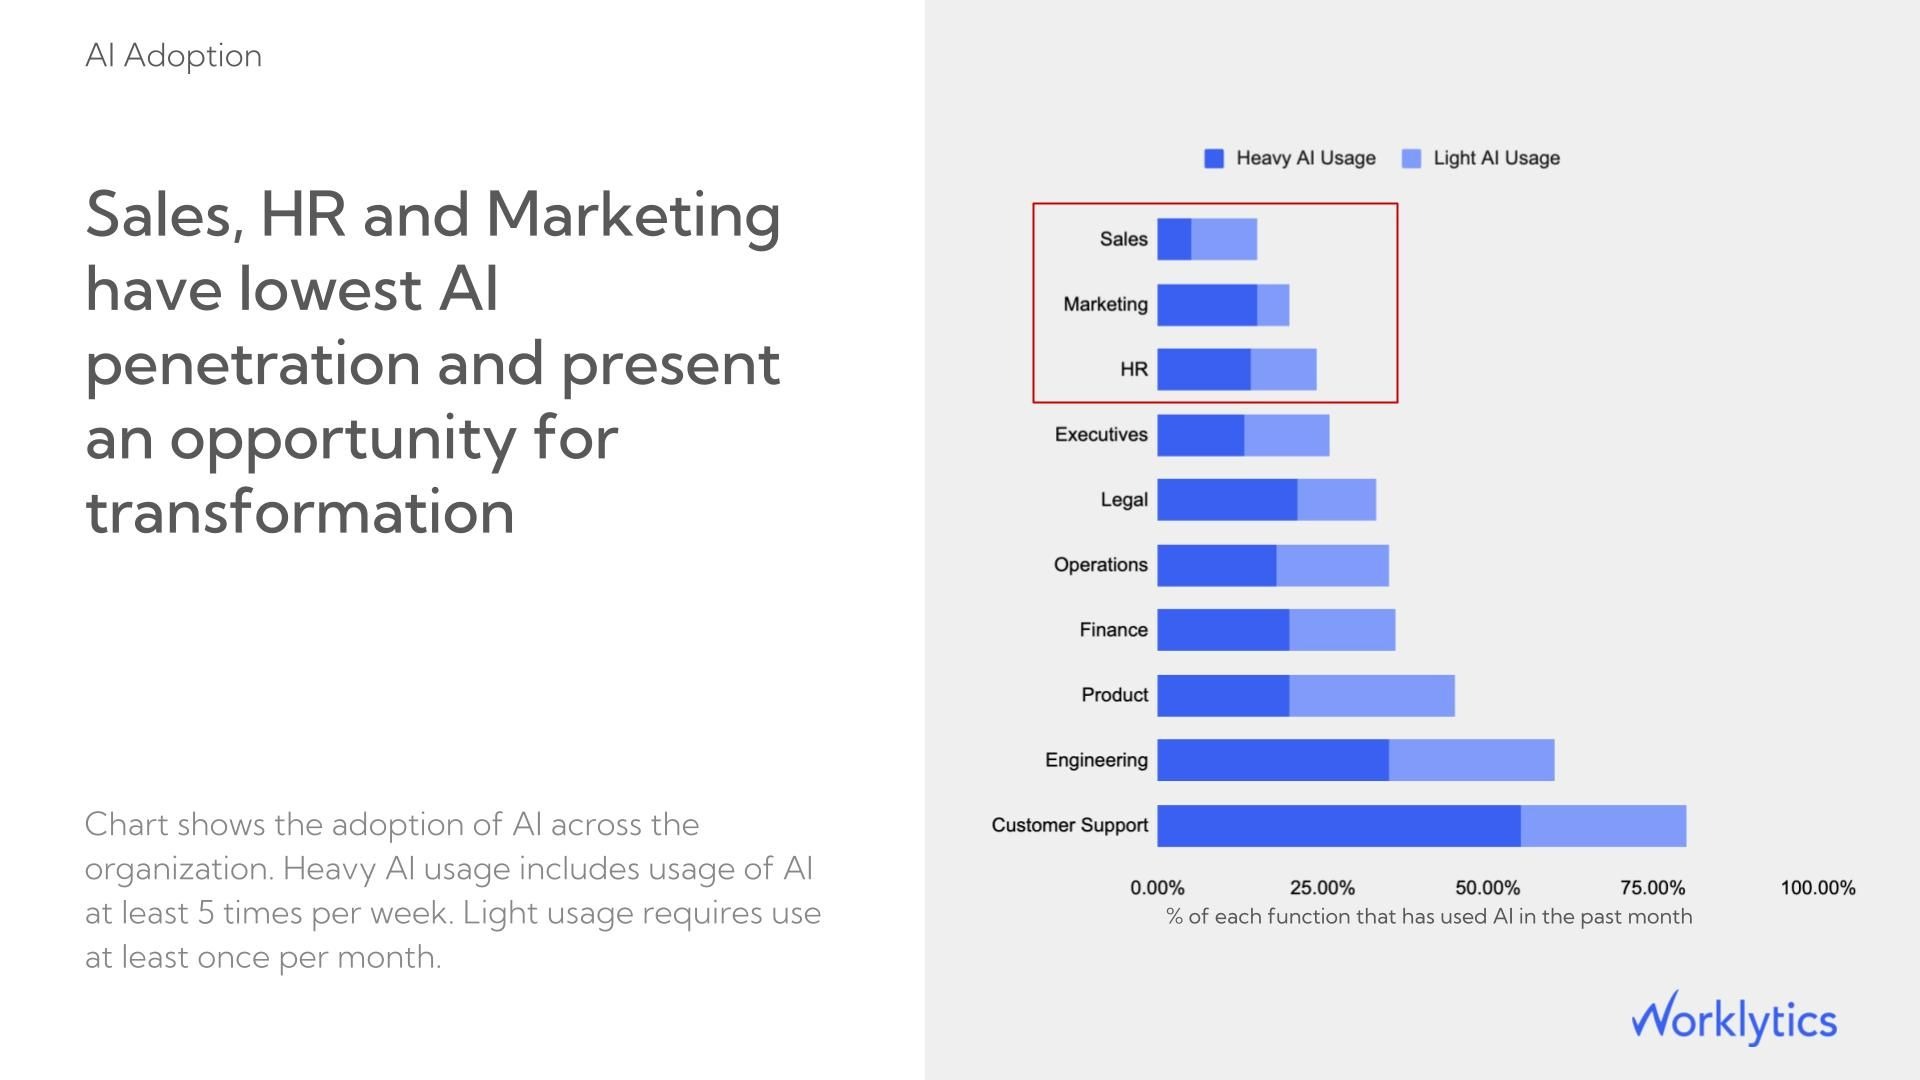
Worklytics connects data from enterprise AI tools including Microsoft Copilot, Google Gemini, and ChatGPT Enterprise to collaboration signals from email, calendar, and project tools. Its AI Adoption Dashboard measures:
Knowing that a department activated an AI tool once is not the same as knowing they rely on it. Worklytics tracks weekly engagement cadence so you can distinguish habitual users whose productivity gains are compounding from those who tried the tool once and reverted to old workflows.
Worklytics identifies the departments and managers where AI adoption has stalled, which is where most enterprise AI programs lose ROI without ever knowing it. Targeted interventions at the manager level where behavior is modeled for entire teams consistently produce faster adoption gains than organization-wide training campaigns.
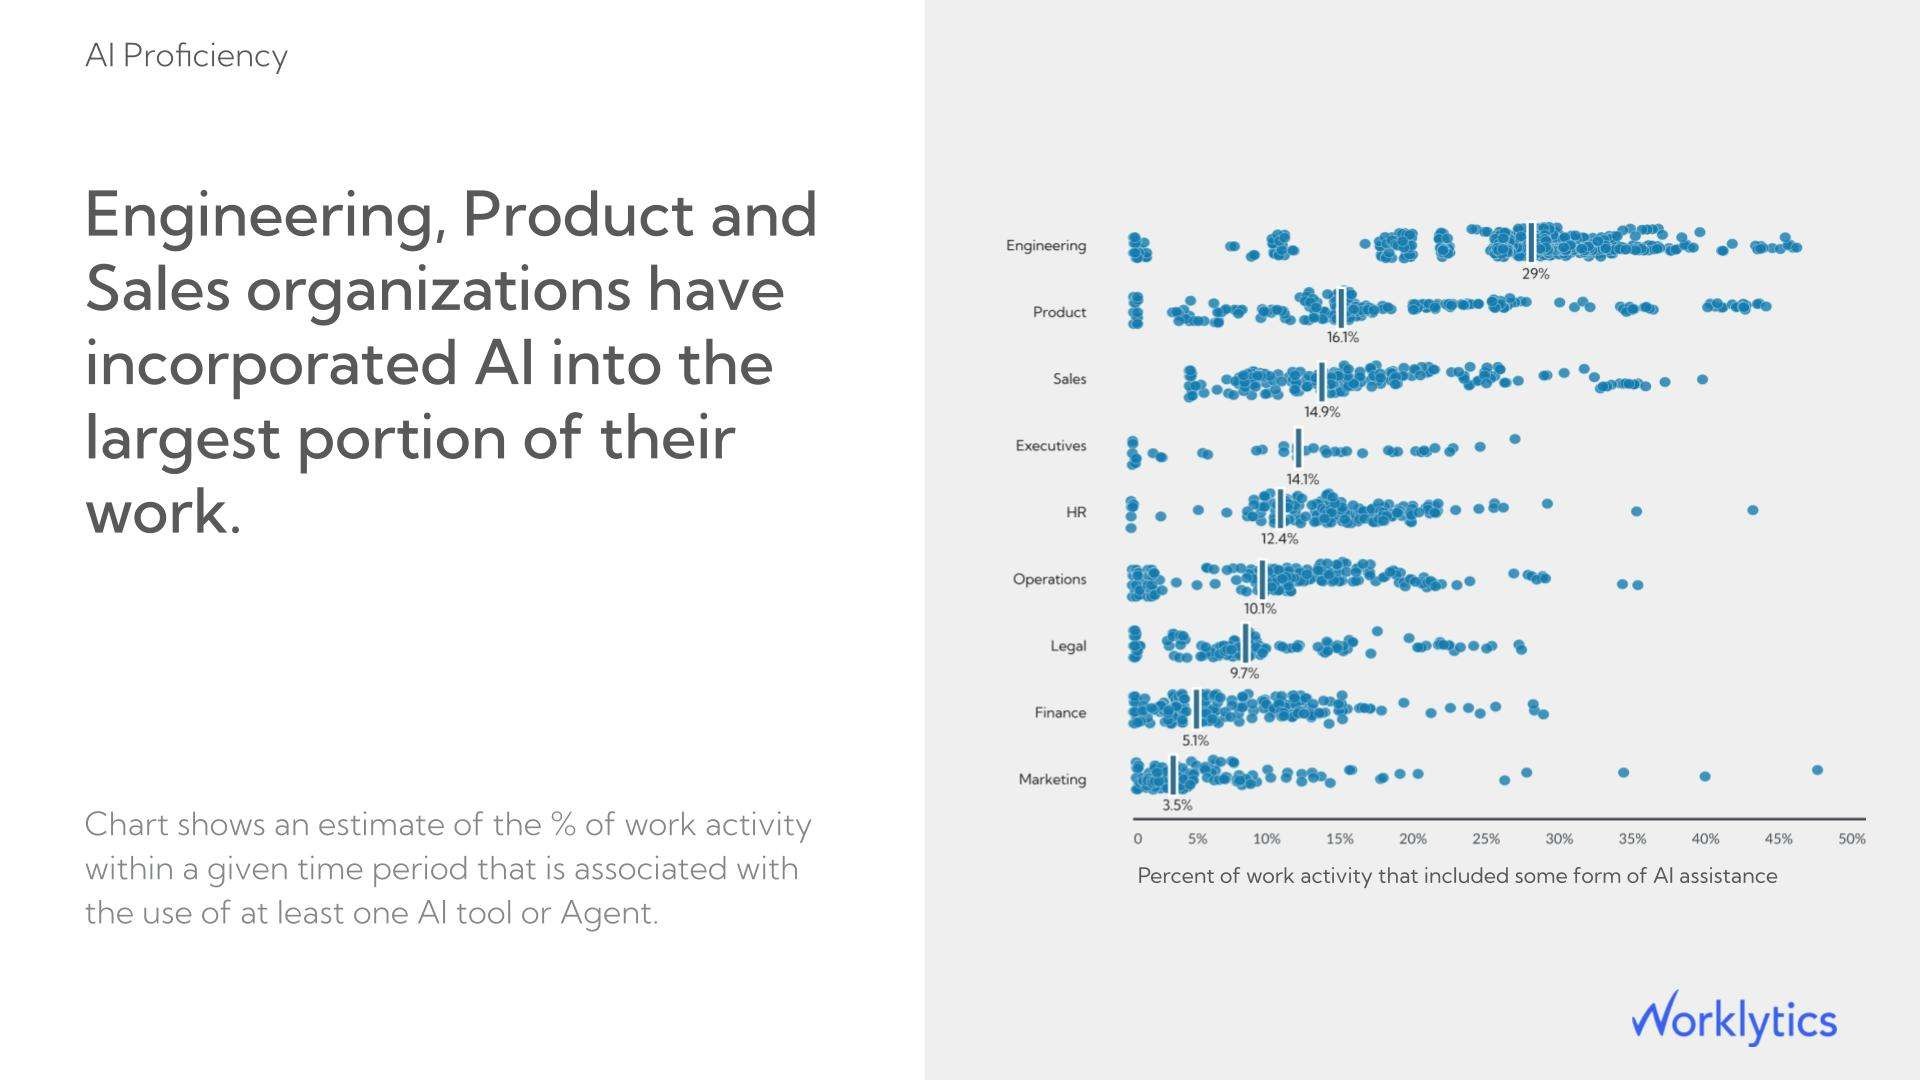
Worklytics links AI usage signals to existing output and collaboration metrics, so you can compare the productivity patterns of high-adoption teams against low-adoption peers over the same period. This is the analysis that converts an AI spend line item into a board-ready ROI story backed by your own organizational data.
Worklytics compares usage across Copilot, Gemini, Claude Enterprise and ChatGPT Enterprise side by side in a single view, so you are not relying on each vendor's self-reported utilization numbers. When one tool is dramatically outperforming another in actual employee engagement, that visibility directly informs your next license renewal decision.
Worklytics links AI usage signals to existing productivity metrics by comparing output and collaboration patterns between high-adoption and low-adoption teams over the same period. This turns "we spent $X on AI licenses" into a defensible ROI calculation for the board rather than a utilization report.
The platform also identifies adoption laggards at the manager and department level, which is where most AI enablement programs break down: not at the technology layer but at the behavioral one.
Organizations that want to measure the full organizational impact of AI need these signals tracked together, not in separate systems.
Worklytics also provides benchmarking against industry peers, giving context for whether a given level of spend is producing above- or below-average adoption outcomes relative to comparable organizations.
Budget alerts are only useful if they trigger early enough to prevent the overrun, not after it has already occurred.
An alert that fires when a single feature exceeds its budget threshold is more actionable than one that fires when total organizational spend exceeds a monthly cap, because it immediately identifies the source without requiring manual investigation.
Avoid setting alerts on monthly budgets alone. Monthly budgets normalize daily variance and consistently under-alert during the first three weeks of a billing cycle. A feature that doubles its daily spend on day three of the month will not breach a monthly alert until far too late.
Use instead: Daily budgets with weekly rolling averages. This catches anomalies that a monthly view misses entirely.
Cost optimization without visibility is guesswork. With per-feature, per-user token data, five specific levers become actionable.
Not every prompt needs the most capable model in your stack. A classification task, a short summarization, or a template-filling request performs adequately on GPT-4o mini or Claude 3 Haiku at 10-20x lower cost than their flagship equivalents.
Route based on: prompt length, task type, or required output complexity.
Any prompt sharing a consistent prefix across many requests is a candidate for provider-level caching.
Implementing caching on long system prompts or frequently referenced documents is often the highest-ROI single change available.
The most common source of unnecessary token consumption is oversized context windows. Applications that naively include full conversation history, large documents, or unrestricted retrieval outputs in every prompt consistently overspend on input tokens.
Fix it by implementing:
For applications where users frequently ask semantically similar questions, serving cached responses to near-duplicate queries eliminates the API call entirely. This is most effective in customer-facing applications with predictable question patterns.
Setting max_tokens on API calls is a direct cost control mechanism, not just a safety parameter. A response capped at 500 tokens cannot overrun that limit regardless of what the model would otherwise generate.
Calibrating output length constraints by use case, rather than leaving them at provider defaults, reduces completion token costs without requiring prompt changes.
Prompt tokens are the input you send to the model: the system prompt, conversation history, retrieved context, and user message. Completion tokens are the output the model generates. Both are billed, but completion tokens are priced higher on most providers because generation is computationally more expensive than processing input.
Models like OpenAI's o-series generate internal reasoning chains before producing a final response. These reasoning tokens are billed as output tokens but are not visible in the response text. Cost tracking tools that rely only on visible completion length will undercount actual spend for these models. You must use the usage object from the API response, which includes total output tokens including reasoning, rather than estimating from response length.
Yes. Metadata-based attribution attaches a user identifier to each API call at the infrastructure layer without capturing or storing the prompt or response content. Platforms like Worklytics operate on the same principle for workforce analytics: usage metadata rather than content, so you know that a user made 47 AI-assisted actions this week without knowing what those actions contained.
LLM FinOps applies financial operations discipline to AI API spending: establishing cost ownership by team, building chargeback and showback reporting, setting enforceable budgets, and continuously optimizing spend without degrading capability. It is structurally identical to cloud FinOps but requires different tooling because LLM costs are token-based rather than resource-based.
The most useful benchmark is cost per unit of business output, not cost per token. Define the relevant output unit for your use case: cost per document processed, cost per support ticket resolved, or cost per code review completed. Tracking this ratio over time shows whether you are getting more efficient as you optimize or whether costs are growing faster than value. Worklytics provides organizational benchmarking against industry peers so you can compare AI adoption outcomes, not just raw spending levels, against comparable organizations.
Worklytics connects AI tool usage data from Copilot, Gemini, and ChatGPT Enterprise to productivity and collaboration signals across the same teams. This makes it possible to show whether teams with high AI adoption are producing more output, collaborating more efficiently, or reducing meeting overhead, providing the evidence needed to justify AI license costs to finance leadership rather than relying on license utilization rates alone.
For teams that need to measure AI adoption and its organizational impact alongside infrastructure cost tracking, Worklytics provides an AI Adoption Dashboard that connects usage signals to productivity outcomes across enterprise AI tools.


