

Meeting overload has reached epidemic proportions in modern workplaces. The average executive spends 23 hours a week in meetings, yet nearly half of those meetings could be cut without impacting productivity (Worklytics). Meanwhile, 65% of employees report that meetings are wasteful, and surveys show that 47% of employees say too many meetings are the biggest waste of time at work (Worklytics).
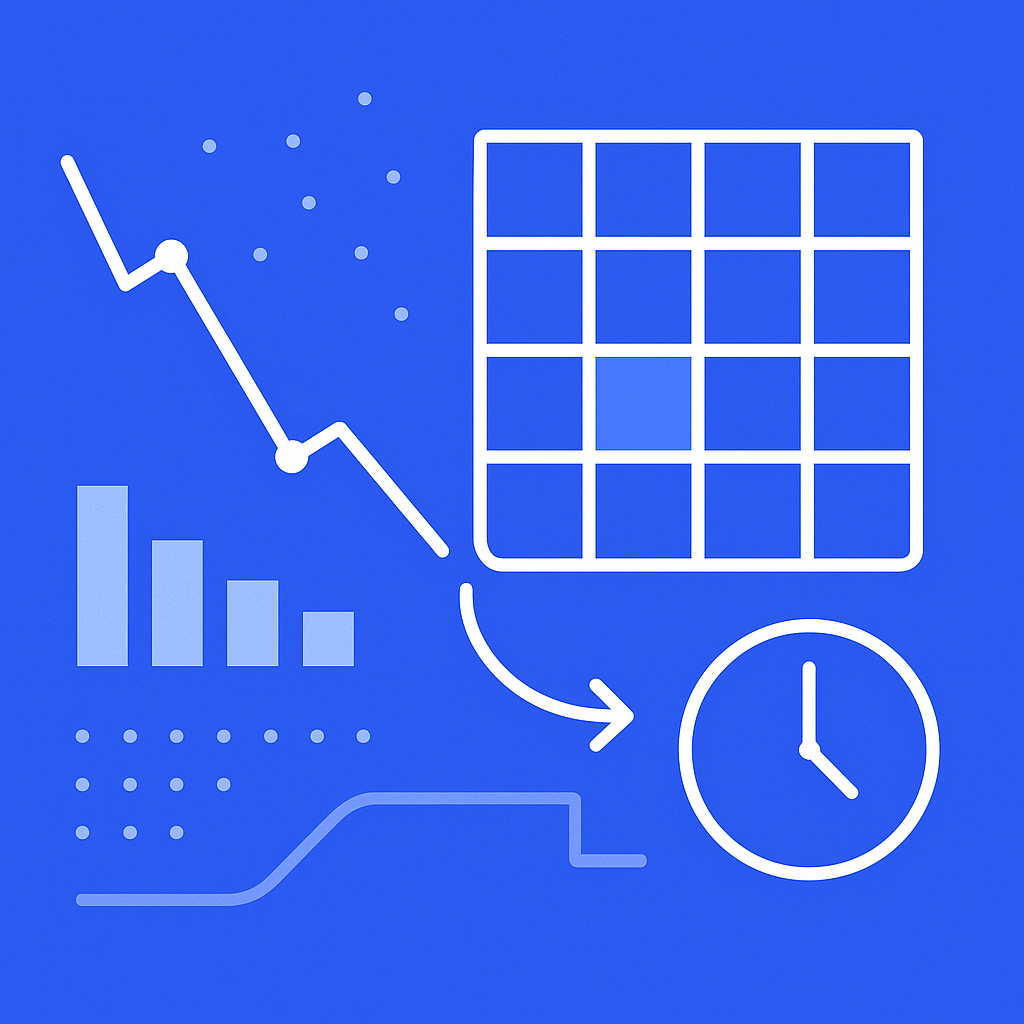
In hybrid and remote work environments, calendars have become battlegrounds where collaboration clashes with focus time, leading to overbooked teams, burnt-out employees, and missed opportunities to do meaningful work (Worklytics). The solution lies in calendar analytics—a data-driven approach that transforms raw calendar metadata into actionable insights for reclaiming focus time and boosting productivity.
This playbook demonstrates how to connect Google Workspace or Microsoft 365 calendars to analytics platforms, identify overloaded teams, implement automated no-meeting blocks, and measure progress using the Focus-Time Ratio metric. By following these tactics, organizations can quantify wins and create sustainable meeting cultures that prioritize deep work alongside necessary collaboration.
The data paints a stark picture of meeting proliferation across organizations. Surveys indicate 71% of senior managers feel meetings are unproductive, and executives estimate 45% of their meetings are pointless (Worklytics). This inefficiency costs businesses billions annually, as inefficient meetings drain resources that could be redirected toward revenue-generating activities (Worklytics).
The shift to hybrid work has fundamentally changed the shape of the workday, elongating the span of the day but also changing the intensity of work (Worklytics). Research suggests that individual productivity may slow during the months immediately following a return-to-office due to a surge in collaboration and meetings (Worklytics).
Calendar analytics offers a powerful way to reclaim control over this chaos. By turning calendar data into insight, HR leaders, executives, and business owners can finally make informed decisions about how time is used and how to use it better (Worklytics).
Modern calendar analytics platforms integrate seamlessly with both Google Workspace and Microsoft 365 environments. Worklytics integrates with Google Calendar data along with over 25 other tools in your tech stack (Worklytics). The platform provides data from more than 25 of the most common collaboration tools and uses machine learning to clean, de-duplicate, and standardize datasets (Worklytics).
For organizations using Microsoft environments, tools like Worklytics integrate with Outlook to turn raw metadata into interactive dashboards (Worklytics). The integration process typically involves:
Calendar analytics platforms must navigate complex privacy requirements while delivering actionable insights. Worklytics uses data anonymization and aggregation to ensure compliance with GDPR, CCPA, and other data protection standards (Worklytics). Over 58% of the workforce now engages in remote work, increasing reliance on employee monitoring tools, and 86% of employees believe it should be a legal requirement for employers to disclose if they use monitoring tools (Worklytics).
The Focus-Time Ratio serves as the cornerstone metric for measuring meeting overload and productivity potential. This metric calculates the percentage of available work time dedicated to uninterrupted focus work versus time spent in meetings and collaborative activities. Worklytics provides real-time team metrics, customizable dashboards, and actionable insights from your Google Calendar data (Worklytics).
A healthy Focus-Time Ratio typically ranges from 60-70% for individual contributors, 40-50% for middle managers, and 20-30% for senior executives. When teams consistently fall below these thresholds, productivity suffers and burnout risk increases.
Calendar analytics platforms can identify several warning signs of meeting overload:
| Red Flag | Description | Impact on Focus Time |
|---|---|---|
| Back-to-back meetings | 4+ consecutive meetings without breaks | Reduces focus time by 80-90% |
| Meeting creep | Average meeting length increasing over time | Fragments remaining focus blocks |
| Recurring meeting bloat | Weekly meetings with 8+ attendees | Creates artificial urgency and FOMO |
| Cross-timezone scheduling | Meetings outside core collaboration hours | Extends workday and reduces deep work |
| Meeting multitasking | Overlapping or double-booked calendar slots | Eliminates focus time entirely |
Worklytics processes and cleans data, generates and pushes over 400 metrics that can help identify these patterns (Worklytics). The platform helps streamline and optimize meetings, track productivity and performance metrics, and provides insight into employee satisfaction, retention, and turnover (Worklytics).
Calendar analytics reveals meeting patterns at both individual and team levels. Consider a company that audited its project calendars and discovered that every team was holding a redundant weekly check-in. By consolidating or removing these, they reclaimed dozens of hours a week (Worklytics).
Worklytics provides real-time metrics to identify the drivers of employee productivity and allows for rapid testing and learning, enabling interventions to be assessed before the next quarter (Worklytics). The platform offers dashboards and reporting for KPIs across various tools, providing a holistic view of team performance (Worklytics).
No-meeting blocks represent dedicated time periods where team members can engage in deep, focused work without interruption. Calendar analytics platforms can automatically suggest optimal time slots based on historical meeting patterns, individual productivity rhythms, and team collaboration needs.
Effective no-meeting block strategies include:
Modern calendar analytics platforms use machine learning to optimize meeting scheduling while preserving focus time. These systems analyze patterns such as:
Worklytics can help ensure remote and hybrid teams are able to have effective and productive meetings (Worklytics). The platform's analytics capabilities extend beyond simple scheduling to provide insights into meeting effectiveness and team collaboration patterns.
Phase 1: Baseline Establishment
Phase 2: Pilot Program
Phase 3: Organization-wide Rollout
Successful calendar analytics initiatives require consistent measurement and optimization. The Focus-Time Ratio serves as the primary KPI, but supporting metrics provide additional context:
Primary Metrics:
Secondary Metrics:
Worklytics highlights when and where burnout is happening, giving HR teams an early warning system for potential burnout (Worklytics). This proactive approach enables organizations to intervene before productivity and employee wellbeing suffer.
Calendar analytics platforms employ sophisticated analysis methods to extract actionable insights:
Workday Intensity Analysis: Workday intensity is measured as time spent on digital work as a percentage of the overall workday span (Worklytics). This metric helps identify when employees are experiencing unsustainable work patterns.
Collaboration Network Analysis: Mapping meeting attendance patterns reveals communication bottlenecks, over-relied-upon individuals, and opportunities for delegation or process improvement.
Temporal Pattern Recognition: Machine learning algorithms identify optimal meeting times, predict scheduling conflicts, and suggest alternative arrangements that maximize both collaboration and focus time.
Quantifying the return on investment for calendar analytics initiatives requires tracking both hard and soft benefits:
Hard Benefits:
Soft Benefits:
Calendar analytics enables systematic meeting audits that identify elimination opportunities. Worklytics can help streamline and optimize meetings by providing detailed analysis of meeting patterns and effectiveness (Worklytics).
Key audit criteria include:
Effective meeting optimization goes beyond elimination to improve the quality and efficiency of necessary meetings:
Pre-meeting Optimization:
During-meeting Enhancement:
Post-meeting Follow-up:
Dropbox enhanced meeting effectiveness by utilizing Dropbox Paper to centralize agendas, notes, and tasks, facilitating streamlined collaboration before, during, and after meetings (Worklytics).
30% of companies are embracing a Structured Hybrid work environment, often defining Anchor Days when all employees are onsite (Worklytics). However, Anchor Days implicitly assume that being together will help us do more, faster, which is not true for all roles (Worklytics).
Calendar analytics can optimize Anchor Day effectiveness by:
Choosing the right calendar analytics platform requires evaluating several key factors:
Integration Capabilities: Worklytics integrates with a wide range of corporate productivity tools, HRIS, and office utilization data to analyze team work and collaboration patterns (Worklytics). The platform can analyze data from various tools including Asana, Bitbucket, ChatGPT Teams/Enterprise, Google Calendar, Google Workspace, Microsoft 365, Outlook Mail, Slack, and Zoom (Worklytics).
Data Processing Power: Worklytics has a pipeline that connects to existing data warehouses or visualization tools (Worklytics). This capability ensures that calendar analytics can integrate seamlessly with existing business intelligence infrastructure.
Privacy and Security: Built with privacy at its core, platforms should use data anonymization and aggregation to ensure compliance with data protection standards while still providing actionable insights.
A robust calendar analytics implementation typically includes:
Data Layer:
Processing Layer:
Presentation Layer:
As organizations grow, calendar analytics systems must scale to handle increased data volume and complexity:
Successful calendar analytics initiatives require support from multiple organizational levels:
Executive Sponsorship:
Manager Engagement:
Employee Adoption:
Calendar analytics initiatives often require fundamental shifts in organizational culture:
From Meeting-Heavy to Focus-First:
From Reactive to Proactive Scheduling:
Cultural transformation requires ongoing measurement and adjustment:
Worklytics can help identify areas to improve diversity, equity, and inclusion efforts at your organization (Worklytics). Calendar analytics can reveal patterns that impact different demographic groups:
Worklytics can help analyze diversity, equity, and inclusion, assess management and leadership metrics, and get insight into employee satisfaction, retention, and turnover (Worklytics). Calendar data provides unique insights into leadership effectiveness:
Advanced calendar analytics platforms use historical data to predict future trends:
Calendar analytics initiatives often encounter data quality challenges:
Incomplete Calendar Data:
Privacy Concerns:
API Limitations:
Scalability Issues:
Change Management Obstacles:
Solution Strategies:
The future of calendar analytics lies in increasingly sophisticated AI applications:
Calendar analytics platforms are expanding to incorporate new data sources:
As workplace analytics mature, regulatory frameworks continue to evolve:
Calendar analytics represents a fundamental shift from intuition-based to data-driven time management. By connecting Google Workspace or Microsoft 365 calendars to analytics platforms like Worklytics, organizations can identify overloaded teams, implement automated no-meeting blocks, and measure progress using the Focus-Time Ratio metric (Worklytics).
The evidence is clear: with executives spending 23 hours a week in meetings and 65% of employees reporting wasteful meeting experiences, the status quo is unsustainable (Worklytics). Organizations that embrace calendar analytics can reclaim up to 40% of their teams' time for focused, high-value work.
Success requires more than just technology implementation. It demands cultural change, executive sponsorship, and ongoing measurement and optimization. By following the tactics outlined in this playbook and mapping each intervention to quantifiable metrics, organizations can create sustainable meeting cultures that balance collaboration needs with individual productivity requirements.
The future belongs to organizations that can optimize the intersection of human potential.
The average executive spends 23 hours a week in meetings, according to Worklytics research. Nearly half of those meetings could be cut without impacting productivity, representing a massive opportunity to reclaim focus time for meaningful work.
Calendar analytics turns calendar data into actionable insights, enabling HR leaders, executives, and business owners to make informed decisions about time usage. It reveals patterns in meeting frequency, duration, and effectiveness to identify opportunities for optimization and focus time recovery.
Yes, by analyzing meeting patterns and identifying inefficiencies, organizations can significantly reduce unnecessary meetings. Since nearly half of current meetings could be eliminated without productivity loss, reclaiming 40% focus time is achievable through strategic calendar optimization and meeting governance.
Worklytics integrates with Google Calendar, Microsoft Outlook, and over 25 other collaboration tools to provide comprehensive calendar analytics. The platform uses machine learning to clean, de-duplicate, and standardize datasets, connecting to existing data warehouses for seamless analysis.
Meeting overload stems from hybrid and remote work environments where calendars become "battlegrounds" between collaboration needs and focus time. This leads to overbooked teams, burnt-out employees, and missed opportunities for deep, meaningful work that drives real productivity.
Teams can use calendar analytics to track metrics like meeting frequency, duration, attendee engagement, and focus time blocks. Worklytics provides real-time dashboards that enable rapid testing and learning, allowing organizations to assess interventions and measure productivity improvements quarter over quarter.


