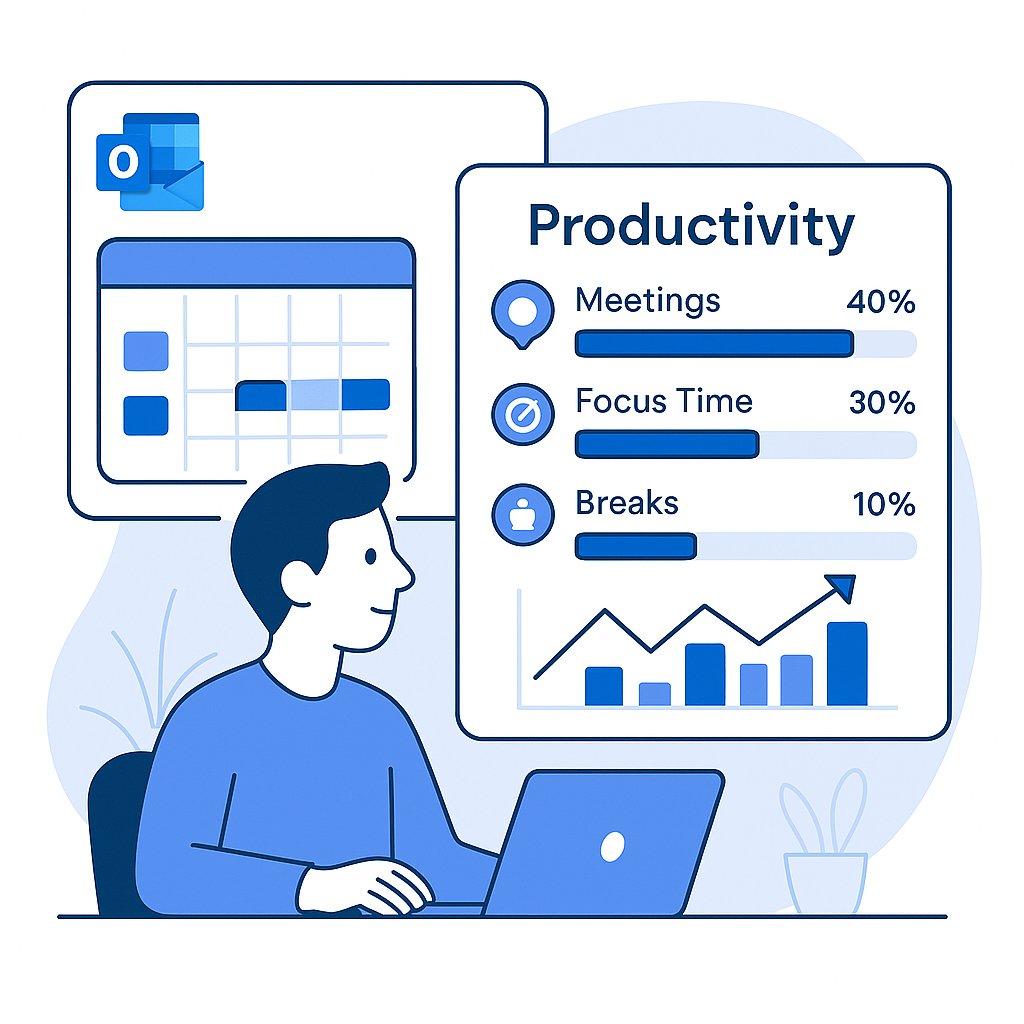
Outlook calendar analytics turns the metadata of Outlook calendar events (when meetings happen, how long they run, how many people attend and whether they repeat) into team-level measures of meeting load, focus time and after-hours work. Track a short set of calendar metrics by team and week, using Microsoft 365's own reports for basic counts and an analytics tool when you need trends across teams and tools.
The need is real. Executives spend an average of nearly 23 hours a week in meetings, up from less than 10 hours in the 1960s, according to Harvard Business Review. This guide covers which calendar metrics to track, what Microsoft's built-in reporting can and cannot show, and how to act on the results.
At its core, Outlook calendar analytics is about making sense of your team's schedule. It uses the metadata of Outlook calendar events, such as meeting length, frequency, number of attendees and time of day, and turns it into a clear picture of how work actually happens. It does not need the content of meetings or invites.
The key is not just collecting data but aggregating and visualizing it. Tools like the Worklytics Outlook calendar integration turn raw metadata into interactive dashboards. These dashboards help leaders answer questions like:
Armed with this information, organizations can identify waste, improve team efficiency, and protect employee well-being.
These are the calendar metrics that say the most about how a team's time is spent. Report them by team and by week, not for individuals.
| Metric | What it shows |
|---|---|
| Meeting hours | Weekly hours in meetings, after removing focus blocks and events with only one attendee |
| Number of meetings | How many separate meetings fill the week, a sign of context switching |
| Recurring meetings | Standing series that make up the baseline load and tend to outlive their purpose |
| Meetings with 10+ attendees | Large meetings where most people mainly listen |
| After-hours meetings | Meetings outside working hours, an early sign of overload or time-zone strain |
| Same-day meetings | One-off meetings created on the day they happen, a sign of reactive scheduling |
| Meeting hours not self-organized | How much of a person's calendar is set by other people |
| External meeting hours | Time spent with customers, partners and other people outside the company |
| Manager 1:1s | How often people meet their manager one to one, and how long since the last 1:1 |
| Hours in focus blocks | Time in uninterrupted blocks of two hours or more on workdays |
| Hours fragmented | Time broken into gaps of less than two hours between meetings and other interruptions |
| Multitasking in meetings | Share of meeting time when people are also sending email or chat messages |
| Unscheduled meeting share | Share of meeting time spent in ad hoc calls with no calendar event (needs video call data) |
| AI notetaker coverage | Share of meetings that include an AI notetaker or recap |
Calendar utilization analytics works best when you read these together. High meeting hours with low focus hours points to overload. Many recurring meetings with 10+ attendees points to meetings worth auditing. A rise in same-day meetings and after-hours meetings often shows a team under pressure before it shows up in a survey. For more measures, see our 12 metrics for effective meetings.
Microsoft offers three ways to report on Outlook calendar data. Each answers a different question.
| Option | What you get | Limits |
|---|---|---|
| Microsoft 365 admin center usage reports | Per-user counts of meetings created and meeting responses, over 7, 30, 90 or 180 days | No meeting hours, meeting size, focus time or team trends |
| Viva Insights | Personal insights in Teams, team insights for managers, and advanced analysis for analysts | Needs Viva Insights licensing; advanced analysis needs at least 50 assigned licenses |
| Microsoft Graph calendar API | Raw calendar events for any time range, for your own reporting | You build the metrics, the cleaning and the privacy rules yourself |
The Exchange email activity report in the Microsoft 365 admin center is the closest thing to a built-in Outlook calendar report. It counts "meeting created" actions (meeting requests sent) and "meeting interacted" actions (accept, tentative, decline or cancel) per user, with trends over the last 7, 30, 90 or 180 days and an export to CSV. It is useful for checking adoption, but it does not show how long meetings run, how many people attend or how much focus time is left. See Microsoft's usage reports overview for the roles needed to view it.
Viva Insights is Microsoft's own calendar and collaboration analytics. Employees get private personal insights in Teams, and team insights show managers habits such as regular after-hours work, meeting overload and too little focus time. Analysts can run custom person queries, use Power BI templates and set a minimum group size in advanced analysis. It needs Exchange Online and Viva Insights licensing, and Microsoft requires at least 50 assigned Viva Insights licenses for advanced analysis (environment requirements). It mainly covers Microsoft 365 data.
Developers can pull events directly with the Microsoft Graph calendarView API, which returns every occurrence of every event in a time range. The least privileged permission, Calendars.ReadBasic, reads events without properties such as the body and attachments (permissions reference). Everything else is up to you: removing focus blocks and declined events, applying working hours, joining HR data for teams, and keeping results private.
Choose an analytics tool when you need weekly trends by team, comparisons across departments, calendar data combined with Teams, Zoom, Slack or email, or metrics in your own data warehouse. That is the gap the Worklytics Outlook calendar integration fills. For a side-by-side view, see Worklytics vs native calendar analytics.
Time is an organization's most valuable resource. Yet it's often spent without intention. When meeting overload becomes the norm, it doesn't just chip away at productivity. It creates a ripple effect of disengagement and burnout.
When Harvard Business Review surveyed 182 senior managers, 71% said meetings are unproductive and inefficient, and 65% said meetings keep them from completing their own work. Every hour lost this way is paid for in salary and in delayed work. HR and executives need visibility into where that time goes before they can win it back.
Back-to-back meetings don't just burn daylight. They burn people out. When employees have no time to think, plan, or even take a breath, stress accumulates. Outlook calendar analytics highlights when and where this is happening, giving HR teams an early warning system for potential burnout.
Executives may believe their time is being spent wisely, but the data often says otherwise. Calendar analytics expose whether leaders are truly prioritizing high-impact projects, key client relationships, or essential teams, or simply stuck in a loop of recurring meetings.
With this level of transparency, leaders can hold themselves and others accountable, initiate changes like meeting-free blocks, and monitor improvements over time.
Meeting bloat happens when unnecessary meetings pile up. It is easy to slip into a culture where every topic gets a sync and every update gets a call. The cost is wasted time, poor engagement and slower execution, and it leaves people little time to do the work the meetings are about.
Calendar metrics show the clearest signs of bloat: people with 30 or more meeting hours a week, recurring meetings with 10 or more attendees, a high share of meeting time spent multitasking, and same-day meetings that break up planned work.
Whether it's declaring a no-meeting Monday or requiring agendas for every invite, the data provides justification. It shifts the conversation from opinion to evidence, enabling leaders to redesign the calendar with confidence.
Tools like Worklytics support this by showing trends such as departments with heavy meeting load or roles that rarely get a two-hour focus block. See meeting effectiveness analytics and our guide to reducing unnecessary meetings.
Beyond meetings, employees today face constant communication through email, messaging apps, and collaboration platforms. While intended to foster alignment, this constant connectivity can become counterproductive.
“Collaboration overload” occurs when people are stretched thin responding to messages, attending calls, and coordinating continuously, leaving them drained.
When everyone is looped into every conversation, productivity can paradoxically drop. Employees stuck in a culture of constant communication often struggle to find time for deep work and may face burnout. When meetings, email and chat all grow at once, focus time shrinks and people switch context more often, which makes for longer workdays. See how distractions and interruptions affect focus time. In other words, too much collaboration is as harmful as too little.
More communication doesn’t mean better communication. It can dilute focus, extend the workday, and lead to context switching, a known killer of deep work. In the rush to stay connected, employees often lose the time they need to think and execute.
Calendar data can highlight this overload by quantifying how much “collaboration time” a team has. For example, analytics might reveal a department where 80% of working hours are spent in meetings or calls – a red flag.
It can also track after-hours meeting volume (are people having lots of evening calls?) as well as meeting sizes (being dragged into large meetings where one’s role is minimal is a form of overload).
If analytics show certain teams or roles are consistently overloaded (say, a manager spending 40 hours/week in meetings and emails), leaders can redistribute responsibilities or hire support to reduce the load.
One of the most damaging but overlooked effects of poor time management is fragmented focus. Even short meetings scattered throughout the day can prevent deep, uninterrupted work.
A common scenario: you have meetings at 9:00, 10:30, 1:00, 2:30, each 30 minutes long. As a result, you never get a solid block of concentration. This fragmentation kills productivity because complex tasks require sustained focus.
Worklytics measures this as fragmented hours (time in gaps of less than two hours) against hours in focus blocks (two hours or more). See fragmented and interrupted time for how the two are calculated.

In the HBR survey of senior managers, 64% said meetings come at the expense of deep thinking. A calendar with no long blocks leaves no room for the work that needs sustained attention, such as writing, analysis, planning or code.
By identifying trends, like engineers having no clear block of time for coding or designers being dragged into constant meetings, leaders can implement solutions. This might mean blocking off Wednesday afternoons for focus or rescheduling recurring calls to consolidate open time.
Worklytics is purpose-built to transform Outlook calendar data into actionable insight. It doesn’t just track hours. It diagnoses patterns, reveals inefficiencies, and guides organizations toward smarter time use.
Worklytics shows weekly meeting hours per person for each team, and splits meetings by size (2 people, 3 to 5, 6 to 9, 10 to 19 and 20 or more), so you can see how much of the organization's time goes into large meetings. It also tracks recurring meetings, after-hours meetings and same-day meetings, so managers can see where overload is building and act on it.

Worklytics measures the balance between collaboration time and focus time. It combines Outlook calendar data with email and chat activity to calculate hours in focus blocks and fragmented hours for each team. After a change such as a no-meeting afternoon, you can compare the same metrics week by week to see whether focus time actually went up. For tips on protecting focus in Outlook itself, see mastering focus time in Outlook.

Worklytics cleans and unifies work data into more than 400 metrics, from meeting counts to collaboration networks, and streams them to your data warehouse or BI tools. See the data dictionary for the full list and how it works for the pipeline. If a new project is causing meeting creep, the trend shows up in the weekly data, not months later.

Calendar analytics should not come at the cost of employee trust. Worklytics is built with privacy at its core:
For example, you might see that the Sales department as a whole had a spike in after-hours meetings, rather than any single person.
Worklytics connects to Outlook calendar through the Outlook calendar integration, with IT's approval, and to over 25 other workplace tools such as Teams, Outlook email, Zoom and Slack. That lets you count ad hoc calls with no calendar event as meeting time, see multitasking during meetings, and track the share of meetings that include an AI notetaker or recap. With all the data in one place, you can see whether fewer meetings lead to more focus time across the organization.
The calendar is the best record most companies have of how time is spent. Start with a handful of Outlook calendar metrics (meeting hours, recurring meetings, large meetings, after-hours meetings and focus hours), report them by team and week, and use Microsoft's own reports where they are enough. When you need trends across teams and tools, an analytics tool such as Worklytics gives you that view while keeping individual data private.
Outlook calendar analytics is the analysis of Outlook calendar metadata, such as meeting times, durations, attendee counts and recurrence, to understand how teams spend their time. It turns individual calendars into team-level measures such as meeting hours, focus time and after-hours meetings. It does not need the content of meetings or invites.
Start with meeting hours, number of meetings, recurring meetings, meetings with 10 or more attendees, after-hours meetings and hours in focus blocks. Add same-day meetings, manager 1:1s and fragmented hours once the basics are in place. Track them by team and week so you can spot overload and compare teams.
The Exchange email activity report in the Microsoft 365 admin center counts meetings created and meeting responses per user over 7, 30, 90 or 180 days. For meeting hours, focus time and team trends you need Viva Insights, your own reporting built on the Microsoft Graph calendar API, or a calendar analytics tool.
Yes. Viva Insights gives employees personal insights in Teams, shows managers team habits such as meeting overload and after-hours work, and gives analysts custom queries in advanced analysis. It needs Viva Insights licensing, and advanced analysis needs at least 50 assigned licenses.
Good calendar analytics software should clean calendar data (removing focus blocks, declined and single-attendee events), report results by team and week, and combine the calendar with other tools such as Teams, Zoom and email. It should also protect privacy by pseudonymizing identifiers and only showing groups above a minimum size. Worklytics does this for Outlook and over 25 other workplace tools.