
At Worklytics, our goal is to understand how work gets done - and how it could get done better.
As we partner with clients onh thorny organizational challenges (from delayering to talent development), we often uncover new metrics to describe modern work. The rise of remote and hybrid work has especially changed work patterns, requiring fresh ways to measure and improve productivity and well-being.
We’re excited to share 4 new ways that we’re modeling how work gets done:
Hybrid work has reshaped our daily routines. Without a commute, people start earlier and often finish later, stretching the overall workday. Microsoft found that the average Teams user’s workday is now 13% longer (about 46 minutes) than it was in early 2020.
But being “online” longer doesn’t mean constant work. Many employees now spread their tasks into shorter bursts throughout the day. Researchers even describe a new “triple peak day” pattern: one productivity peak in the morning, one after lunch, and a third in the evening. This happens as people take midday breaks for family, exercise, or errands and return to work later. During the shift to remote work, Team chats between 6 p.m. and 8 p.m. rose more than any other time of day, showing that after-hours activity has become common.
For most people, hybrid work means longer work spans (being online more) but lower intensity (more breaks and personal tasks mixed in). ActivTrak’s 2025 data shows hybrid workers average 9 hours 50 minutes online, compared to 8 hours 50 minutes for office-based peers, yet they log 8 fewer minutes of productive time per day.
In short, stretching the day out often leads to more context switching and less focus, not more output.
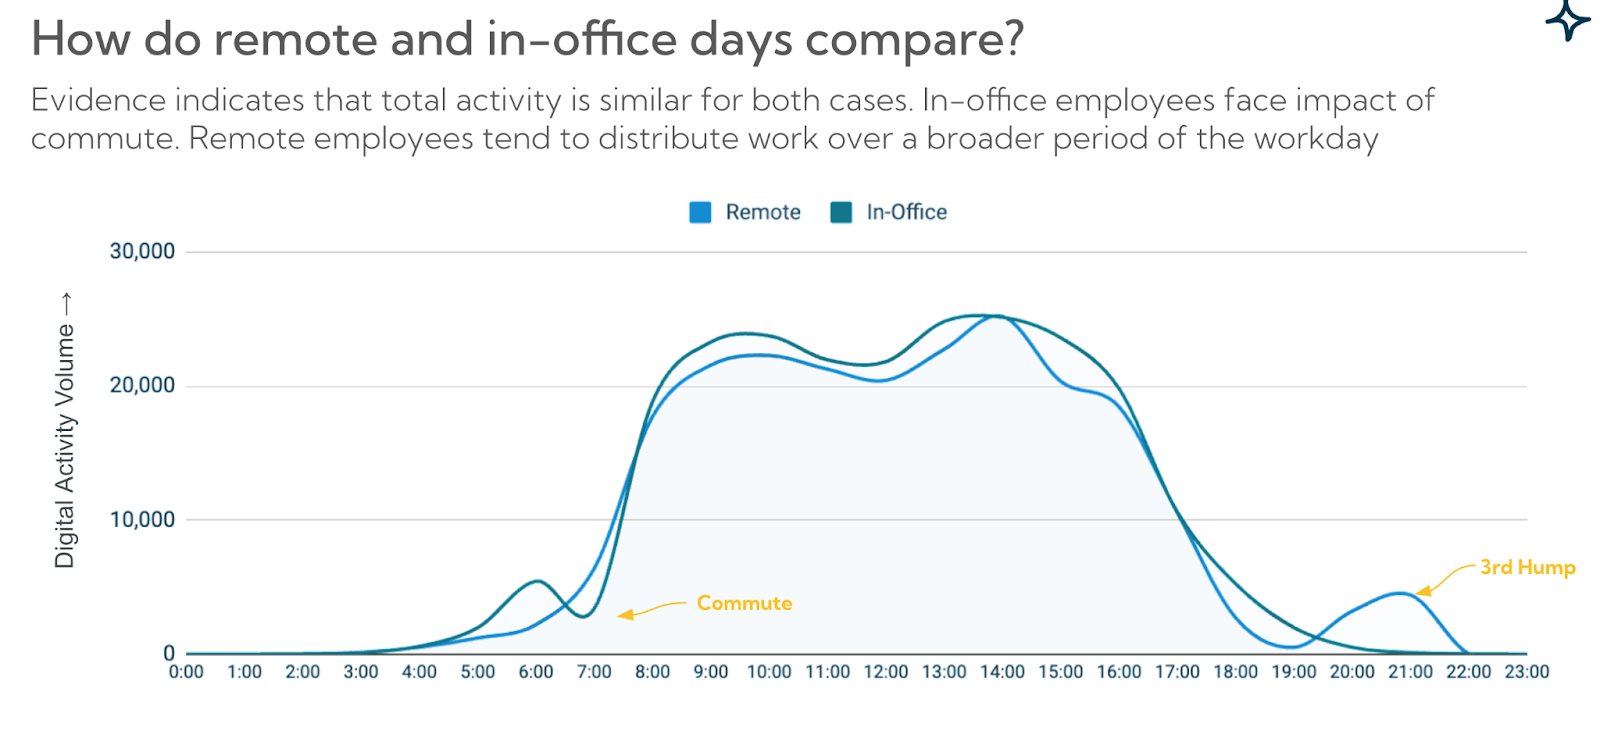
At Worklytics, we define Workday Intensity as the percentage of your total work span spent actively working. For example, if someone is logged in for 10 hours but only works 7 of them, their intensity is 70%. When span goes up, intensity usually dips as people balance home and work.
Worklytics data shows that while total digital activity is similar between remote and in-office days, the patterns of work are quite different. On in-office days, I notice a clear dip in activity during typical commute hours, reflecting the impact of travel time. When working remotely, however, activity is more evenly spread throughout the day — I tend to start a bit earlier and continue later into the evening. This creates a “third hump” in the data, showing how remote work allows me (and others) to distribute work more flexibly across the day.
If both span and intensity rise together, that’s a red flag. It likely means overwork or burnout risk. As Microsoft researchers warn, working through all three “peaks” without real breaks is “a recipe for early burnout.”
Workday Intensity shows how busy someone’s day is, not how effective it is. High intensity might mean nonstop meetings or emails, but not necessarily meaningful work.
Tracking both span and intensity together gives a fuller picture of team health. It helps spot unsustainable patterns, identify burnout risks, and guide healthier work habits.
One of the main reasons workdays keep getting longer is after-hours messaging. Tools like Microsoft Teams, Slack, and email make it easy to send a quick message at night. In hybrid settings, managers often use direct messages to stay connected with their teams. Unfortunately, this can create an “always-on” culture. A late-night message from a manager can quickly set off a chain reaction, as team members feel pressure to respond right away.
Some after-hours communication is unavoidable, especially for global teams or flexible schedules. But it becomes a problem when late-night “fire drills” turn into the norm rather than the exception.
To identify unhealthy communication patterns, start with a few simple metrics:
1. Incoming vs. Outgoing After-Hours Messages
Check whether a team is mostly responding to messages after hours or starting them. Occasionally reacting to late requests is normal, but if a team is often initiating late-night chats, it may point to poor planning or an overloaded schedule.
2. Manager-Initiated After-Hours Messages
Track how often managers send messages to their teams outside working hours. Employees take their cues from leaders, so if a manager frequently sends 10 p.m. messages, it can set the expectation that everyone should be online at all times.
Worklytics data shows that employees who receive more than 15 after-hours Slack messages per week are at a much higher risk of burnout, especially when those messages come from their manager. Microsoft’s data supports this: the average worker now sends or receives over 50 messages outside of core hours, and by 10 p.m., about 30% of employees are still active in their inboxes.
Over time, this level of nightly activity blurs work-life boundaries and drains energy.
HR teams should track the volume and source of after-hours messages. If a particular team or manager shows a pattern of late-night communication, it may be time to set clearer off-hour norms or even introduce “no email after X PM” policies, sometimes called a right to disconnect.
By limiting excessive after-hours communication, organizations protect employees’ personal time and actually boost productivity long-term. Well-rested, disconnected employees get more done during the day and are less likely to burn out.

Manager effectiveness has become a cornerstone of success in hybrid work. With less face-to-face interaction, strong managers are the ones who stay connected, communicate clearly, and support their teams consistently. Measuring how managers lead, such as how often they hold one-on-one check-ins, helps organizations spot strengths and address gaps early.
Managers face a challenging job, especially in the post-pandemic workplace. Many had to quickly adapt to managing remote teams over Zoom, then adjust again to hybrid work and changing company policies. The pandemic redefined what it means to be a good manager, expanding the role to include being more intentional about communication, support, and flexibility.
With these new ways of working come new ways to measure effectiveness. Instead of relying only on engagement surveys or employee satisfaction scores, which are lagging indicators, organizations can now look at everyday management behaviors for earlier signs of team health.
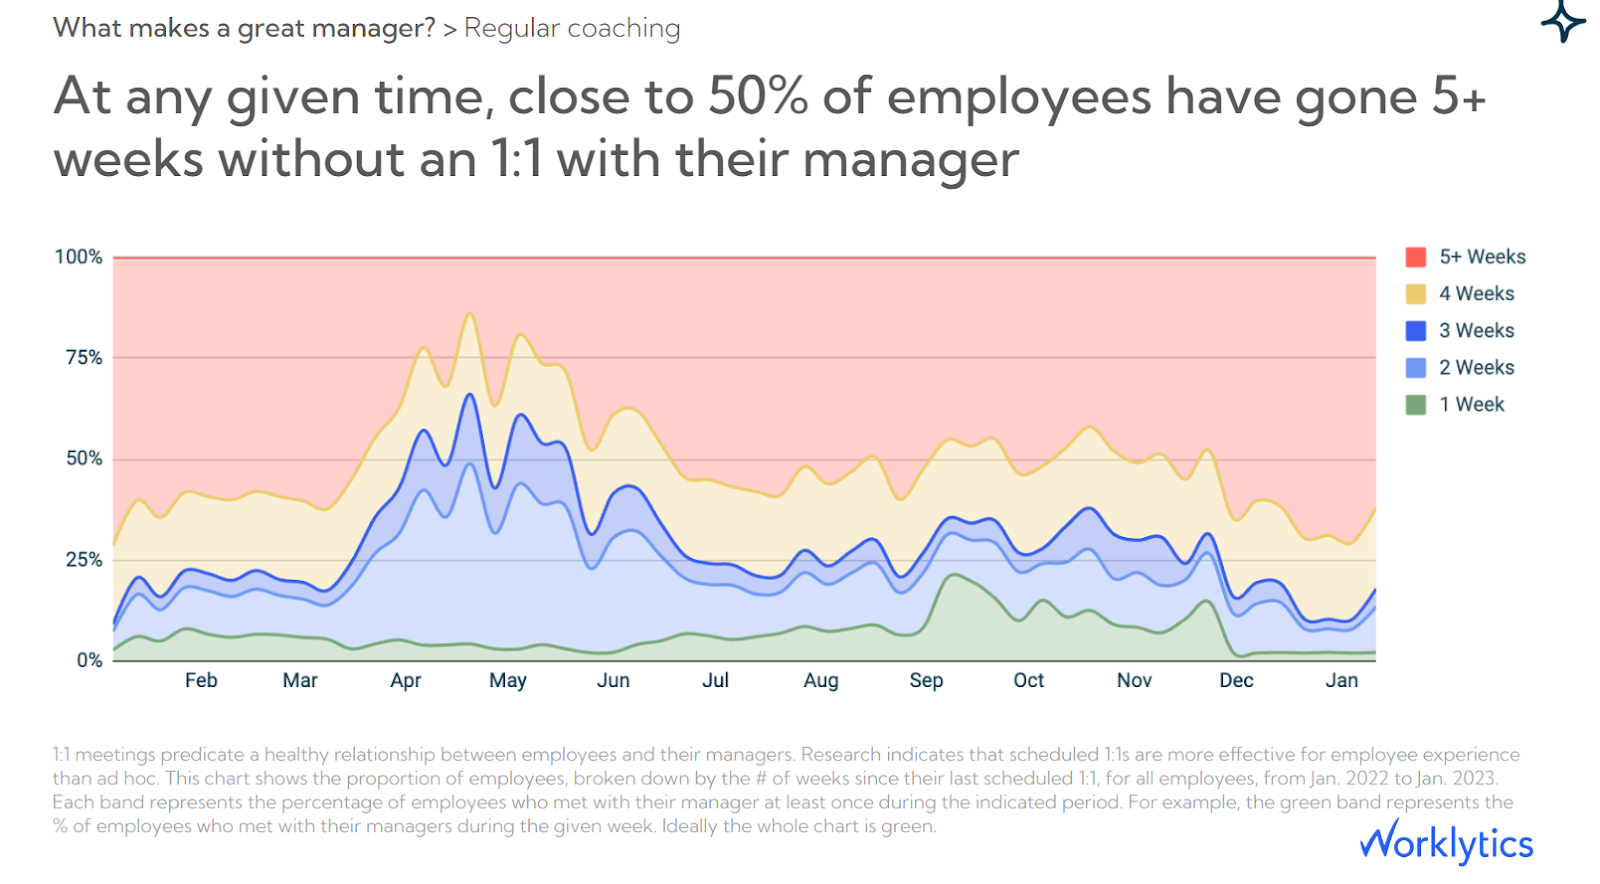
One of the most powerful and overlooked metrics is 1:1 meeting frequency. Regular one-on-one meetings between managers and their direct reports may not seem exciting, but they are critical for engagement and performance.
Research from Gallup found that employees whose managers hold regular 1:1s are almost three times more engaged than those whose managers do not. Yet, less than half of managers report holding dedicated one-on-one meetings consistently. Skipping these check-ins can make employees feel unsupported or disconnected. In fact, a lack of manager interaction is one of the strongest predictors of disengagement or intent to quit.
Tracking 1:1 frequency provides an early warning sign for potential issues before they show up in surveys or resignations.
A good benchmark is to track how many one-on-one meetings each manager has had with each direct report over the past two weeks and past four weeks. Missing an occasional meeting isn’t a problem, but if a manager hasn’t met with a team member in a month or more, that’s a red flag. It could point to disengagement on either side and signals a need for early intervention.
Consistency matters more than perfection. It’s not only about how often meetings happen but also how reliably they are held. Watch for cancellations and no-shows. When managers frequently cancel, reschedule, or show up late to 1:1s, they send an unintended message that “you’re not a priority.” This erodes trust, lowers engagement, and increases turnover risk.
From an HR perspective, a pattern of canceled or missed one-on-ones can be as revealing as a poor engagement score, but it can be spotted in real time rather than months later.
In practice, consider creating a dashboard for manager behavior metrics. If you notice a manager with no one-on-one meetings in the last month or a high cancellation rate, it’s a cue for coaching and support. Often, managers simply don’t realize how long it’s been since their last real check-in.
Encouraging managers to hold regular biweekly 1:1s and treat them as essential helps strengthen communication, catch issues early, and improve both team performance and retention.
With sales growth slowing in many organizations, People Analytics teams are increasingly being asked to help reignite revenue. This can be challenging because Sales Operations teams already own the CRM data, and sales leaders often have deep customer insights that HR may not.
Instead of trying to replace sales metrics, HR analysts can add value by examining how sales reps actually spend their working hours. Beyond tracking pipeline and win rates, there’s a powerful opportunity to analyze calendar and collaboration data to uncover inefficiencies.
A great starting point is a simple but revealing metric called Selling Time.
Selling Time = Total Workday Length – Time Spent in Internal Meetings
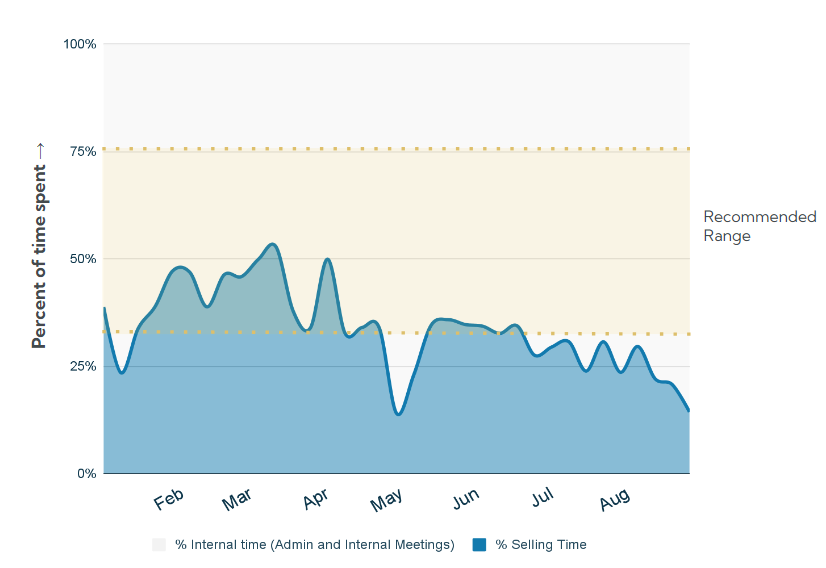
In other words, Selling Time represents the portion of a rep’s day available for direct customer-focused work, such as calls, emails, demos, and proposal writing. Every sales leader aims to maximize this time.
Yet, studies consistently show that salespeople spend surprisingly little of their workweek actually selling. One report found that only 28% of a sales rep’s time goes toward active selling, with the rest consumed by administrative tasks, data entry, and internal meetings. Similarly, Salesforce found that the average rep spends less than one-third of their time meeting with customers or prospects.
This imbalance presents a major opportunity for improvement.
By quantifying Selling Time, People Analytics teams can help sales leaders see where time is being lost. For example, you might find that Team X averages 12 hours of selling time per week, while Team Y averages 20 hours. The next step is to investigate why.
Perhaps Team X spends too much time in internal meetings or cross-functional calls. In many cases, analysis reveals that field sales reps spend less than 20% of their time with customers because their week is dominated by coordination and internal communication.
In one company, data showed that account managers spent only about one-third of their time with customers—and much of that was with low-priority accounts. Once leadership saw this, they reassigned resources and reduced low-value activities.
On the other hand, top-performing salespeople tend to maximize customer time. Research from Bain & Company found that high performers spend four more hours per week communicating with customers than average reps. They also use internal resources more efficiently, looping in specialists or support teams when needed instead of handling admin work themselves.
The takeaway is clear: telling reps to “sell more” isn’t enough. Organizations need to identify and remove internal time sinks that prevent reps from selling.
To drive meaningful change, start by benchmarking Selling Time across your sales teams. Then, break down where non-selling time goes. Look for patterns such as:
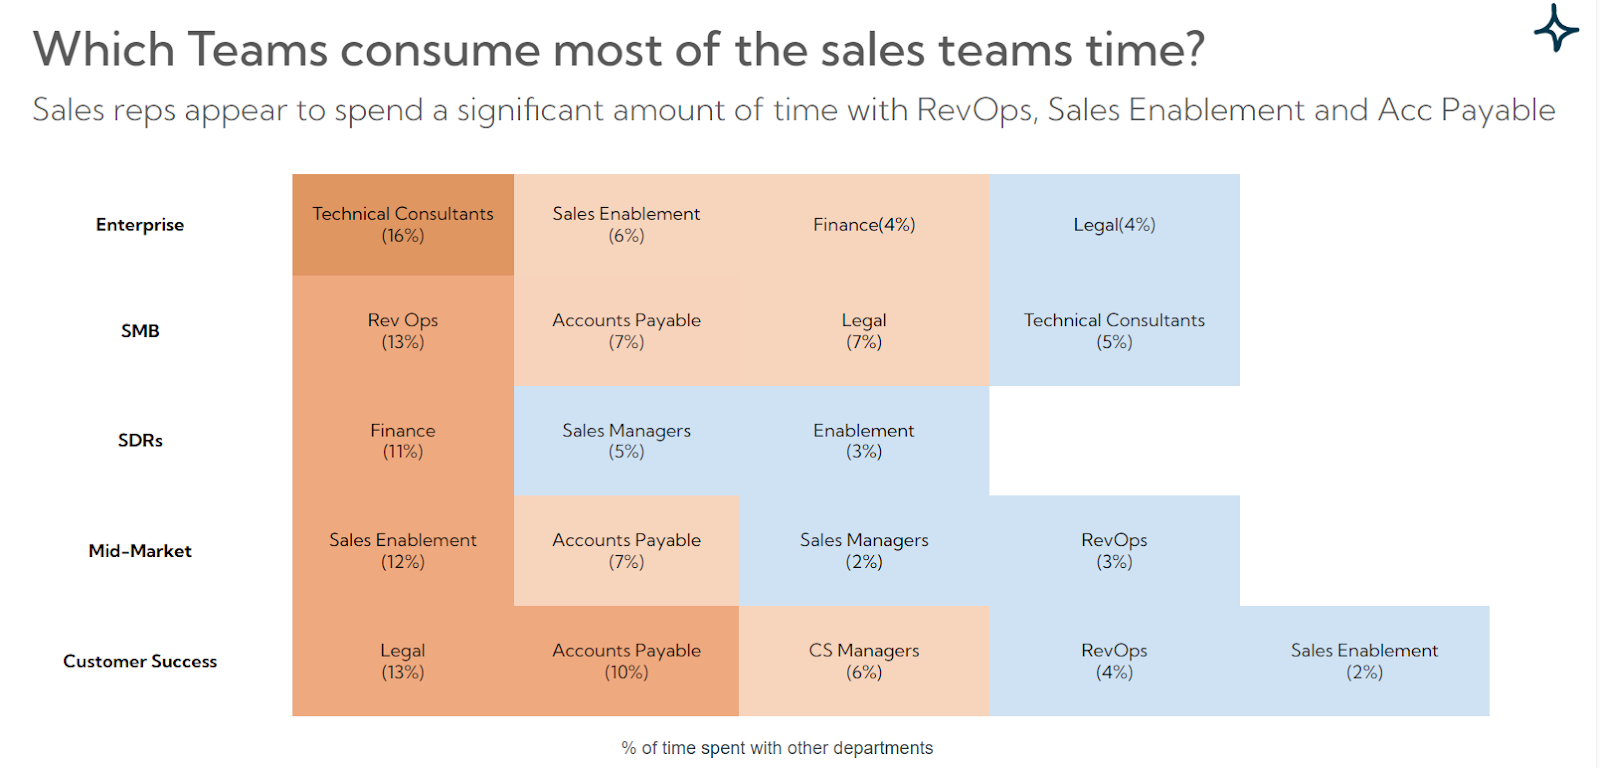
By highlighting which internal activities consume the most time, HR and People Analytics can spark data-driven conversations about streamlining workflows or reallocating responsibilities.
For instance, if you discover that a sales team spends 10 hours a week in recurring internal meetings, leadership might shorten or cancel some of them, or shift updates to asynchronous reports. If reps are spending hours entering CRM data, consider automation tools or support staff to lighten the load.
Every hour freed from busywork is an hour that can be spent on customers and deals. In a tough market, improving Sales Effectiveness often comes down to helping reps spend more time selling and less time on everything else.
Even small increases in Selling Time can lead to significant gains in revenue. By quantifying and visualizing these insights, People Analytics teams empower sales leaders to make smarter decisions and refocus their teams on what truly drives growth.
For more information on Worklytics metrics, check out our Data Dictionary


