

As organizations rapidly adopt AI tools like Microsoft Copilot, measuring their impact on productivity and ROI has become critical for data-driven decision making. With Microsoft's recent introduction of new 'agents usage' and prompt-category reports in preview as of July 2025, combined with Power Platform's Copilot hub cost widgets, data engineers now have unprecedented visibility into AI consumption patterns (SharePoint Nuts and Bolts). However, connecting these usage metrics to actual productivity gains requires sophisticated data integration and analysis.
This technical tutorial demonstrates how to build a comprehensive real-time dashboard that combines Microsoft 365's new AI usage reports with Worklytics' anonymized activity streams to calculate meaningful productivity ROI. GitHub Copilot has become a mission-critical tool in under two years with over 1.3 million developers on paid plans and over 50,000 organizations issuing licenses (Worklytics). By the end of this guide, you'll have a downloadable Power BI template and governance framework for role-based access to these critical metrics.
Microsoft has recently allowed agents to be used in the free version of Copilot (Microsoft 365 Copilot chat) by any employee with a Microsoft 365 license, with AI usage charged based on consumption in a Pay As You Go manner (SharePoint Nuts and Bolts). This new approach avoids the need to license the entire organization with Microsoft 365 Copilot, which costs around $30 per user per month.
Microsoft introduced AI functionality in many parts of their products and services in 2023, referring to these parts as 'copilots' (Power Wiki). These copilots are categorized into embedded copilots, copilots as add-ons, and build-your-own solutions, all using modern AI/Large Language Models (LLMs) like GPT-4 to assist people with complex cognitive tasks.
Microsoft's Power Platform has a feature called Copilot Studio that allows users to manage messages and capacity, with a dedicated Copilot page in the Power Platform admin center providing documents, insights, and controls related to Power Platform Copilots (Microsoft Learn). This centralized monitoring approach enables organizations to track consumption patterns and optimize their AI investments.
Worklytics provides data from more than 25 of the most common collaboration tools, using machine learning to clean, de-duplicate, and standardize datasets (Worklytics). This comprehensive approach enables organizations to correlate AI usage with actual work patterns and productivity outcomes.
Employees using Copilot saved an average of 3 hours per week, effectively reclaiming approximately 10% of their workweek (Worklytics). However, measuring this impact requires sophisticated analytics that go beyond simple usage metrics.
Worklytics can boost AI adoption in your organization by providing visibility into usage patterns and identifying areas for improvement (Worklytics). The platform tracks employee AI adoption through multiple dimensions, helping organizations understand which metrics matter most for driving successful implementation (Worklytics).
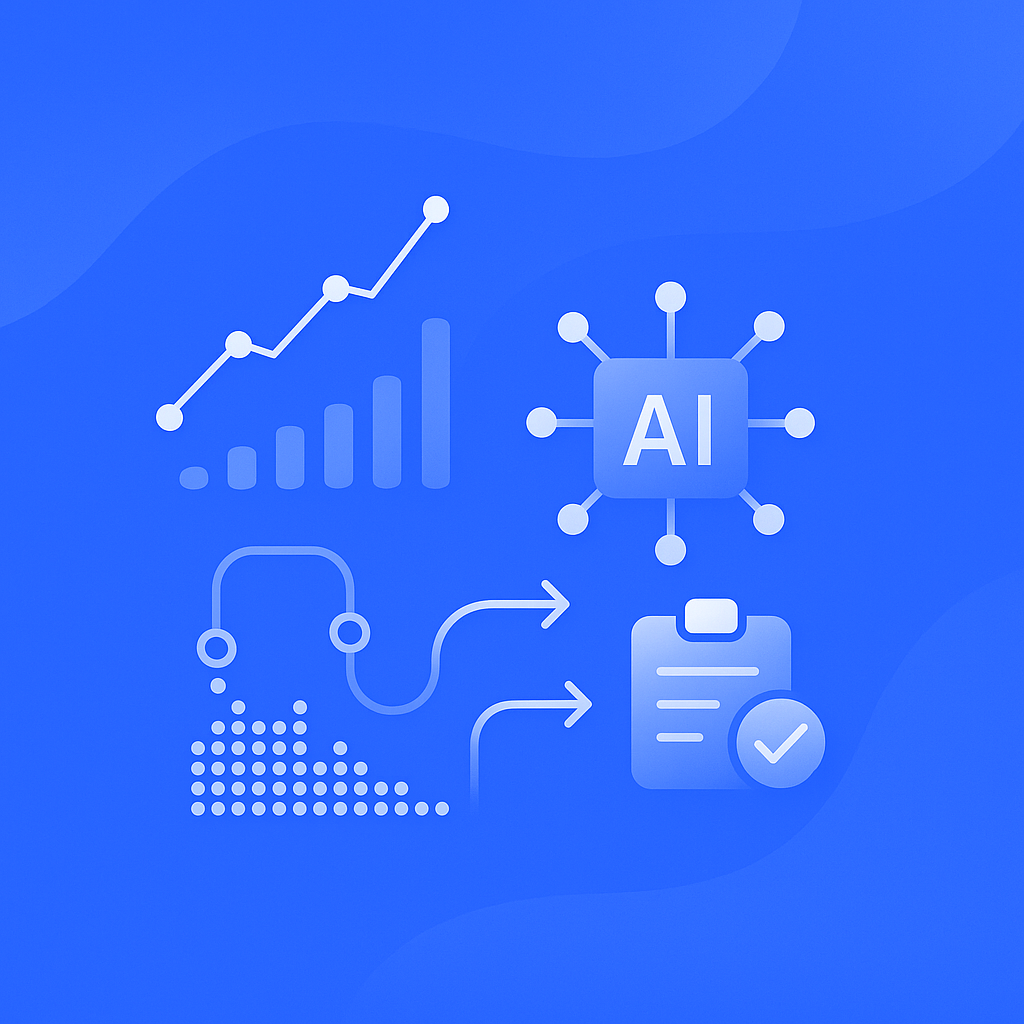
To build an effective real-time dashboard, you'll need to establish a robust data pipeline that can handle Microsoft Graph API events and stream them into your data warehouse. The architecture should support both real-time streaming and batch processing for historical analysis.
The Microsoft Graph API provides access to the new AI usage reports, including:
Your Snowflake schema should include tables for:
The key to meaningful ROI analysis is connecting time savings to financial impact. GitHub reports that Copilot can expedite coding tasks by up to 55%, and in GitHub's large-scale survey of over 2,000 developers, 88% of respondents felt more productive when using Copilot (Worklytics).
Here are essential DAX formulas for your dashboard:
Total Hours Saved:
Total Hours Saved =
SUMX(
    Users,
    [AI Usage Hours] * [Productivity Multiplier]
)
ROI Percentage:
ROI Percentage =
DIVIDE(
    [Total Value Generated] - [Total AI License Cost],
    [Total AI License Cost]
) * 100
Cost Per Hour Saved:
Cost Per Hour Saved =
DIVIDE(
    [Total AI License Cost],
    [Total Hours Saved]
)
Your dashboard should track multiple dimensions of AI adoption and productivity impact. Many organizations segment usage by team, department, or role to uncover adoption gaps and identify areas where additional support or training may be required (Worklytics).
| Metric Category | Key Indicators | Data Source |
|---|---|---|
| Usage Metrics | Active users, sessions per day, prompt categories | Microsoft Graph API |
| Productivity Impact | Hours saved, task completion rates, quality metrics | Worklytics activity streams |
| Financial ROI | License costs, value generated, cost per hour saved | Power Platform cost widgets |
| Adoption Trends | User growth, feature utilization, department penetration | Combined data sources |
Implement real-time updates using:
An AI-enhanced employee is someone who knows how to leverage AI to amplify their performance (Worklytics). Measuring this enhancement requires looking beyond simple usage statistics to understand actual productivity gains.
ROI for Copilot can be viewed in multiple dimensions: increased developer productivity (faster delivery of features, more output), higher code quality (fewer bugs or rework, smoother releases), and improved developer experience (leading to better retention and team morale) (Worklytics).
Worklytics has a pipeline that can connect to existing data warehouses or visualization tools (Worklytics), enabling sophisticated analysis that combines AI usage with broader workplace analytics. This integration allows for measuring employee performance in the age of AI across multiple dimensions (Worklytics).
Worklytics uses data anonymization and aggregation to ensure compliance with GDPR, CCPA, and other data protection standards. When building your AI usage dashboard, implement similar privacy protections:
| Role | Access Level | Available Metrics | Restrictions |
|---|---|---|---|
| Executive Leadership | Strategic Overview | Department-level ROI, adoption trends | No individual user data |
| IT Administrators | Technical Details | Usage patterns, cost allocation, system performance | Full technical access |
| Department Managers | Team Performance | Team-level productivity, adoption rates | Limited to managed teams |
| Individual Contributors | Personal Insights | Own usage patterns, productivity gains | Self-service only |
Data Collection:
Access Control:
Compliance:
Worklytics is exploring new ways to model work, focusing on Workday Intensity, Work-Life Balance, and Manager Effectiveness (Worklytics). Hybrid work has changed the shape of the workday, elongating the span of the day but also changing the intensity of work, with workday intensity measured as time spent on digital work as a percentage of the overall workday span.
The average executive spends 23 hours a week in meetings, nearly half of which could be cut without impacting productivity (Worklytics). Outlook calendar analytics pulls information from Outlook calendars and transforms it into insights about how work is actually happening, which can be correlated with AI usage patterns.
Implement predictive models to:
Ensure data accuracy through:
AI proficiency grows with practice, and many online platforms (Coursera, LinkedIn Learning, etc.) offer courses on AI fundamentals and using AI in business contexts (Worklytics). Your dashboard should support this learning journey by identifying skill gaps and tracking improvement over time.
The downloadable Power BI template includes:
While code blocks are not enabled for this post, the template package includes:
Over 50,000 organizations have already integrated GitHub Copilot into their development workflows (Worklytics), and measuring their success requires ongoing analysis and optimization. Your dashboard should evolve with your organization's AI maturity.
As AI adoption matures, shift focus from:
Worklytics enables organizations to measure, benchmark, and accelerate AI impact across their organization (Worklytics). Use industry benchmarks to contextualize your organization's AI adoption progress and identify areas for improvement.
Building a comprehensive AI usage dashboard that connects Copilot metrics to productivity ROI requires careful integration of multiple data sources, sophisticated analytics, and robust governance frameworks. By combining Microsoft's new AI usage reports with Worklytics' workplace intelligence platform, organizations can gain unprecedented visibility into their AI investments' true impact.
The technical approach outlined in this tutorial provides a foundation for real-time monitoring and analysis, while the governance framework ensures compliance and appropriate access controls. As AI proficiency is now a must-have skill in modern organizations (Worklytics), having the right measurement and monitoring infrastructure becomes critical for success.
Microsoft is weaving AI into its Office 365 products with Copilot, and over 50,000 businesses (including roughly one-third of Fortune 500 companies) have already integrated Copilot into their development workflows (Worklytics). Organizations that can effectively measure and optimize their AI investments will have a significant competitive advantage in the evolving digital workplace.
The downloadable Power BI template and governance checklist provide practical tools for immediate implementation, while the technical architecture supports long-term scalability and evolution. As your organization's AI maturity grows, this dashboard framework will adapt to provide increasingly sophisticated insights into the relationship between AI adoption and business outcomes.
Microsoft introduced new 'agents usage' and prompt-category reports in preview, along with Power Platform's Copilot hub cost widgets. These provide unprecedented visibility into AI consumption patterns, allowing organizations to track usage across different agent types and prompt categories for better cost management and ROI analysis.
Microsoft now allows agents to be used in the free version of Copilot (Microsoft 365 Copilot chat) by any employee with a Microsoft 365 license. AI usage is charged based on consumption in a pay-as-you-go manner, avoiding the need to license the entire organization with Microsoft 365 Copilot at $30 per user per month.
According to Worklytics research, organizations should track adoption rates, usage frequency by team and role, efficiency gains through productivity metrics, and downstream business outcomes. High adoption metrics are necessary but not sufficient - measuring actual productivity improvements and ROI requires connecting AI usage data with work output and collaboration patterns.
Worklytics provides data from over 25 collaboration tools and uses machine learning to clean and standardize datasets. By combining Worklytics' productivity analytics with Copilot usage metrics, organizations can measure work intensity, meeting efficiency, and collaboration patterns to quantify the actual productivity impact of AI adoption across teams.
A streaming architecture that ingests data from Microsoft's Copilot reporting APIs, Power Platform admin center, and productivity tools like Worklytics. This requires serverless compute capabilities, Unity Catalog enablement, and proper connection privileges for data ingestion pipelines that can handle real-time updates and complex DAX calculations for ROI metrics.
The governance framework should include data privacy controls, usage monitoring thresholds, cost management policies, and performance benchmarks. It should leverage Power Platform's admin center capabilities for capacity management while ensuring compliance with organizational policies around AI tool usage and data access permissions.


