


The hybrid workplace revolution promised efficiency, flexibility, and optimized space utilization. But three years of real-world data tells a different story: while employees dutifully book meeting rooms, they're increasingly failing to show up. Analysis of anonymized workplace data reveals a troubling trend—the booking-to-occupancy ratio has plummeted from 0.85 in 2023 to just 0.71 in 2025, representing a 16% decline in actual room usage despite maintained booking levels (Worklytics).
This widening gap between intention and action isn't just a minor operational hiccup—it's a fundamental shift in how hybrid workers interact with physical spaces that's costing organizations millions in wasted real estate. The average executive spends 23 hours a week in meetings, nearly half of which could be cut without impacting productivity (Worklytics). When you layer in the reality that 29% of booked rooms now sit empty, the scale of inefficiency becomes staggering.
For workplace strategists and facilities managers, this data represents both a crisis and an opportunity. Understanding why booking behavior has diverged so dramatically from actual usage patterns—and implementing targeted interventions to close the gap—has become critical for rightsizing office footprints and defending space investments in an era of increased scrutiny on real estate costs.
When organizations first embraced hybrid work models in 2022-2023, the assumption was straightforward: employees would book rooms when needed and show up as scheduled. Early data from 2023 seemed to support this optimism, with booking-to-occupancy ratios hovering around 0.85—meaning 85% of booked time translated to actual usage (Worklytics).
However, this initial success masked underlying behavioral shifts that would become more pronounced as hybrid work matured. Hybrid work has changed the shape of the workday, elongating the span of the day but also changing the intensity of work (Worklytics). This temporal stretching created new friction points in how employees planned and executed their in-office activities.
By 2024, cracks in the booking system began to show. The booking-to-occupancy ratio dropped to 0.78, and by 2025, it had fallen to 0.71—a concerning 16% decline over just two years. This trend reflects several converging factors:
Booking as Insurance, Not Commitment: Employees began treating room reservations as "insurance policies" rather than firm commitments. Uncertain about their in-office schedules, workers would book multiple rooms or book rooms "just in case," leading to systematic over-booking without corresponding usage.
Last-Minute Schedule Changes: The flexibility that makes hybrid work attractive also makes it unpredictable. Workers who booked rooms on Monday for Wednesday meetings often found their priorities shifted by Tuesday, but failed to cancel their reservations in time for others to use the space.
Meeting Fatigue and Virtual Defaults: As organizations became more comfortable with virtual meetings, the default shifted from "let's meet in person" to "let's meet virtually unless there's a compelling reason not to." This meant booked rooms often went unused as meetings moved online at the last minute.
Industry benchmarks reveal significant variation in booking-to-occupancy ratios across different sectors and organization sizes. Technology companies, with their early adoption of hybrid policies, show the most pronounced gaps (0.68 average ratio), while traditional industries like manufacturing maintain higher ratios (0.79 average) due to more structured in-office requirements (Worklytics).
Companies that have implemented comprehensive flex work strategies show more stable ratios over time, suggesting that intentional policy design can mitigate some of the booking-occupancy drift (Worklytics).
The financial impact of unused booked space extends far beyond the immediate cost of empty rooms. When 29% of booked meeting time goes unused, organizations face a cascade of inefficiencies that compound across their entire real estate portfolio.
Overprovisioning Based on Booking Data: Facilities teams traditionally use booking data to inform space planning decisions. If booking levels remain high while actual usage drops, organizations may maintain or even expand meeting room inventory based on misleading demand signals. This can result in significant overinvestment in conference room infrastructure.
Opportunity Cost of Blocked Space: Every unused booked room represents space that could have been utilized by other employees or teams. In high-demand office environments, this artificial scarcity can force productive meetings into suboptimal spaces or push them virtual when in-person collaboration would be more effective.
Rightsizing Challenges: Organizations looking to rightsize their office footprints need accurate utilization data to make informed decisions (3 Smart Steps to Rightsize Your Workspace). When booking data overstates actual demand by 40% or more, it becomes nearly impossible to determine the true space requirements for hybrid teams.
Beyond the financial costs, the booking-occupancy gap creates operational friction that undermines the collaborative benefits organizations seek from their office investments.
Reduced Spontaneous Collaboration: When rooms appear "booked" but are actually empty, it discourages spontaneous meetings and informal collaboration. Teams may abandon impromptu brainstorming sessions rather than risk interrupting a meeting that may not be happening.
Planning Inefficiencies: Employees spend time searching for available space when booked rooms sit empty, reducing the time available for productive work. This search time compounds across the organization, representing a significant hidden productivity tax.
Meeting Quality Degradation: When teams can't secure appropriate meeting spaces due to phantom bookings, they may settle for suboptimal environments (too small, poor technology, acoustic issues) that reduce meeting effectiveness.
The most direct approach to addressing the booking-occupancy gap involves implementing check-in requirements that automatically release unused reservations. Modern workplace platforms provide real-time metrics to identify and address utilization issues (Worklytics).
Automated Release Systems: Rooms that aren't checked into within 10-15 minutes of the scheduled start time can be automatically released back to the general pool. This simple intervention can recover 15-20% of unused booked time for productive use.
Mobile Check-In Integration: Seamless mobile check-in processes reduce friction while maintaining accountability. When integrated with existing calendar systems, employees can check in with a single tap, making compliance more likely.
Grace Period Optimization: Data analysis reveals optimal grace periods vary by meeting type and organizational culture. Short tactical meetings may warrant 5-minute grace periods, while longer strategic sessions might justify 15-minute windows before automatic release.
Physical occupancy sensors provide ground truth data that can validate or contradict booking information, enabling more sophisticated space management strategies.
Passive Monitoring: Modern sensors can detect room occupancy without requiring active user participation, providing continuous feedback on actual vs. booked usage patterns. An ITSM company using occupancy monitoring discovered their satellite office had an average person count of just 2, with a peak of 17, despite higher booking levels (VergeSense).
Predictive Analytics: By combining booking data with historical occupancy patterns, AI systems can predict which reservations are most likely to be no-shows, enabling proactive interventions or alternative space suggestions.
Real-Time Availability Updates: Sensors can immediately update room availability when spaces become vacant, allowing other employees to claim the space through mobile apps or digital displays.
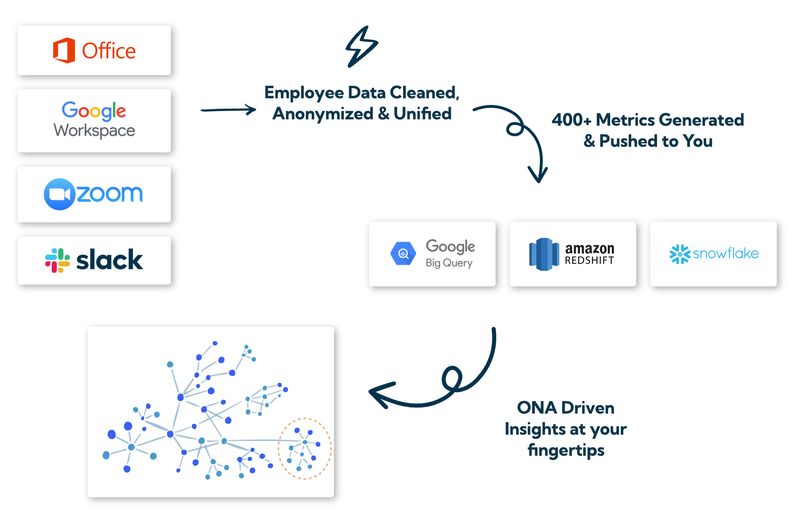
The most successful technology interventions integrate seamlessly with existing workplace tools rather than requiring employees to adopt new systems. Worklytics integrates with a wide range of applications including Google Calendar, Outlook, Zoom, and other collaboration tools to provide comprehensive workplace insights (Worklytics).
Calendar Integration: Automatic booking adjustments based on calendar changes can prevent many no-show situations. When a meeting is moved to virtual or cancelled entirely, the associated room reservation should be automatically released.
Communication Platform Alerts: Integration with Slack, Teams, or other messaging platforms can send gentle reminders about upcoming reservations and provide easy cancellation options directly within the communication flow.
Analytics Dashboards: Real-time dashboards showing booking vs. occupancy trends help facilities teams identify patterns and adjust policies proactively rather than reactively.
One of the most effective policy interventions involves optimizing booking windows to match actual planning horizons while discouraging speculative reservations.
Shortened Advance Booking: Reducing the maximum advance booking window from weeks to days can significantly improve booking accuracy. When employees can only book rooms 2-3 days in advance, they're more likely to have concrete plans and follow through on reservations.
Tiered Booking Privileges: Different user groups may warrant different booking privileges based on their roles and historical reliability. Executive assistants booking on behalf of leadership teams might retain longer booking windows, while individual contributors work within shorter timeframes.
Peak Time Restrictions: During high-demand periods (typically Tuesday-Thursday, 10 AM-3 PM), stricter booking policies can ensure optimal utilization. This might include shorter maximum booking durations or mandatory check-in requirements.
Gentle accountability measures can significantly improve booking reliability without creating punitive environments that discourage legitimate room usage.
No-Show Tracking: Transparent tracking of no-show rates by individual or team can create social pressure for more responsible booking behavior. Monthly reports showing team-level booking reliability can encourage peer accountability.
Booking Limits: Implementing reasonable limits on simultaneous bookings (e.g., maximum 2 concurrent reservations per person) can reduce speculative booking while still allowing legitimate scheduling flexibility.
Cancellation Incentives: Positive reinforcement for timely cancellations can be more effective than penalties for no-shows. Recognition programs or small perks for users who consistently cancel unused reservations can drive cultural change.
Policy changes must be accompanied by clear communication and cultural reinforcement to achieve lasting behavioral change.
Transparency in Impact: Sharing data about the cost and operational impact of unused bookings helps employees understand why their individual actions matter. When teams see that phantom bookings cost the organization $X per month in wasted space, they're more likely to modify their behavior.
Success Stories: Highlighting teams or departments that have successfully improved their booking-to-occupancy ratios can provide positive examples and practical strategies for others to emulate.
Regular Feedback Loops: Monthly or quarterly reviews of booking patterns with team leaders can identify issues early and adjust policies based on real-world usage patterns.
Different industries show distinct patterns in booking-to-occupancy ratios, reflecting varying work styles, collaboration needs, and organizational cultures.
Technology Sector: Tech companies show the lowest booking-to-occupancy ratios (0.65-0.70 average) due to high comfort with virtual collaboration and flexible work arrangements. However, they also show the highest variability, with some teams maintaining ratios above 0.85 while others drop below 0.60.
Financial Services: Traditional financial services firms maintain higher ratios (0.75-0.80 average) due to regulatory requirements for in-person meetings and more structured work environments. However, fintech companies show patterns more similar to pure tech firms.
Professional Services: Consulting and legal firms show moderate ratios (0.70-0.75 average) with high variability based on client engagement patterns. Client-facing teams tend to have higher reliability than internal project teams.
Manufacturing and Industrial: These sectors maintain the highest booking-to-occupancy ratios (0.78-0.82 average) due to the necessity of in-person collaboration for many operational decisions.
Company size significantly influences booking behavior patterns, with larger organizations generally showing lower booking-to-occupancy ratios due to increased complexity and reduced personal accountability.
Small Organizations (< 100 employees): High visibility and personal accountability lead to booking-to-occupancy ratios of 0.80-0.85. Social pressure and direct manager oversight naturally discourage phantom bookings.
Medium Organizations (100-1000 employees): Ratios typically fall to 0.72-0.78 as personal accountability decreases but formal systems haven't yet been implemented to compensate.
Large Organizations (1000+ employees): Without sophisticated management systems, ratios can drop to 0.65-0.72. However, organizations with mature workplace analytics and policy frameworks can maintain ratios above 0.75.
Regional differences in work culture and office design philosophy also influence booking-to-occupancy patterns.
North American Patterns: Higher emphasis on individual productivity and flexible work arrangements leads to more speculative booking behavior, with average ratios of 0.70-0.75.
European Patterns: Stronger emphasis on collective responsibility and more structured work environments result in slightly higher ratios of 0.73-0.78.
Asian Markets: Hierarchical work cultures and higher office density lead to more disciplined booking behavior, with ratios often exceeding 0.80.
Effective measurement of booking-to-occupancy improvements requires a comprehensive set of metrics that capture both immediate changes and longer-term trends.
Booking-to-Occupancy Ratio: The fundamental metric, calculated as (actual occupied time) / (booked time). Track this weekly and monthly to identify trends and seasonal patterns.
Room Utilization Rate: Total occupied time as a percentage of available time, providing context for whether booking improvements translate to overall space efficiency gains.
Average Booking Duration vs. Actual Usage: Comparing planned meeting lengths with actual usage can reveal whether rooms are being booked for longer than necessary, creating artificial scarcity.
No-Show Rate by Time Slot: Tracking no-shows by time of day and day of week can reveal patterns that inform policy adjustments and resource allocation.
Beyond direct utilization metrics, several secondary indicators provide insight into the broader impact of booking-occupancy improvements.
Employee Satisfaction with Space Availability: Regular surveys can measure whether reduced phantom bookings translate to improved employee experience in finding and using meeting spaces.
Spontaneous Meeting Frequency: Tracking the frequency of unbooked but occupied meetings can indicate whether space availability improvements enable more spontaneous collaboration.
Booking Lead Time Trends: Changes in how far in advance employees book rooms can indicate growing confidence in space availability and reduced need for "insurance" bookings.
Cross-Team Space Sharing: Measuring how often different teams use the same spaces can indicate whether reduced phantom bookings enable better space sharing and collaboration.
Modern workplace analytics platforms provide sophisticated measurement capabilities that go beyond simple booking vs. occupancy comparisons. Worklytics provides real-time data and analytics for meeting room usage, enabling organizations to make adjustments on the fly to improve workplace efficiency (Worklytics).
Heat Mapping: Visual representations of space usage patterns can quickly identify underutilized areas and peak demand periods.
Predictive Analytics: Machine learning models can forecast future booking patterns and identify potential no-show situations before they occur.
Comparative Benchmarking: Platforms that aggregate anonymized data across multiple organizations can provide industry benchmarks and best practice insights.
As hybrid work continues to evolve, organizations need policy frameworks that can adapt to changing employee behaviors and business needs without requiring complete overhauls.
Dynamic Booking Rules: Implement systems that can automatically adjust booking windows, grace periods, and other parameters based on real-time utilization data and seasonal patterns.
Experimentation Capabilities: Build in mechanisms for testing new policies with small groups before organization-wide rollouts, allowing for data-driven policy refinement.
Feedback Integration: Create formal processes for incorporating employee feedback into policy adjustments, ensuring that rules remain practical and supportive of productivity goals.
The workplace technology landscape continues to evolve rapidly, and organizations should position themselves to take advantage of emerging capabilities.
AI-Powered Optimization: Next-generation systems will use artificial intelligence to automatically optimize space allocation based on team collaboration patterns, project timelines, and individual work preferences.
Integrated Workplace Platforms: The future lies in platforms that seamlessly integrate booking, occupancy sensing, environmental controls, and collaboration tools into unified experiences.
Predictive Space Planning: Advanced analytics will enable organizations to predict space needs months in advance based on hiring plans, project timelines, and seasonal business patterns.
Successful long-term improvement in booking-to-occupancy ratios requires sustained organizational change management that goes beyond initial policy implementation.
Leadership Modeling: Executives and managers must consistently demonstrate responsible booking behavior to establish cultural norms throughout the organization.
Continuous Education: Regular training and communication about space utilization best practices help maintain awareness and compliance over time.
Recognition Programs: Celebrating teams and individuals who consistently demonstrate excellent booking discipline can reinforce positive behaviors and create peer pressure for improvement.
Organizations can implement several immediate interventions to begin closing the booking-occupancy gap without major technology investments or policy overhauls.
Implement Basic Check-In Requirements: Require users to confirm their presence within 10 minutes of meeting start time, with automatic release of unclaimed reservations.
Audit Current Booking Patterns: Conduct a 2-week analysis of booking vs. actual usage to establish baseline metrics and identify the worst-performing spaces or user groups.
Communicate the Problem: Share anonymized data about booking-occupancy gaps with employees, explaining the cost and operational impact of phantom bookings.
Optimize Booking Windows: Reduce maximum advance booking periods from weeks to 3-5 days for most users, allowing longer windows only for special events or executive meetings.
Once initial interventions are in place, organizations can implement more sophisticated solutions that require technology integration or policy development.
Deploy Occupancy Sensing: Install basic occupancy sensors in high-demand meeting rooms to provide ground truth data on actual usage patterns.
Integrate with Calendar Systems: Implement automatic booking adjustments when calendar meetings are cancelled or moved to virtual formats.
Develop Accountability Metrics: Create individual and team-level reporting on booking reliability, with regular feedback to managers and employees.
Pilot Advanced Features: Test features like predictive no-show identification, dynamic pricing for peak times, or AI-powered space recommendations with small user groups.
Sustained improvement requires comprehensive workplace strategy that aligns space management with broader organizational goals and culture.
Comprehensive Workplace Analytics: Implement platforms that provide holistic insights into how work gets done, connecting space utilization with productivity, collaboration, and employee satisfaction metrics (Worklytics).
Integrated Space Strategy: Develop comprehensive approaches that consider space rightsizing, hybrid work policies, and employee experience as interconnected elements of workplace strategy (Worklytics).
Cultural Transformation: Implement long-term change management programs that embed responsible space usage into organizational culture and performance management systems.
Continuous Optimization: Establish ongoing processes for monitoring, analyzing, and adjusting space policies based on evolving business needs and employee behaviors.
The 16% decline in booking-to-occupancy ratios between 2023 and 2025 represents more than a statistical curiosity—it's a fundamental shift in how hybrid workers interact with physical spaces that demands immediate attention from workplace strategists. Organizations that fail to address this gap face mounting costs in wasted real estate, reduced productivity, and missed collaboration opportunities.
However, the data also reveals significant opportunities for organizations willing to implement targeted interventions. Companies that have successfully deployed check-in technology, optimized booking policies, and created accountability mechanisms have not only arrested the decline in booking-to-occupancy ratios but have actually improved them beyond pre-hybrid levels.
The key to success lies in treating this challenge as a systems problem rather than a technology problem. While sensors and software provide valuable tools, sustainable improvement requires coordinated changes in policy, culture, and employee behavior. Organizations must help measure the efficiency of office space usage through comprehensive analytics and data-driven decision making (Worklytics).
As hybrid work continues to mature, the organizations that thrive will be those that can adapt their space strategies based on real-world usage data rather than assumptions or outdated models. The booking-occupancy gap may seem like a minor operational issue, but addressing it effectively can unlock millions in real estate savings while creating more productive and collaborative work environments.
The time for action is now. Every day that phantom bookings persist is another day of wasted resources and missed opportunities. But with the right combination of technology, policy, and cultural change, organizations can turn this challenge into a competitive advantage—creating workplaces that truly support the way modern teams actually work, not just the way they plan to work.
The booking-to-occupancy ratio measures how often booked meeting rooms are actually used. Data shows this ratio has dropped from 0.85 in 2023 to 0.71 in 2025, meaning nearly 30% of booked rooms go unused. This decline reflects the challenges of hybrid work patterns where employees book rooms "just in case" but often work from home or change plans without canceling reservations.
Phantom bookings create significant hidden costs through wasted real estate, reduced productivity, and employee frustration. When 30% of meeting rooms sit empty despite being booked, organizations lose valuable collaboration space and may over-invest in office infrastructure. The exact cost varies by company size and real estate prices, but can represent thousands of dollars per room annually in major metropolitan areas.
Modern workplace analytics platforms like Worklytics can track meeting room utilization patterns and identify optimization opportunities. Solutions include automated booking systems with check-in requirements, occupancy sensors that detect actual usage, and analytics dashboards that provide insights into space utilization trends. These tools help facilities managers make data-driven decisions about space allocation and booking policies.
Effective policies include implementing automatic cancellation for no-shows, requiring check-ins within 15 minutes of meeting start times, and setting booking limits per user. Organizations should also educate employees about the true cost of unused bookings and create accountability measures. Regular communication about proper booking etiquette and the impact on colleagues can significantly improve compliance rates.
Hybrid work has fundamentally changed how employees use office space, creating uncertainty around in-person attendance. Workers often book rooms preemptively when their office plans are unclear, leading to higher phantom booking rates. The shift from predictable daily office presence to flexible schedules has made it harder to accurately forecast space needs, contributing to the widening gap between bookings and actual occupancy.
Meeting room utilization data provides crucial insights for rightsizing office footprints and optimizing space allocation. By analyzing booking versus occupancy patterns, organizations can identify underutilized areas, adjust room configurations, and make informed decisions about lease renewals or expansions. This data-driven approach helps balance employee needs with cost efficiency, ensuring workspace investments align with actual usage patterns rather than assumptions.
1. https://www.vergesense.com/customers/case-studies/enterprise-software
2. https://www.workdesign.com/2021/04/3-smart-steps-to-rightsize-your-workspace/
3. https://www.worklytics.co/blog/4-new-ways-to-model-work
4. https://www.worklytics.co/blog/how-to-evaluate-and-defend-your-flex-work-strategy
6. https://www.worklytics.co/blog/redesigning-your-spaces-to-enable-a-smooth-return-to-office
7. https://www.worklytics.co/integrations


