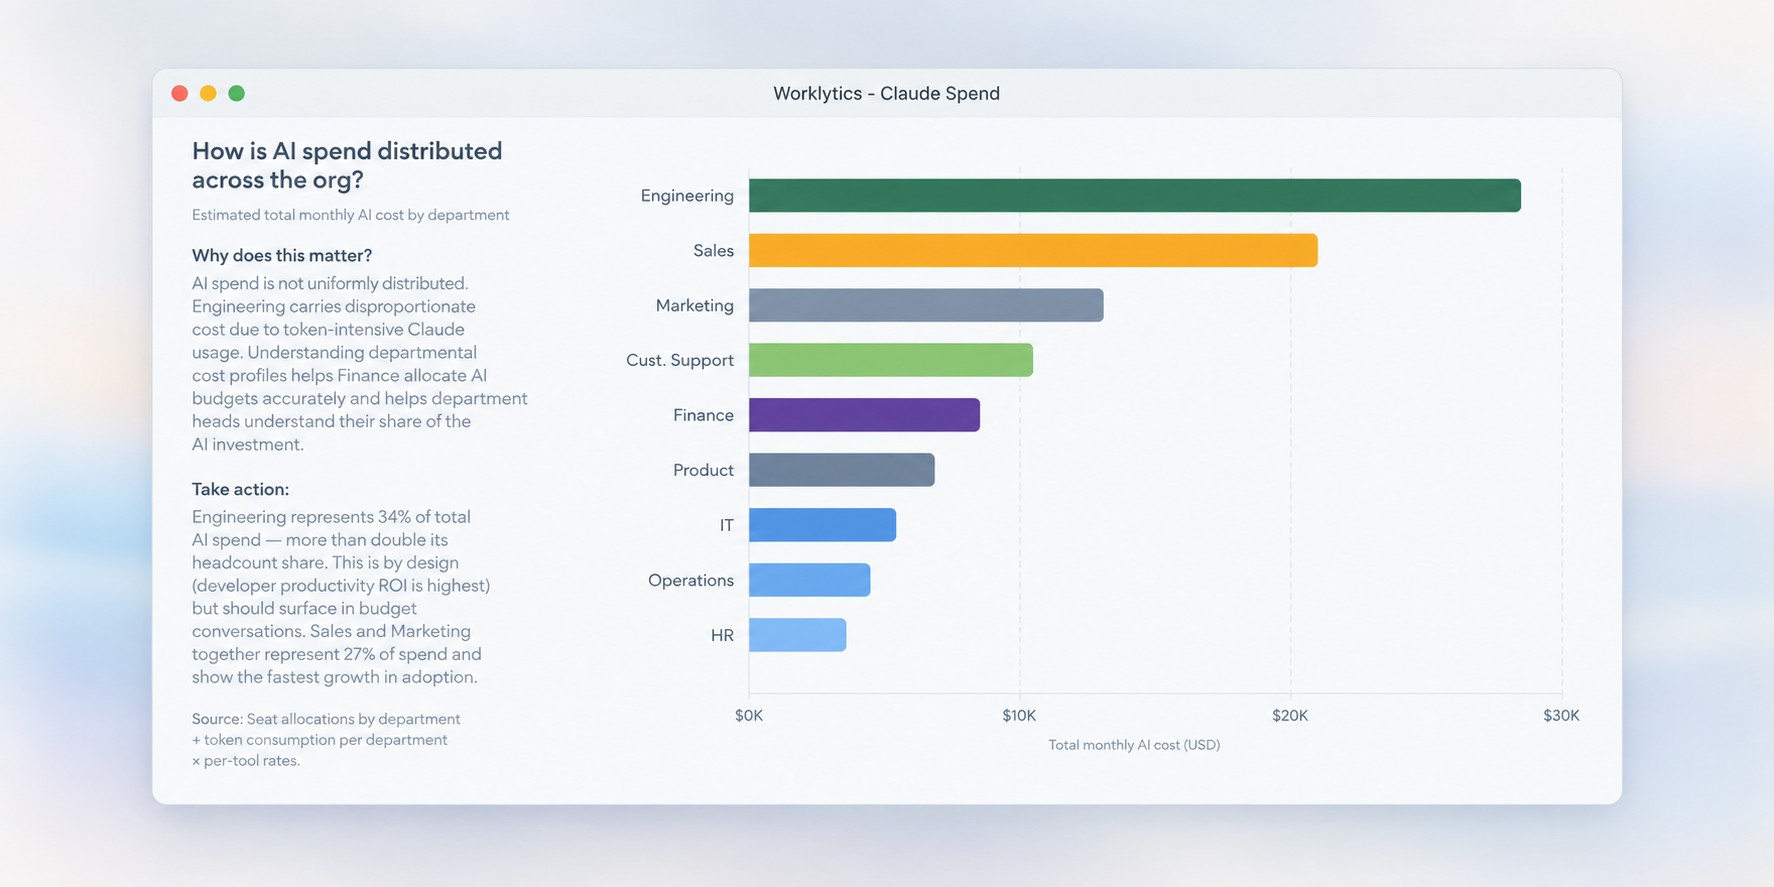
A Codex license is easy to read on a finance report. Value is not. Procurement sees seats and monthly spend, while the thing leadership actually asked about, how many hours the tool gave back, sits nowhere on the invoice. That gap is why most teams cannot answer "what did Codex save us" with anything firmer than a shrug or a hopeful percentage.
The fix is a repeatable measurement built from work data instead of surveys. Below is the exact process, a worked formula with real numbers, and the same model applied to AI sales team effectiveness so engineering and revenue sit on one scale.
Skip the two shortcuts that feel easy and mislead. Asking developers overstates the gain, since self-estimates run 30% to 50% while blind studies of the same work land near 10% to 15%, because people recall the function Codex wrote and forget the cleanup after. Counting raw activity like lines or commits overstates it too, because generative tools inflate those counts by design. A defensible number comes from watching behavior from prompt to merge, which is also why the SPACE framework for developer productivity warns that any single metric distorts the picture. Here is the five-step process Worklytics uses to turn Codex activity into a figure a CFO will accept.
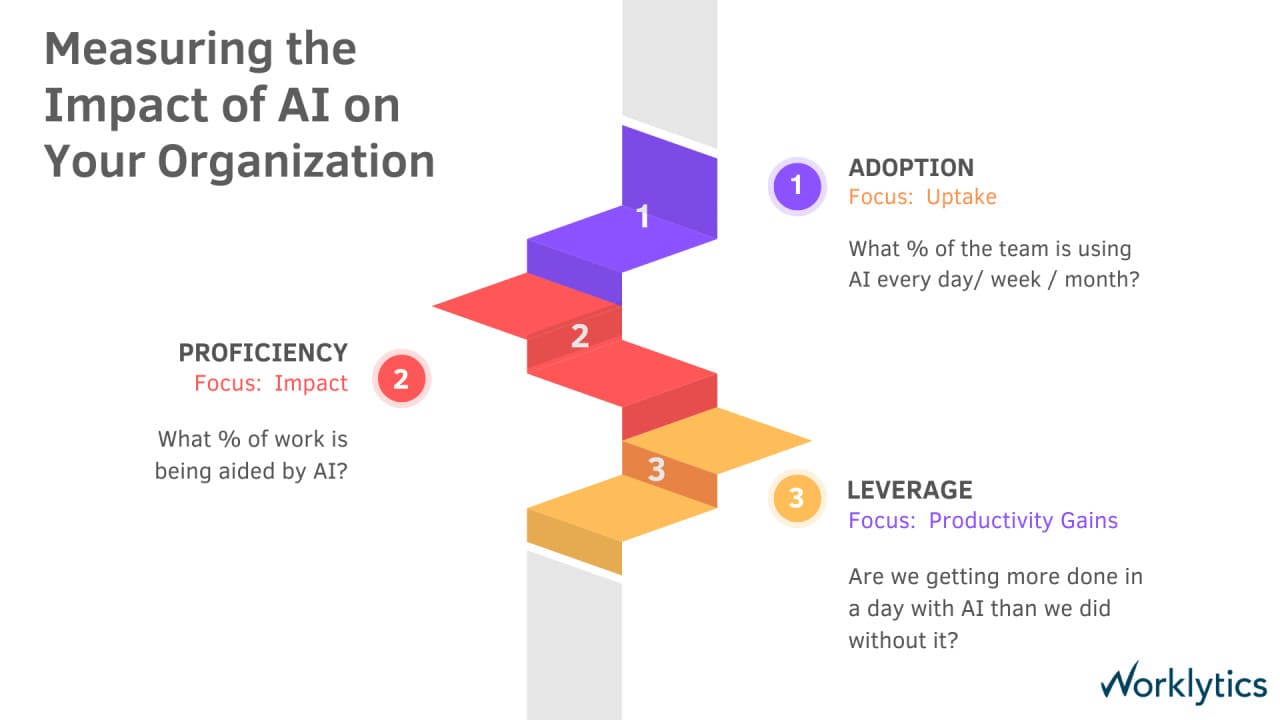
The steps compound, which is why order matters. A dollar figure built on step three alone hides whether the saving came from ten power users or the whole team, and a figure that skips step five reports hours the organization never actually kept. Run all five and the number tells you what to do next, whether that is buying more seats, retraining the seats you have, or moving budget elsewhere.
Written out, the calculation is plain: net time saved equals time removed per task, times how often the task happens, times how many people actually use the tool, minus rework, then priced at a loaded hourly rate. Worklytics runs this continuously, which is how a raw activity stream becomes an hours-and-dollars estimate that tracks against your existing productivity data rather than a one-off survey.
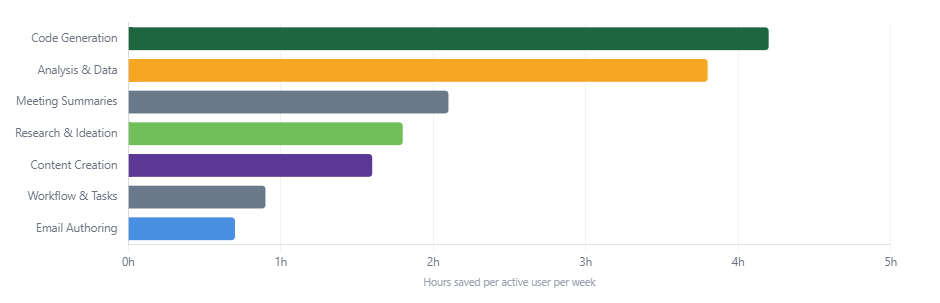
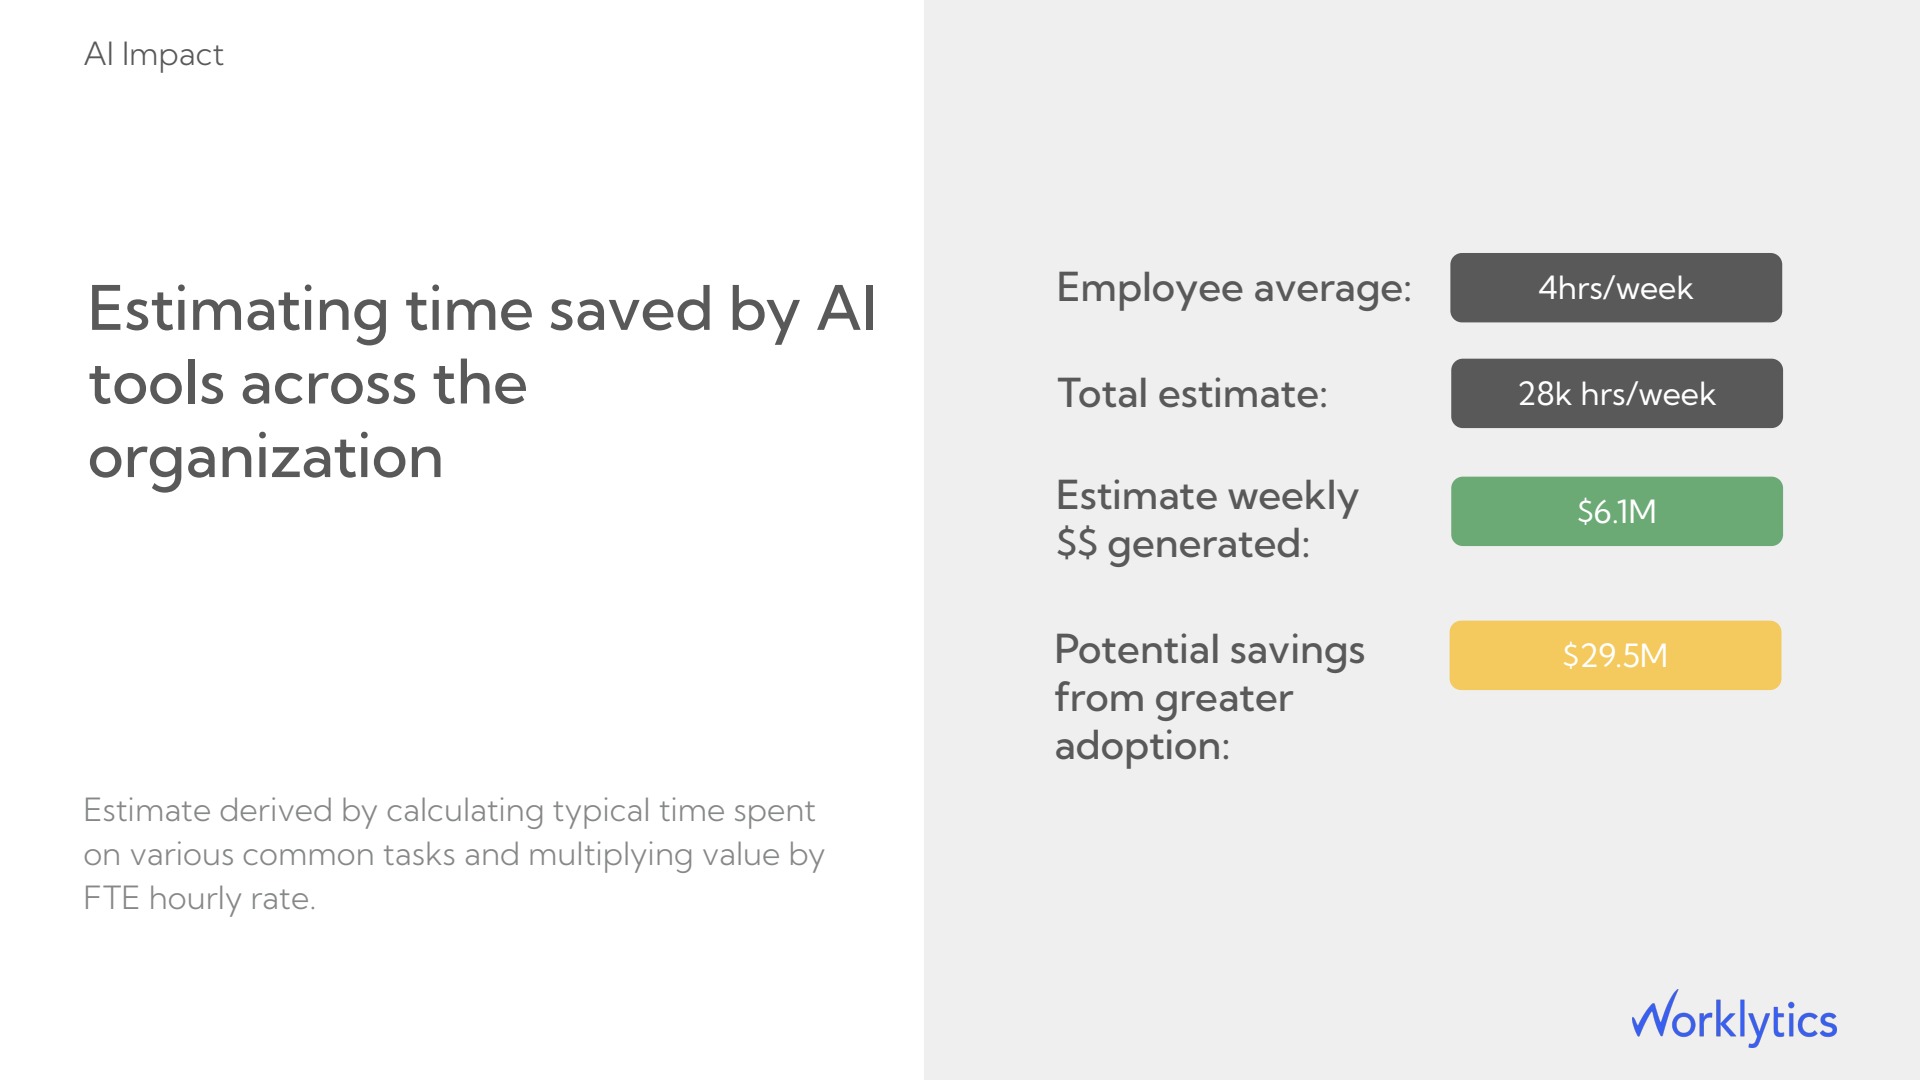
Put real numbers through it. Code generation, the category Codex lives in, returns about 4.2 hours per active user each week in Worklytics data, more than any other task type. Scale that across a workforce and a typical enterprise saves near 4 hours per employee per week, close to 28,000 hours per week, worth roughly $6.1M in weekly value. The figure worth staring at is the one still unclaimed: about $29.5M in annual value that appears only if adoption reaches the employees not yet using AI. The math keeps pointing at the same lever, that widening adoption returns more than swapping tools.
Step one decides whether the rest of the math is real. A tool that is 90% activated but only 14% weekly-active is shelfware you are paying full price for, so the estimate has to weight for genuine weekly use. The Worklytics AI adoption dashboards read this across every assistant in one place, so Codex sits next to Copilot, Claude, Gemini, and Slack agents rather than in a vendor silo, which is where consolidation calls actually get made.
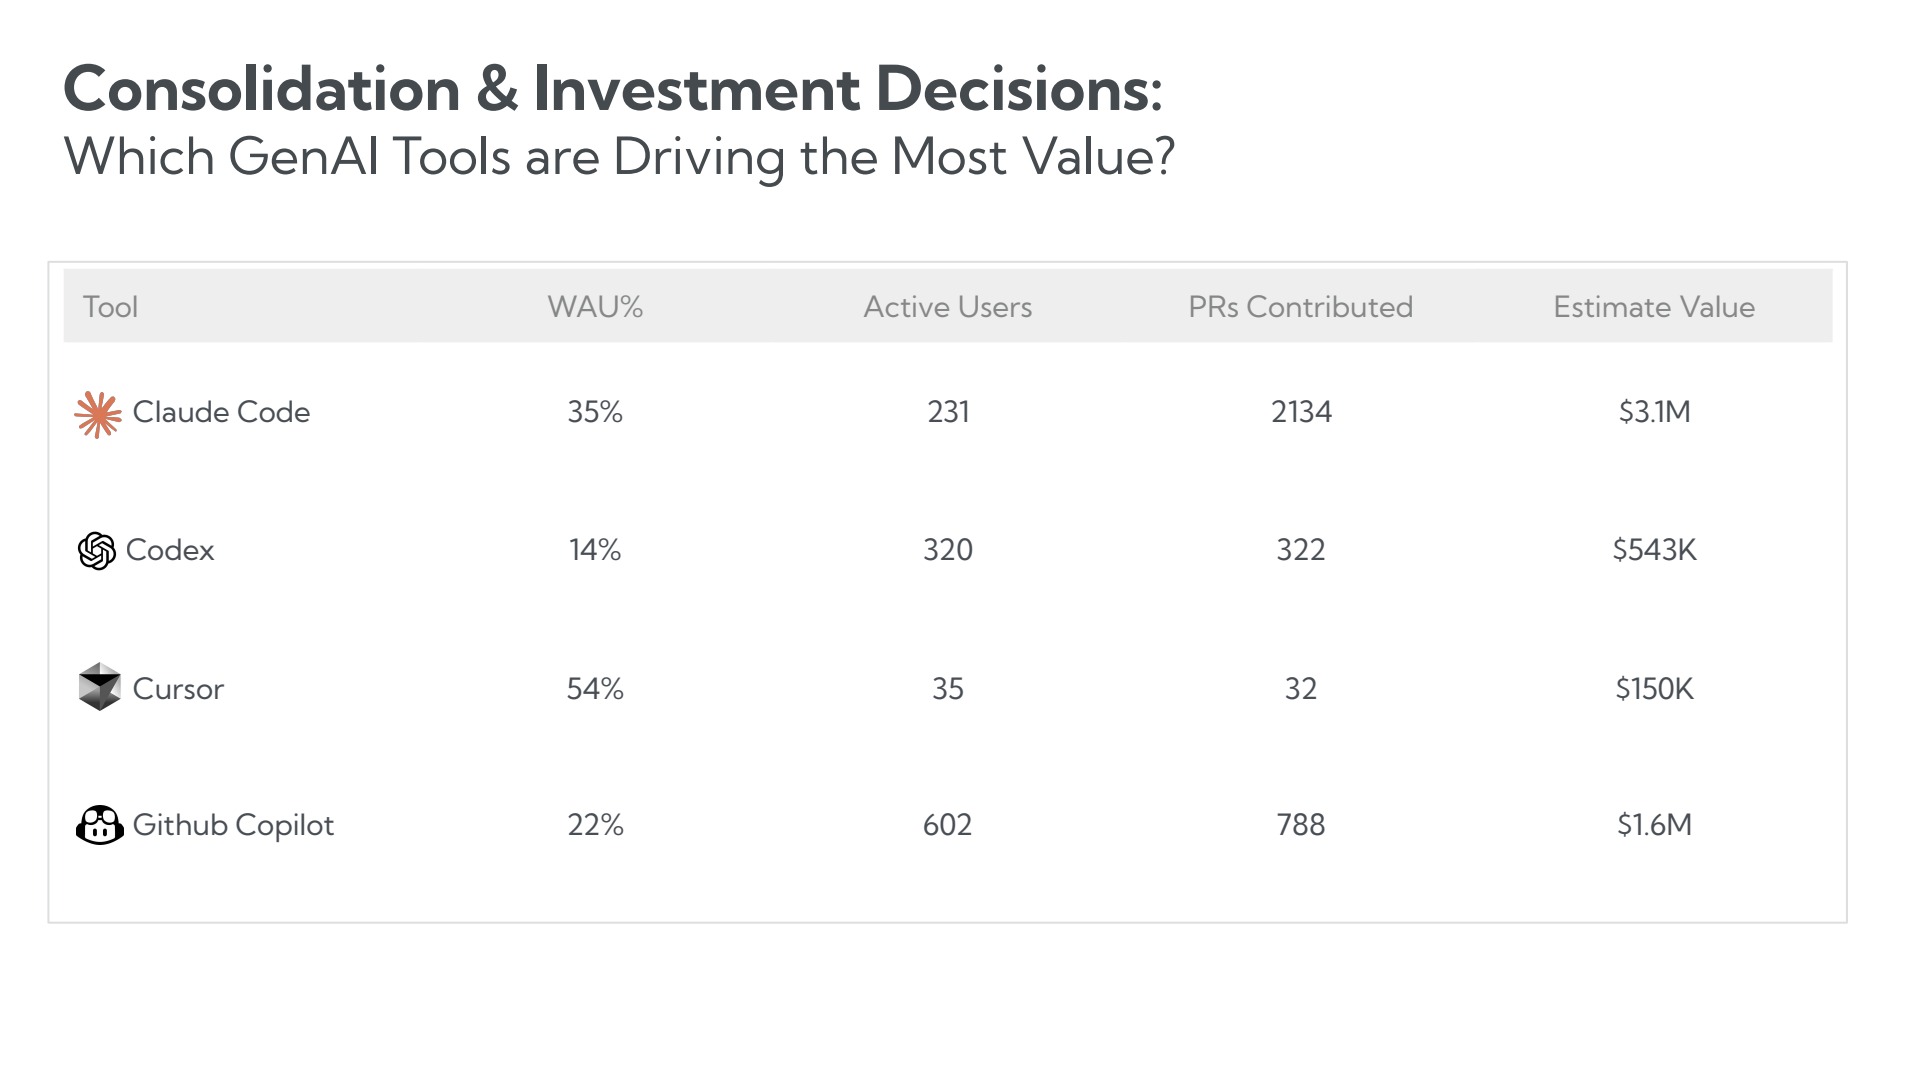
The comparison shows why seat count lies. Codex carried the largest licensed population at 320 users, but its 14% weekly active use and 322 merged pull requests translated to roughly $543K in value, while Claude Code did far more with fewer people. Same spend category, very different return. Adoption data turns "we have Codex" into a specific read on how much of it is idle, which is the first honest input to any time-saved figure. Pull the same view across Slack, Teams, and Gemini with a unified adoption dashboard.
Step two moves from opened to load-bearing. The sharpest proficiency signal for a coding assistant is the volume of committed code it contributed as a percentage of total lines shipped, read alongside the task types it handles. Worklytics classifies AI activity into real work categories, including coding, research, analysis, summarization, drafting, and email, so you can see where Codex is carrying weight instead of guessing from license logs.
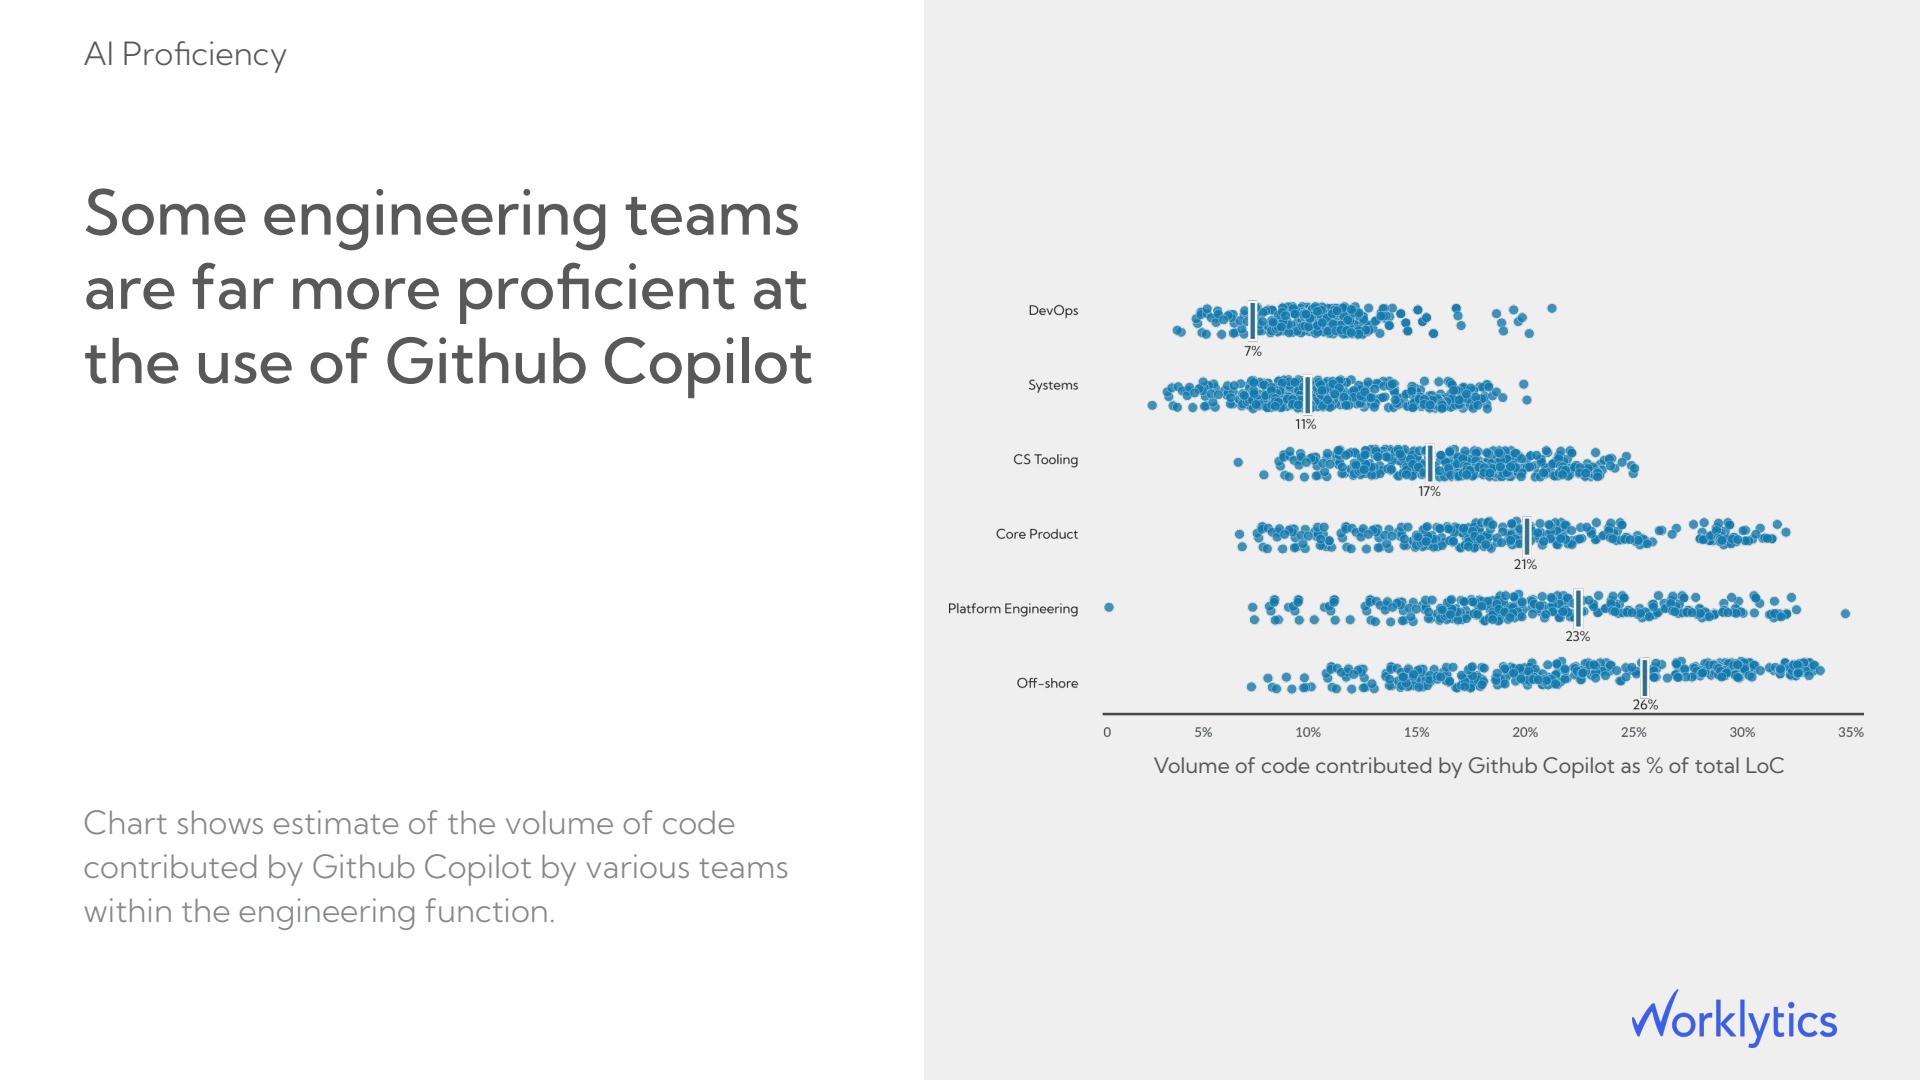
That 7% to 26% spread is what redirects budget. Every team held the same license, yet leverage varied nearly fourfold based on how the tool was woven into daily work. The read is direct: the 7% teams do not need more seats, they need enablement and workflows that route the right tasks to the assistant. Proficiency data names the exact teams to coach, so effort lands where the return is currently lowest.
Step five is the one teams skip, and it is where vanity numbers die. Generative assistants can lift output and rework at the same time, so hours saved has to be reported after the cleanup. Worklytics ties AI usage to engineering effectiveness analytics, so depth of Codex use is read next to cycle time, review load, and revert rate rather than on its own.
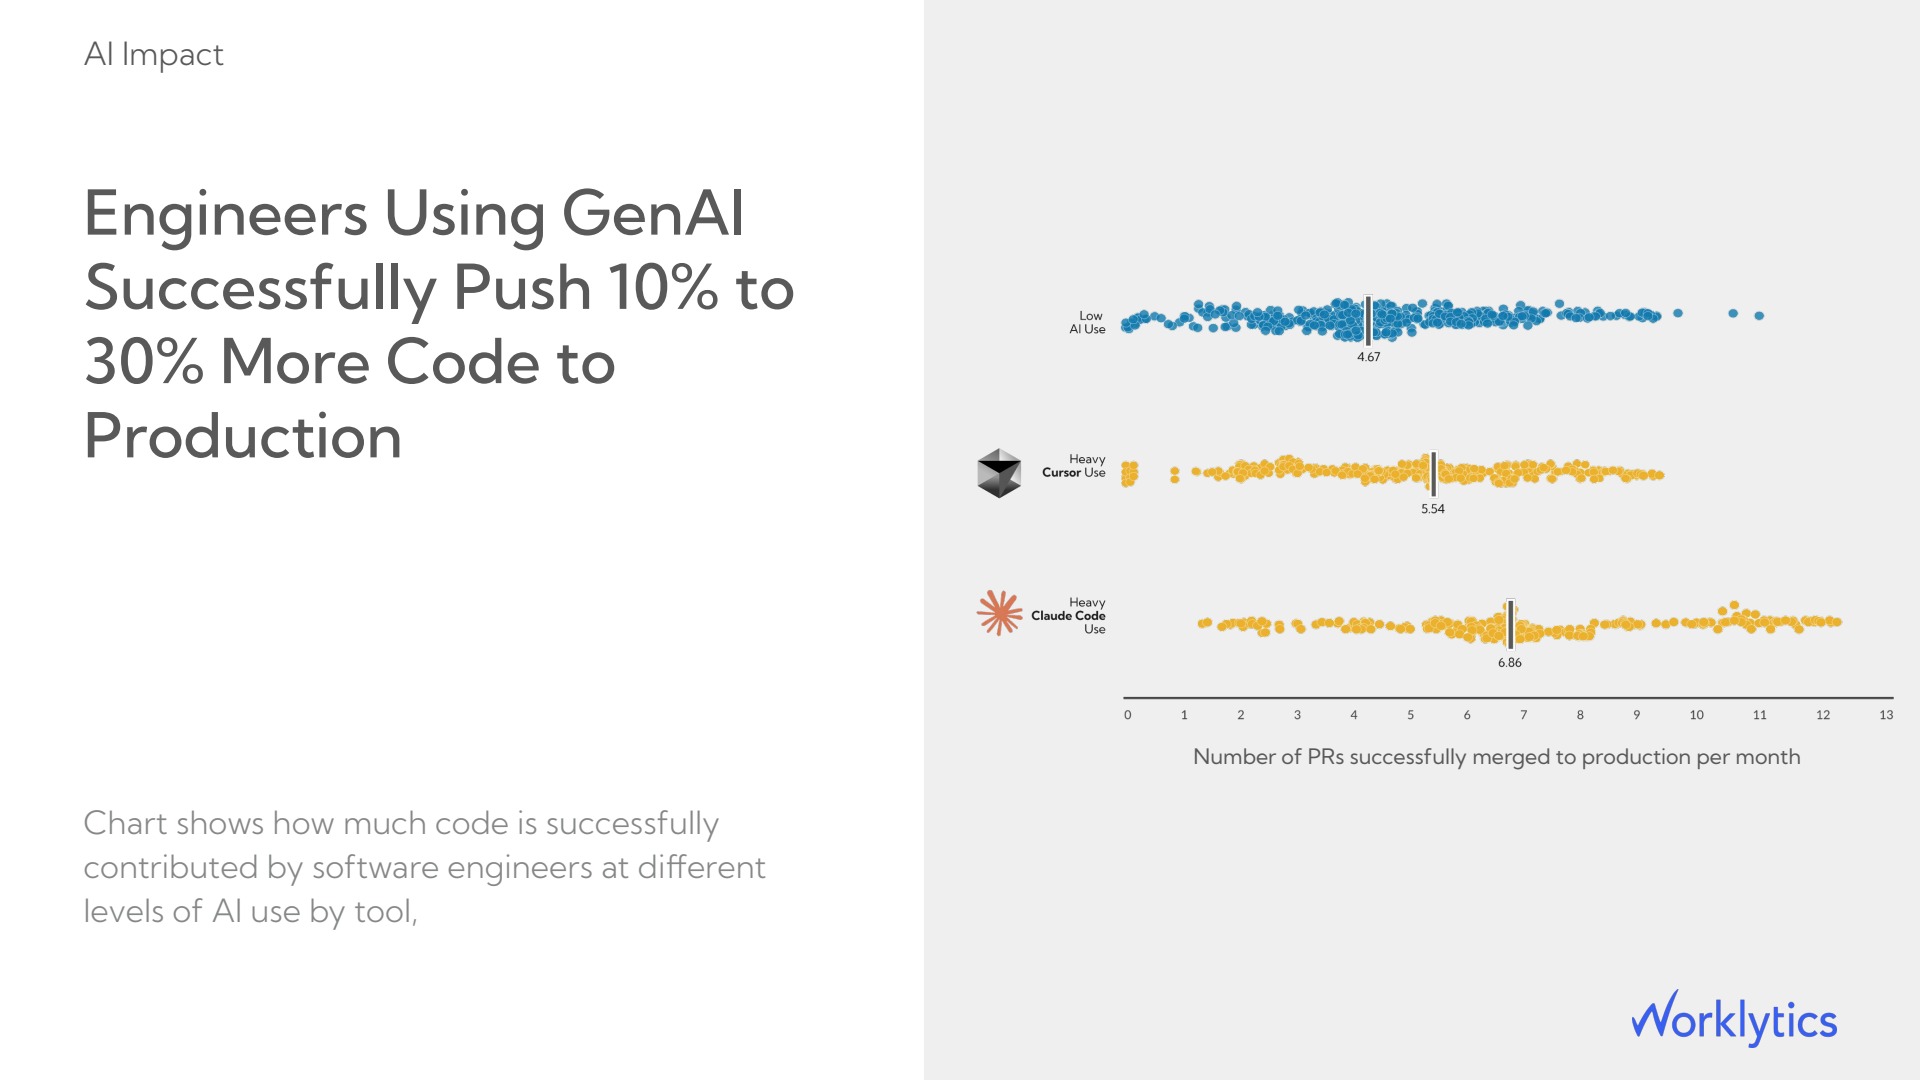
The upside is real. Engineers with heavy AI use merged 6.86 pull requests per month against 4.67 for low-AI peers, a 47% lift. The caution sits right beside it. After one team rolled out a new coding assistant, monthly PR reverts climbed from around 4 to 17 as reviewers absorbed more machine-written code.
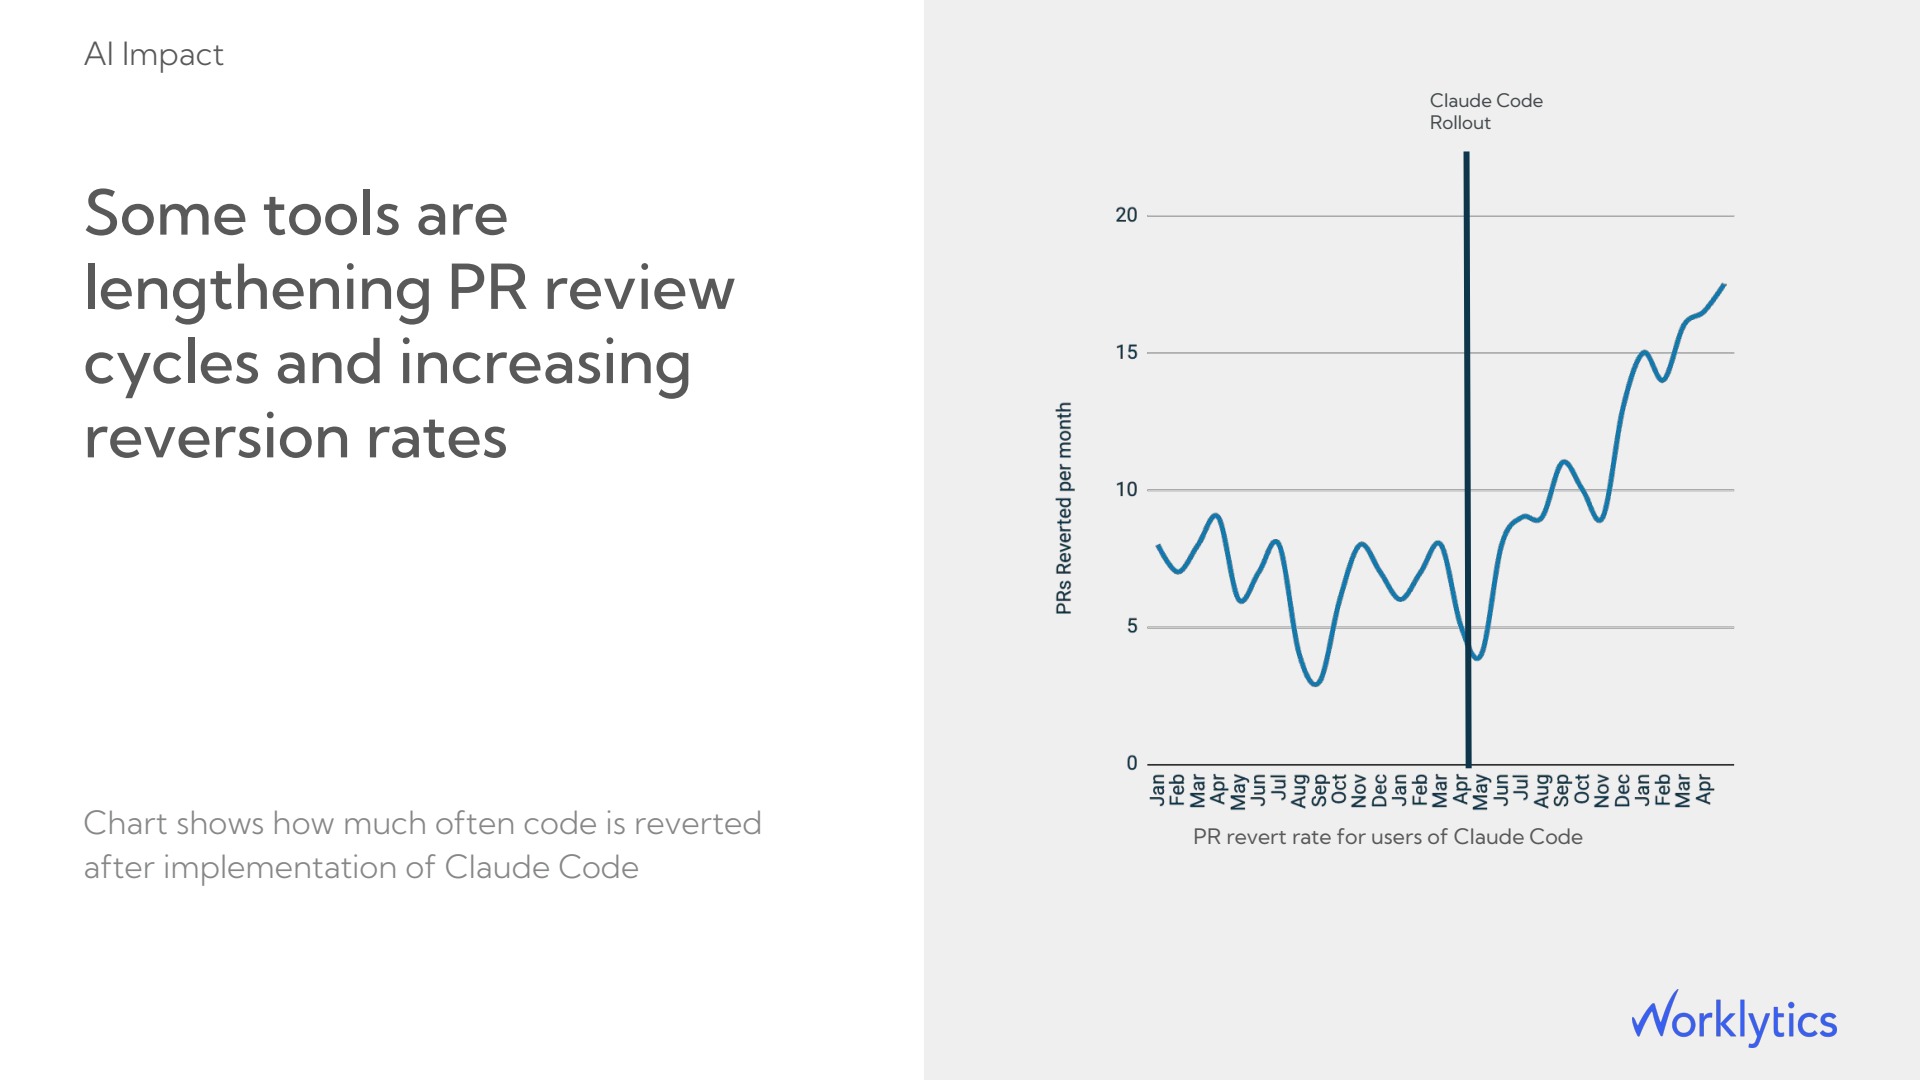
Net time saved is gross hours removed minus the hours rework and slower reviews add back. Pairing Codex signals with DORA delivery metrics keeps that subtraction visible, so a team celebrating more merged PRs also sees whether stability held. Skip the check and you can report hours saved while quietly shipping slower.
Codex is one instance of a general problem, and the model transfers cleanly to revenue teams. For AI sales team effectiveness the unit shifts from the pull request to the rep, and the outcomes shift from merges to meetings booked and pipeline touched, but the five steps hold without change. You still confirm usage, measure how much of the selling motion AI touches, convert to hours, price them, and net out rework.
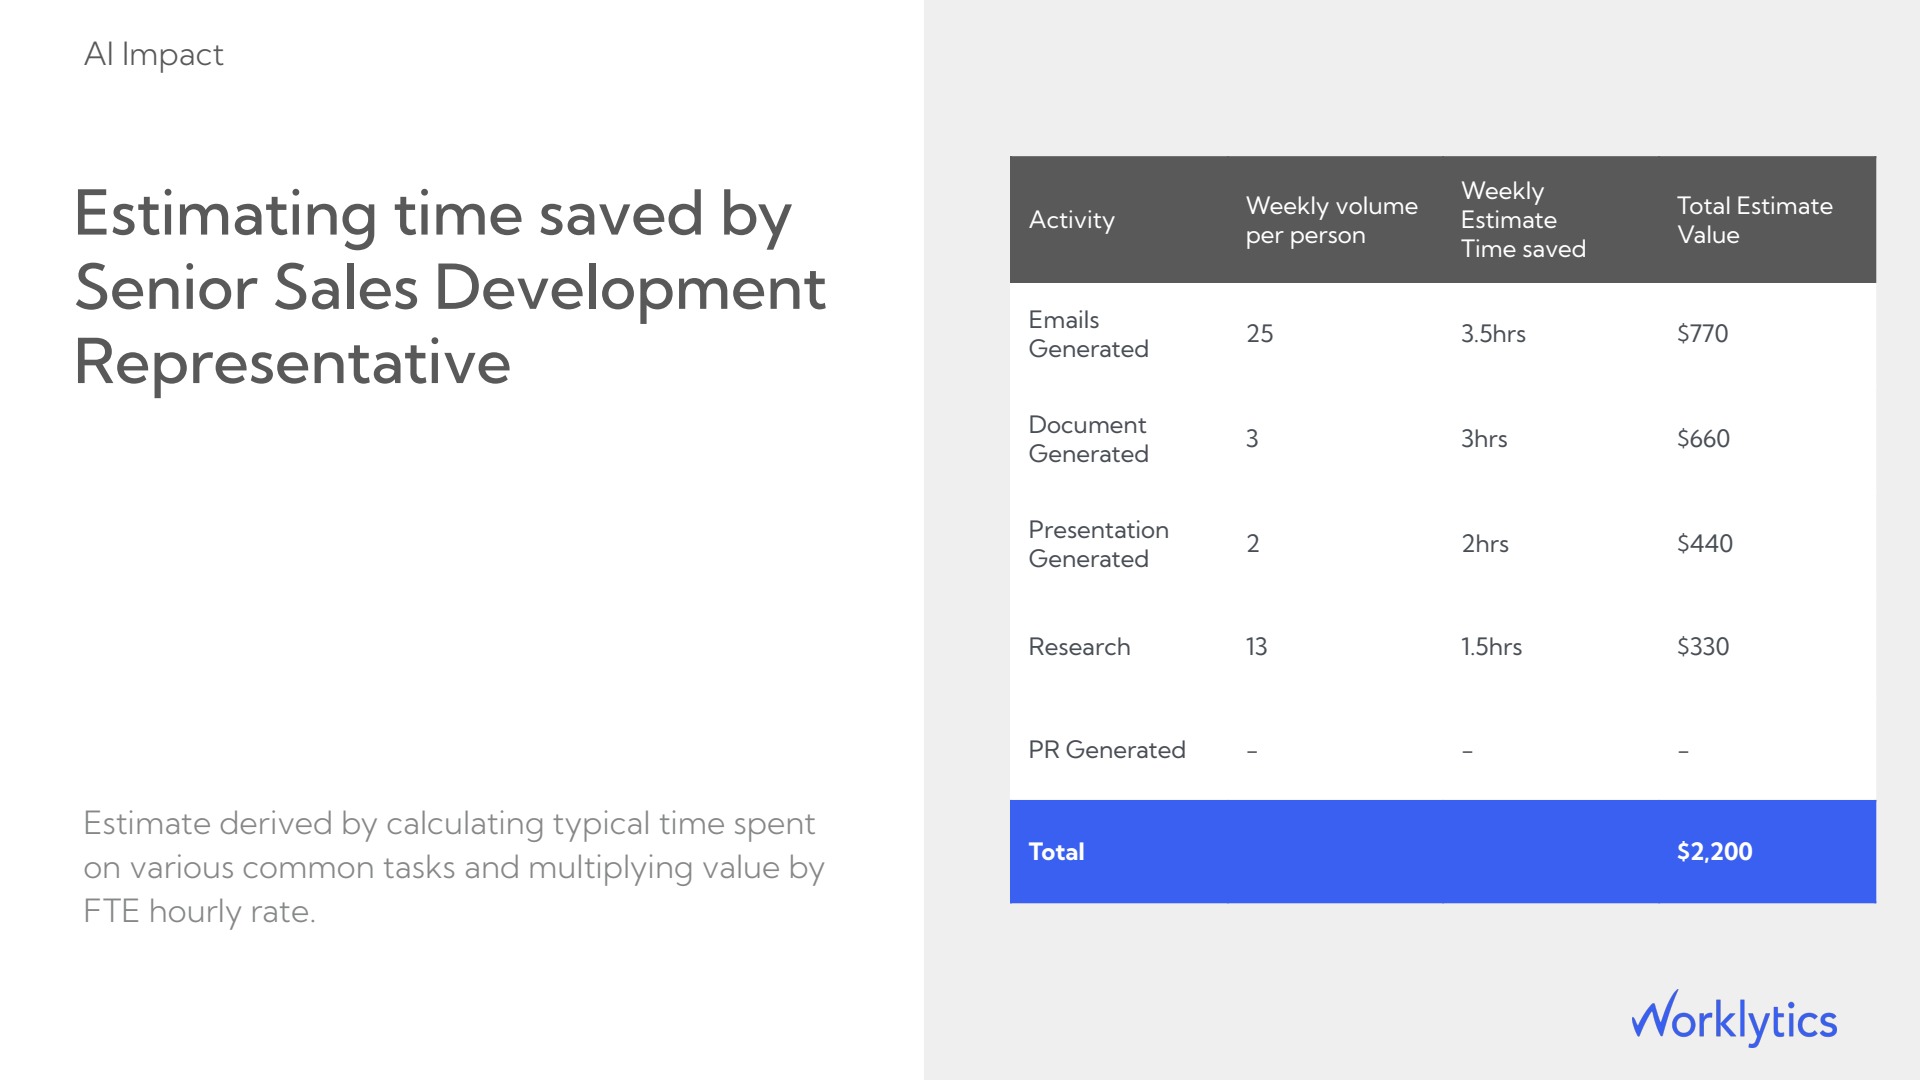
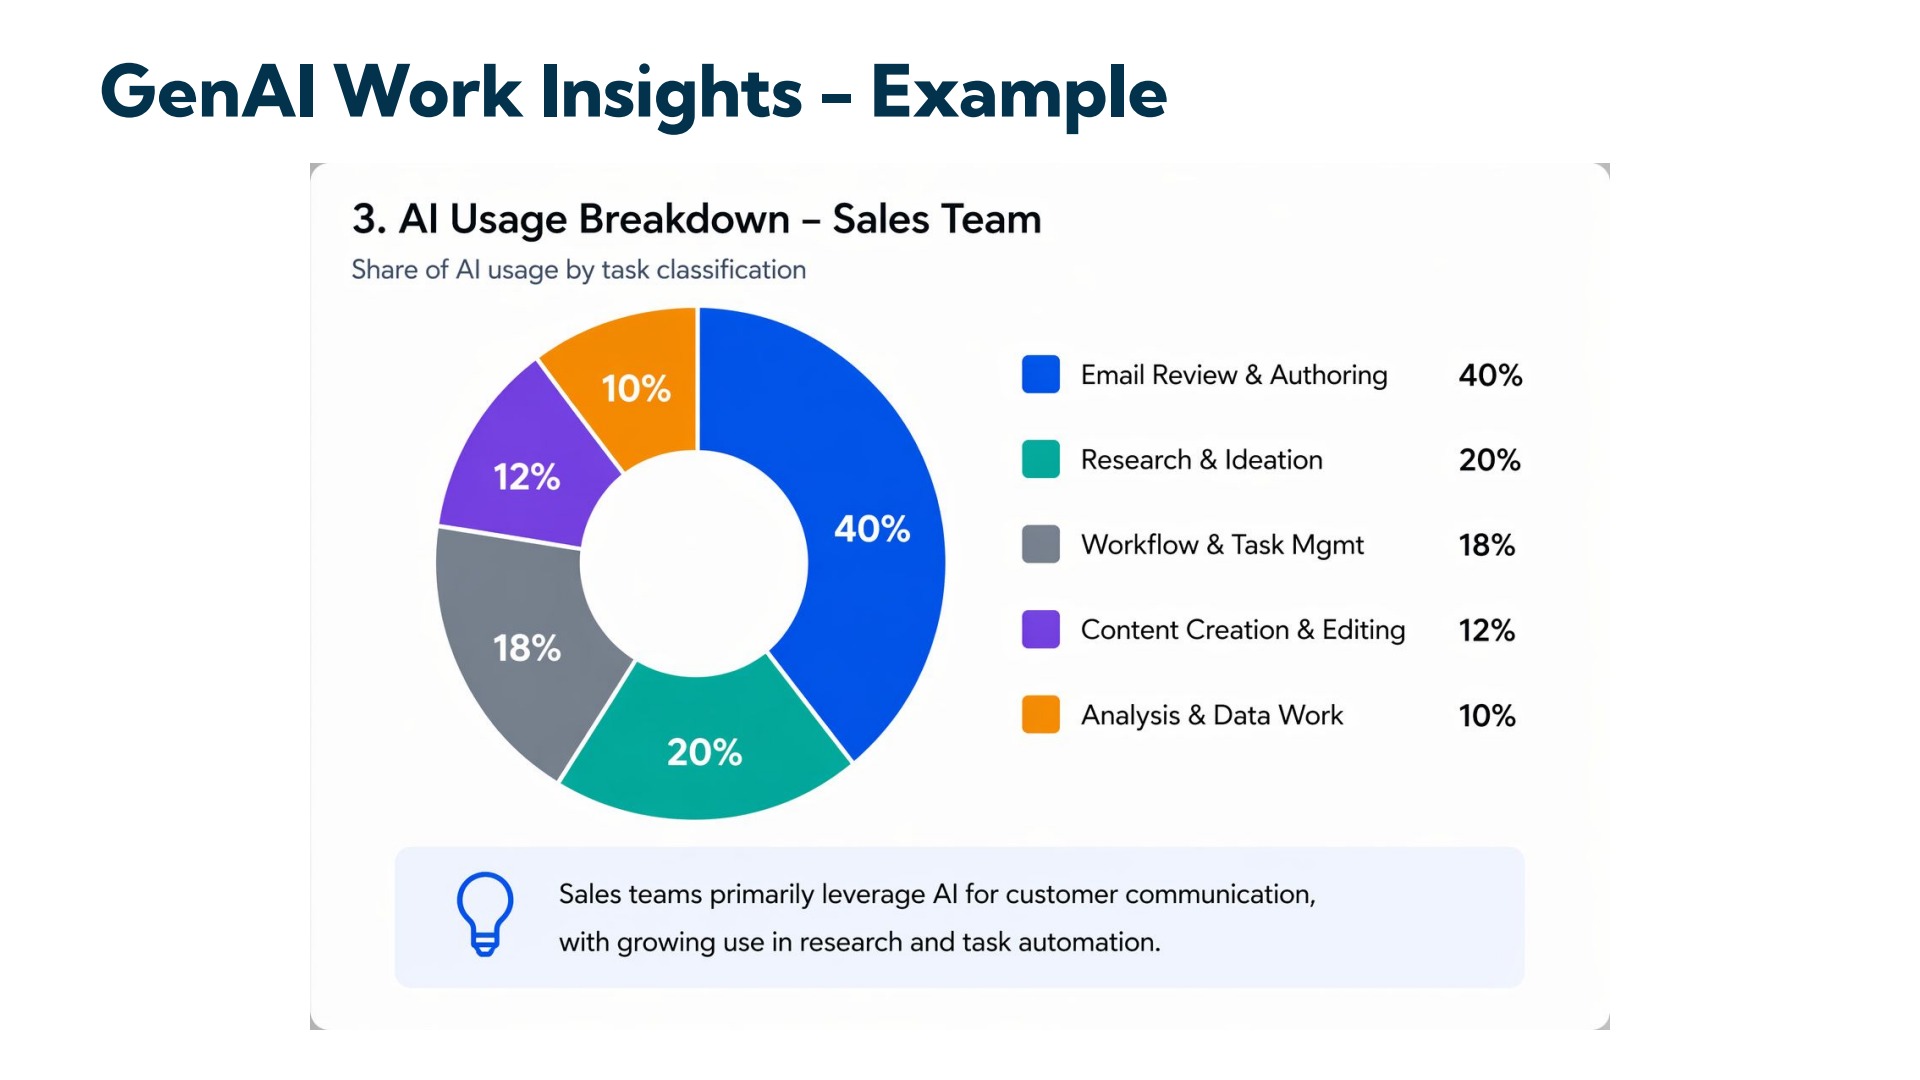
The numbers make the parallel concrete. A senior sales development rep using AI recovers roughly 10 hours a week, split across email drafting at 3.5 hours, document creation at 3, presentations at 2, and research at 1.5, which lands near $2,200 in weekly value per rep. Worklytics has also observed reps supported by AI connecting with about 30% more customers. Because the platform runs one framework across functions, a leader can put AI sales team effectiveness and Codex on the same scorecard and fund whichever converts adoption into results fastest. The same foundation scores employee well-being, meeting effectiveness, and manager effectiveness from the same work data.
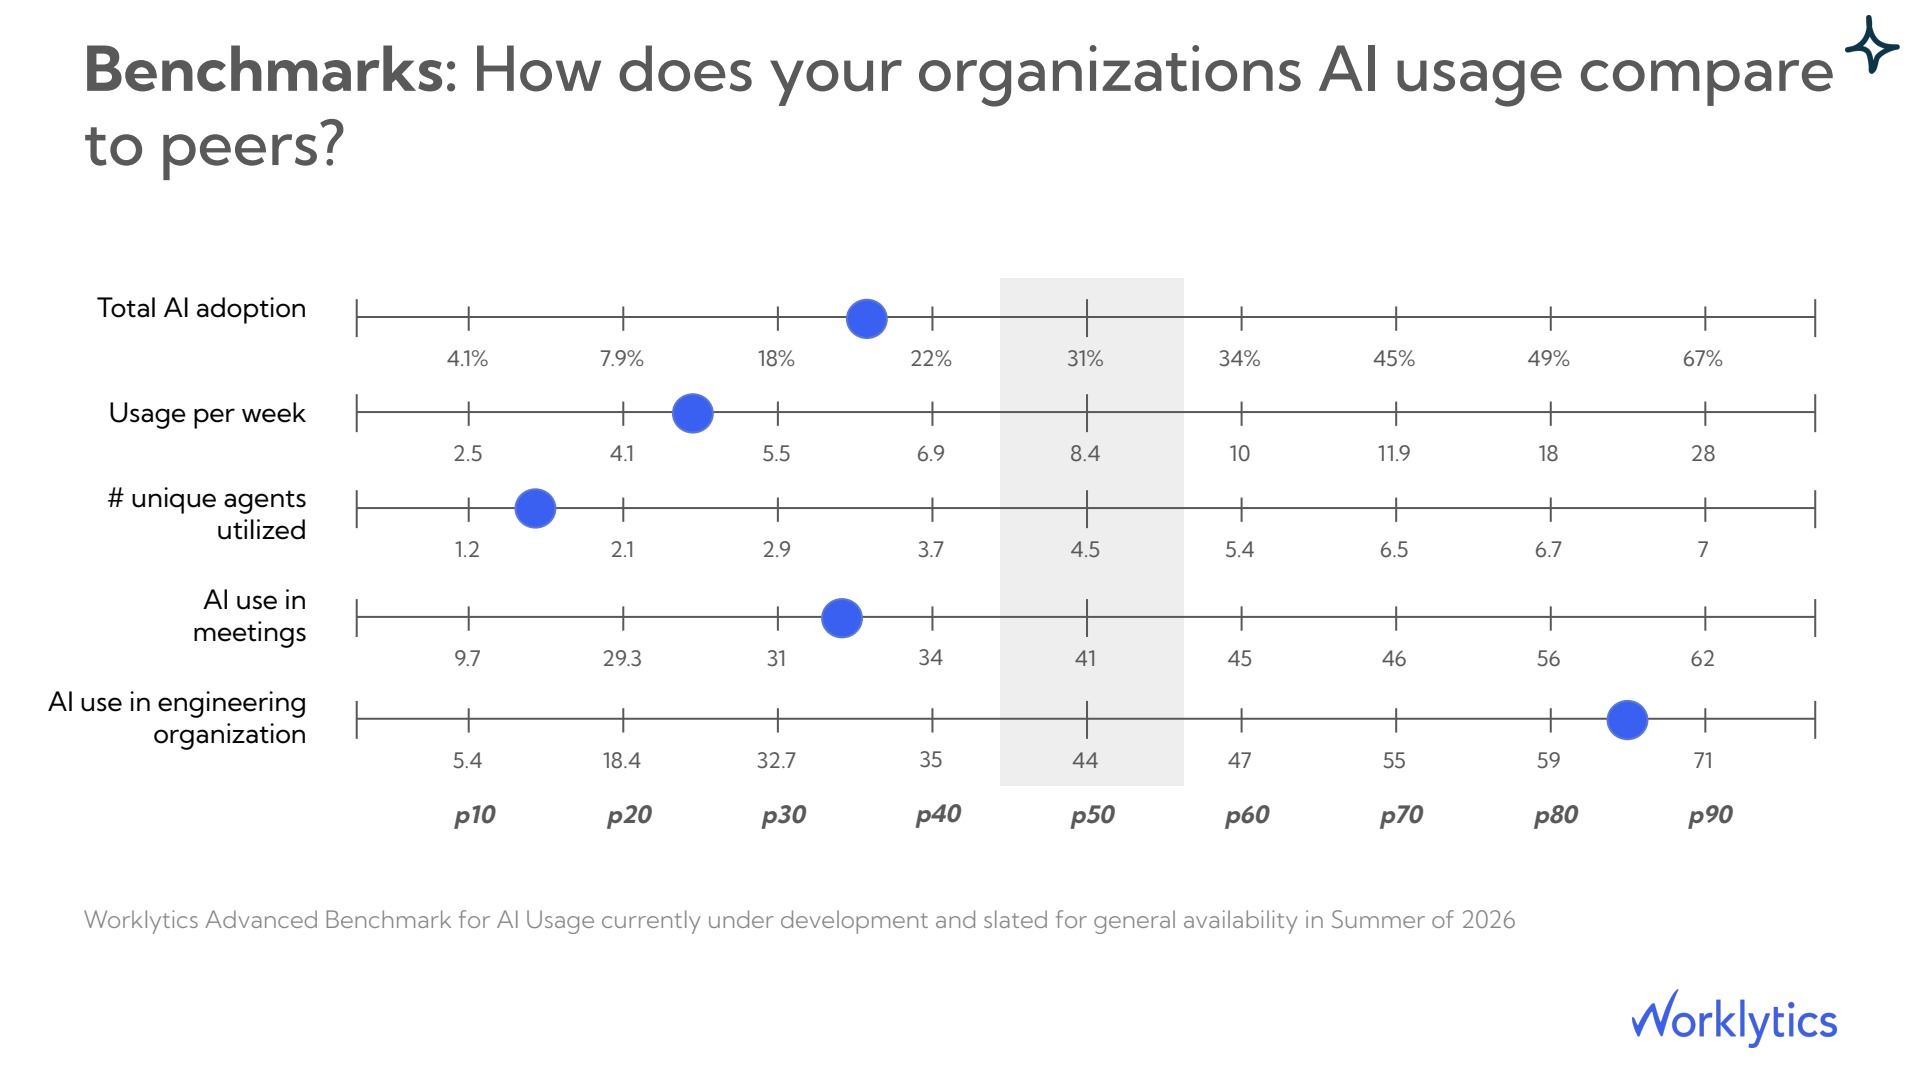
A time-saved number means more once you know whether it is good. Worklytics pairs your internal trend with peer benchmarks, so adoption reads as a percentile against comparable organizations instead of a lonely figure. In the example below, the org sits near the 35th percentile on total AI adoption and the 20th on weekly usage, yet reaches the 85th on AI use inside engineering. The story is specific: strong where Codex and its peers already live, behind everywhere else.
Benchmarks tell you where the gap is. Managers are how you close it. Team adoption tracks closely with whether the team's manager uses AI visibly and asks about it in one-to-ones, which makes manager behavior a leading indicator of team adoption three to four weeks out. Worklytics surfaces this through the AI Adoption Facilitation Index and the manager scorecard, so enablement aims at the specific managers whose teams have stalled rather than broadcasting to everyone. Feeding the same signals into AI usage in performance reviews then holds the behavior in place after the launch push fades.
Estimate the time Codex removes from each task type, multiply by how often that task occurs and by how many people actively use it, apply a loaded hourly rate, then subtract the hours added by rework and slower reviews. Worklytics automates this from work data so the figure updates continuously instead of once per survey.
No. Self-reported savings tend to run 30% to 50%, while observed savings in controlled work land nearer 10% to 15%. Recall over-weights the moments the tool helped and under-weights the cleanup, which is why observed behavior beats memory.
Weekly active use and code persistence matter more than seats sold. A tool at 90% activation but 14% weekly active use is mostly idle. Healthy adoption shows steady weekly use and a rising share of committed code that survives review.
The framework is identical, only the unit and outcomes change. For AI sales team effectiveness the unit is the rep and the outcomes are meetings booked, customers reached, and pipeline touched, rather than pull requests merged. One senior SDR using AI saves close to $2,200 per week on the same math.
Yes. Worklytics works from aggregated and de-identified work data, reporting at the team and role level rather than naming individuals, so you get adoption, proficiency, and leverage figures without keystroke tracking or individual monitoring.
Most organizations see initial metrics within a week of setup, with meaningful trend data forming over the following 30 days as usage patterns stabilize.
Codex spend is only half of a decision. The other half is the hours it returns, measured net of rework and read against peers. See how Worklytics measures AI adoption, proficiency, and leverage across every tool and every team, so time saved stops being a guess and becomes a line you can defend.