Most organizations already have a number for AI skills. It came from a survey question that asked employees to rate their AI proficiency on a five-point scale, and it produced a tidy distribution in which almost everyone landed at "intermediate."
That number is not useless, but it answers a different question than the one leadership is asking. Stanford HAI's 2026 AI Index put organizational AI adoption at 88% while noting that measurable productivity gains stay concentrated in a small leading cohort. When nearly every company has access and only some see returns, the variable separating them is not tool availability. It is what people do with the tools, at what frequency, on which parts of their work. Surveys cannot see any of that.
This is a guide to measuring AI skill from work data: what the layers are, which metrics belong in each, what the observed ranges look like, and how to run the measurement without turning it into surveillance.
A skill is only measurable through the traces it leaves. For AI use at work, those traces sit in three layers, and each answers a question the layer beneath it cannot.
Adoption answers whether an employee reaches for AI when a suitable task appears. It is a habit question, and habits show up as frequency, not as headcount.
Proficiency answers how much of a person's actual work now runs through AI, and how substantive each interaction is. A person who opens a chat tool daily to reformat text and a person who uses the same tool to restructure an analysis both register as daily active users. Their skill is not comparable.
Leverage answers whether the work itself changed: fewer hours on a task category, more throughput, less rework. This is the layer executives care about and the layer that cannot be inferred from usage counts alone.

The reason this ordering matters operationally is that interventions differ by layer. A team stuck at adoption needs access, permission, and a first use case. A team with high adoption and low proficiency needs technique, not licenses. A team strong on both but flat on leverage has an AI habit that is not attached to the work that consumes its week. Worklytics builds this progression into AI adoption measurement so the diagnosis points at a specific intervention rather than a general push. The org-level version of this progression is covered in the AI maturity curve framework.
Survey drift is not a sampling problem you can fix with a better instrument. It has four specific causes, and each pushes the result in a predictable direction.
Self-ratings are relative to a reference group. An employee rates their AI skill against the colleagues they see, so the same behavior scores "advanced" on a low-adoption team and "basic" on a high-adoption one. The result is that survey data compresses exactly the between-team variance you need in order to target training.
Non-response correlates with the trait being measured. People who do not use AI have the least reason to complete an AI survey, which inflates the mean and makes the gap look smaller than it is. Behavioral measurement has no opt-out gradient of this kind.
Recall windows do not match usage patterns. AI use is bursty. Someone who spent one intense week using an assistant for a migration and nothing since will answer "weekly" in good faith. Frequency measured across rolling weeks separates a sustained habit from a single project.
Vocabulary decides the answer. An employee using AI-drafted replies in their mail client, AI summaries in a meeting tool, and code completion in their editor may report low AI use because none of those feel like "using AI." Under-reporting concentrates in exactly the assistive tools that are most widely deployed, which is why survey-based adoption numbers frequently come in below observed usage.
Activation rate, the share of licensed employees who have used a tool at least once, is the metric most organizations start with and the one that stops being informative fastest. It saturates within a quarter of any serious rollout and then reports 90-something percent forever while nothing improves.
Four metrics carry the actual signal:
The threshold that matters is around two to three active days per week. Below it, use is triggered by memory: the employee thinks of AI, then decides to use it. Above it, use is triggered by the task itself, and that shift is what makes gains durable when project pressure returns.

Plotting frequency against intensity separates four populations that a single adoption percentage merges. Power users are frequent and deep. Dabblers are infrequent and shallow. Habit starters use AI often but lightly, which usually means one narrow use case such as email drafting. Occasional deep users run substantial sessions but only when a specific project calls for it, which is the group most likely to be misread as low adopters when they are actually skilled and under-supplied with use cases.
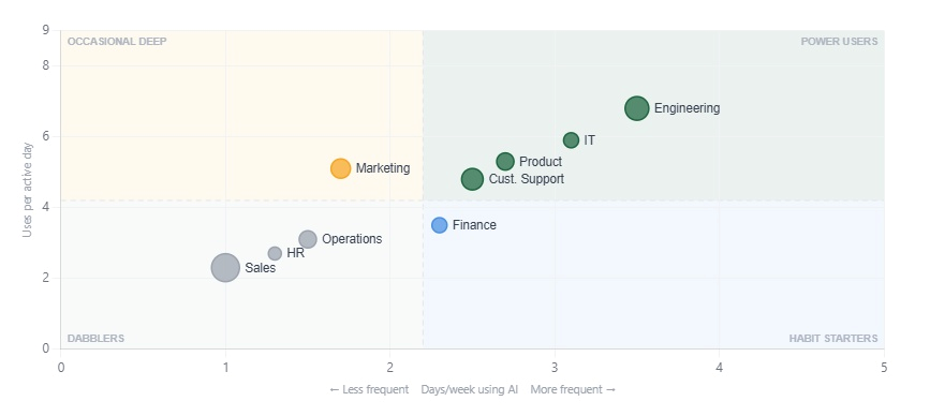
The quadrant is also a coaching map rather than a leaderboard. Habit starters have the routine but not the depth, so they respond to workflow-specific training such as multi-step prompting on a task they already perform weekly. Occasional-deep teams like marketing have the skill but lack the trigger, which points to cadence interventions: embedding AI into a recurring ritual such as campaign retros or weekly reporting. Dabblers need both, which is why a single company-wide training program reliably underserves three of the four quadrants.
These signals only hold together when they cover the full tool estate. Worklytics pulls usage from across the stack through its workplace insights dashboards and platform integrations, including coding assistants, so a Cursor-heavy engineering org and a Copilot-heavy finance team are measured on the same scale rather than in separate vendor consoles.
Proficiency has one primary measure and several supporting ones. The primary measure is the share of tracked work activity that included some form of AI assistance. It is the closest available proxy for "how much of this person's job now involves AI," and it is the metric that makes skill gaps legible across functions that do very different work.
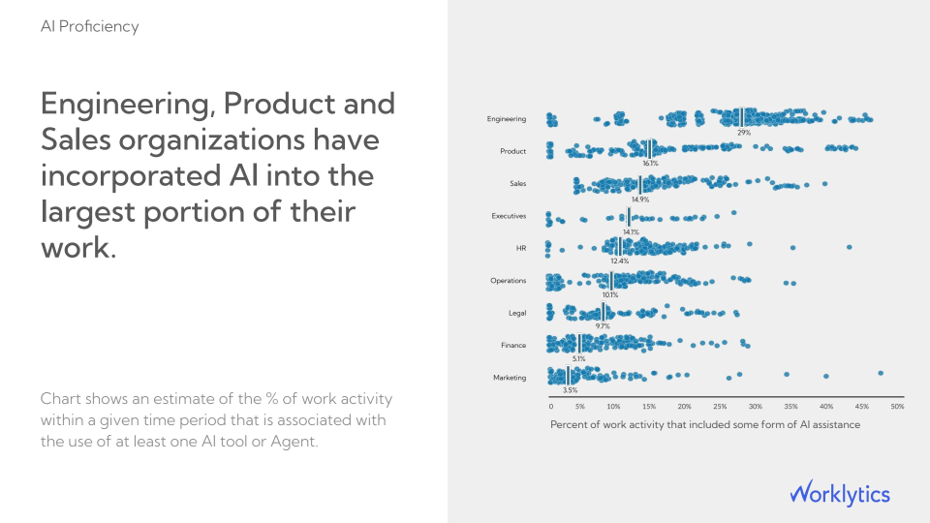
Within engineering, individuals range from near zero to above 45%. A function-level average of 29% reads as a mature team while a meaningful portion of it has not adopted at all. The within-function distribution, not the mean, is the skill map.
Depth signals do the rest of the work, and each one isolates a different competency:

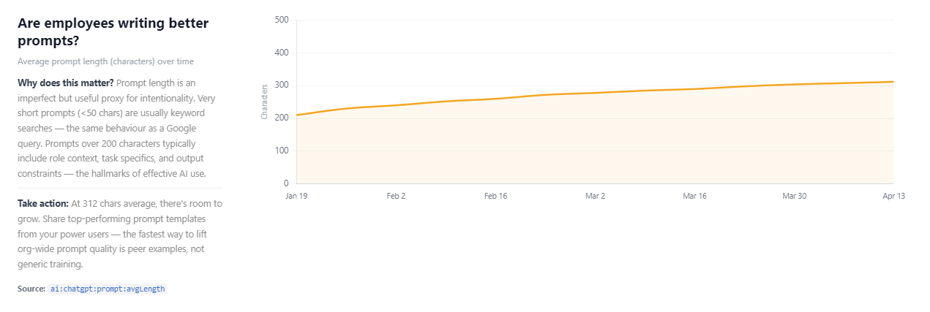
The reason depth belongs in a skills program rather than a usage report is that it is coachable in a way that adoption is not. Prompt length moved 48 characters over 14 weeks in the deployment above, and that movement came from circulating templates written by internal power users rather than from generic training. Sharing a working prompt from a colleague in the same role transfers tacit method. This mirrors the mechanism identified in the Brynjolfsson, Li and Raymond study of generative AI at work, where an assistant raised productivity 14% on average and 34% for novices, largely by propagating the practices of the strongest performers.
Worklytics classifies AI activity into work categories such as coding, research, analysis, summarization, and drafting, which is what allows proficiency to be reported against a team's real workload. For engineering specifically, those signals connect to delivery metrics through engineering effectiveness analytics, so depth of AI use can be read next to cycle time rather than in isolation.
Leverage is where most AI measurement programs stall, because the obvious approach, comparing output before and after rollout, is confounded by headcount changes, seasonality, and the reorganizations that tend to accompany AI initiatives. The design that survives scrutiny compares high-adoption and low-adoption cohorts doing comparable work over the same period, then checks whether the gap widens as adoption deepens.
Two measures make leverage concrete. The first is estimated time returned by task category, which is where AI skill converts into capacity. The second is the AI-assisted share of task volume that is plausibly automatable, which is the inverse view: how much of the addressable work has not been touched yet.

The tasks with the highest per-user return are not the tasks with the highest adoption. Email drafting is the entry point for most employees because it is low risk and immediately visible, yet it returns roughly 0.7 hours per active user per week. Analysis and code generation return several times that and are adopted by far fewer people. A skills program that optimizes for adoption breadth will keep pushing the lowest-yield use case.

For teams that need a defensible dollar figure rather than an hours figure, the AI ROI calculator converts observed time savings into annualized value using your own headcount and cost assumptions.
Company-wide AI skill scores are the least useful artifact this measurement produces, because the variance that matters is between functions and within them.
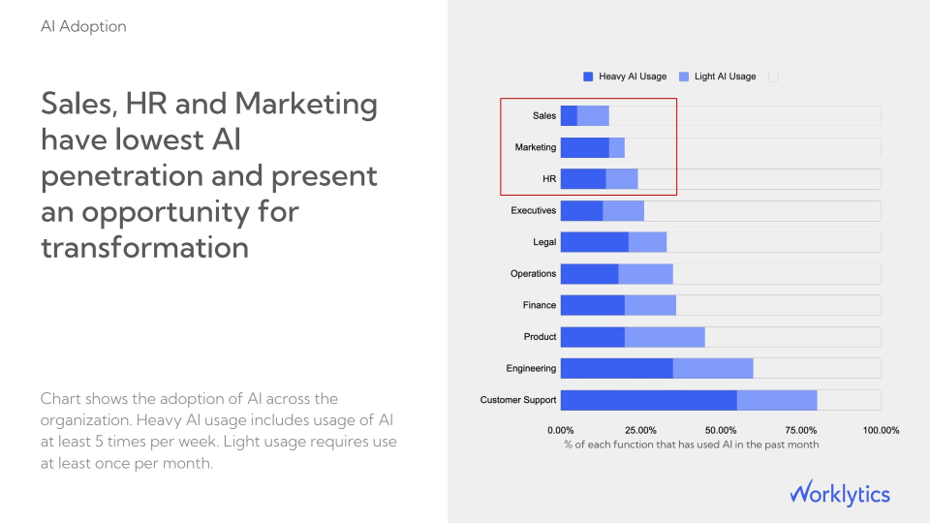
The functions at the bottom of that chart are usually the ones with the strongest theoretical case for AI, which is the tension worth investigating rather than explaining away. Sales and HR run on drafting, summarization, research, and CRM or HRIS data entry, all of which are well-served by current tools. Their low penetration is rarely a capability ceiling. It is more often a workflow problem: the AI tool sits outside the system where the work happens, so using it costs a context switch that the employee is unwilling to pay under quota or case-load pressure.
Agent activity makes this sharper still. In deployments where agents are counted separately from assistant usage, sales frequently registers the highest volume of agent-initiated actions per week even while individual sales AI usage sits low. Automation is running underneath a team whose members are not personally skilled with AI. That is a real capability, and it is also a specific risk: the team cannot evaluate, correct, or extend what the agents produce.
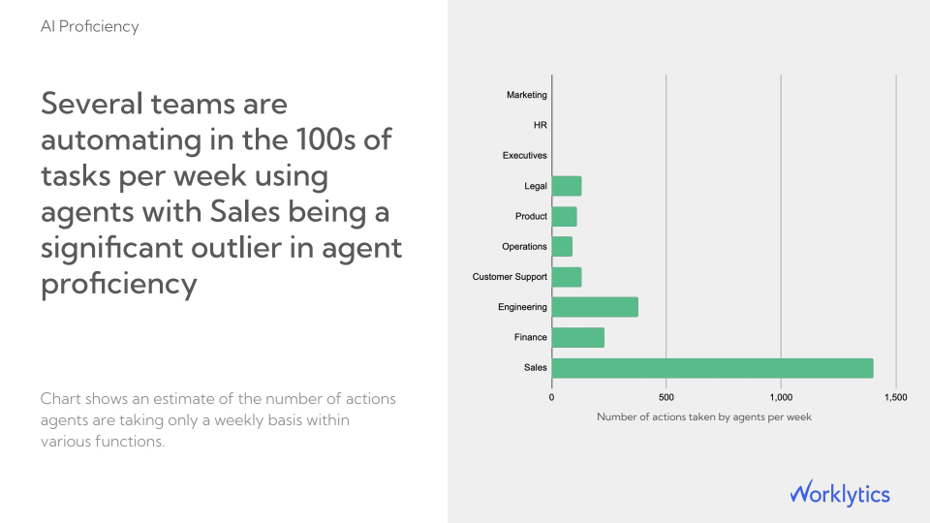
These gaps are where a measurement program becomes a plan. The functions with the widest distance between workload and AI support are the ones to prioritize, not the ones with the lowest headline score.
Internal comparison tells you who is ahead of whom inside your own company. It cannot tell you whether the whole company is behind, which is the question an executive team eventually asks.
Peer distributions on AI usage are unusually wide, which is why single-figure industry averages mislead:
WebflowHTML embed — copy the code below into an Embed element:

Read across a row and the diagnosis changes. Sitting at the median on total adoption and in the bottom quintile on unique agents means the workforce has learned to prompt but not to delegate. Sitting high on sales AI usage and low on weekly usage overall means one function has run ahead and the practice has not transferred. Neither conclusion is reachable from an internal number. Worklytics peer benchmarking supplies the distribution so targets are set against observed ranges rather than against a round number someone liked.
The value of behavioral measurement is that it changes who receives training and what that training contains.
Tenure is the clearest example. Adoption consistently runs highest among recent hires and declines with tenure, and the mechanism is not attitude. Long-tenured employees have workflows that already work, refined over years, with known reliability. Adding AI asks them to trade a reliable process for an unfamiliar one, and the expected value of that trade is negative until the new process is proven. Newer employees have no such sunk process to defend.
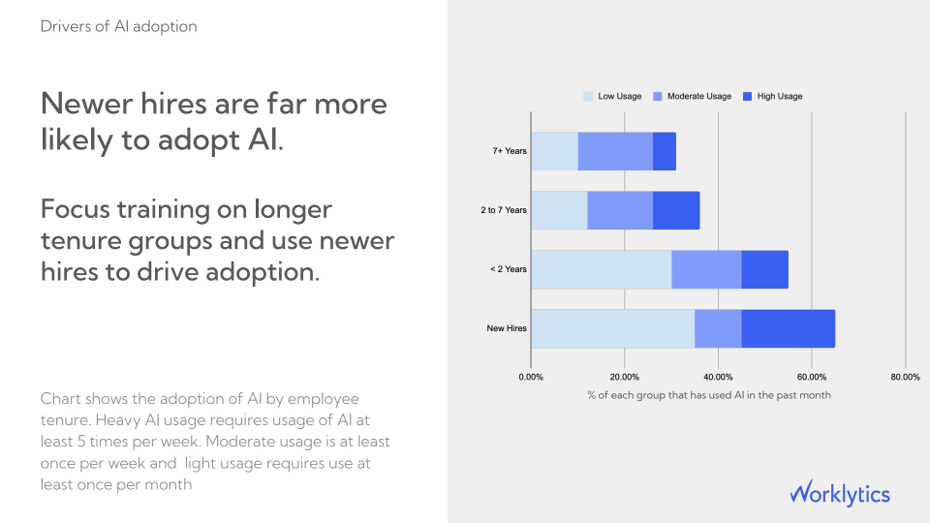
This leads to two different interventions rather than one training program. Long-tenure groups need workflow replacement: a specific, high-frequency task in their existing process, rebuilt with AI, demonstrated by someone in their role. Newer employees need technique and guardrails, since their adoption is already high and their risk is uncritical acceptance of output.
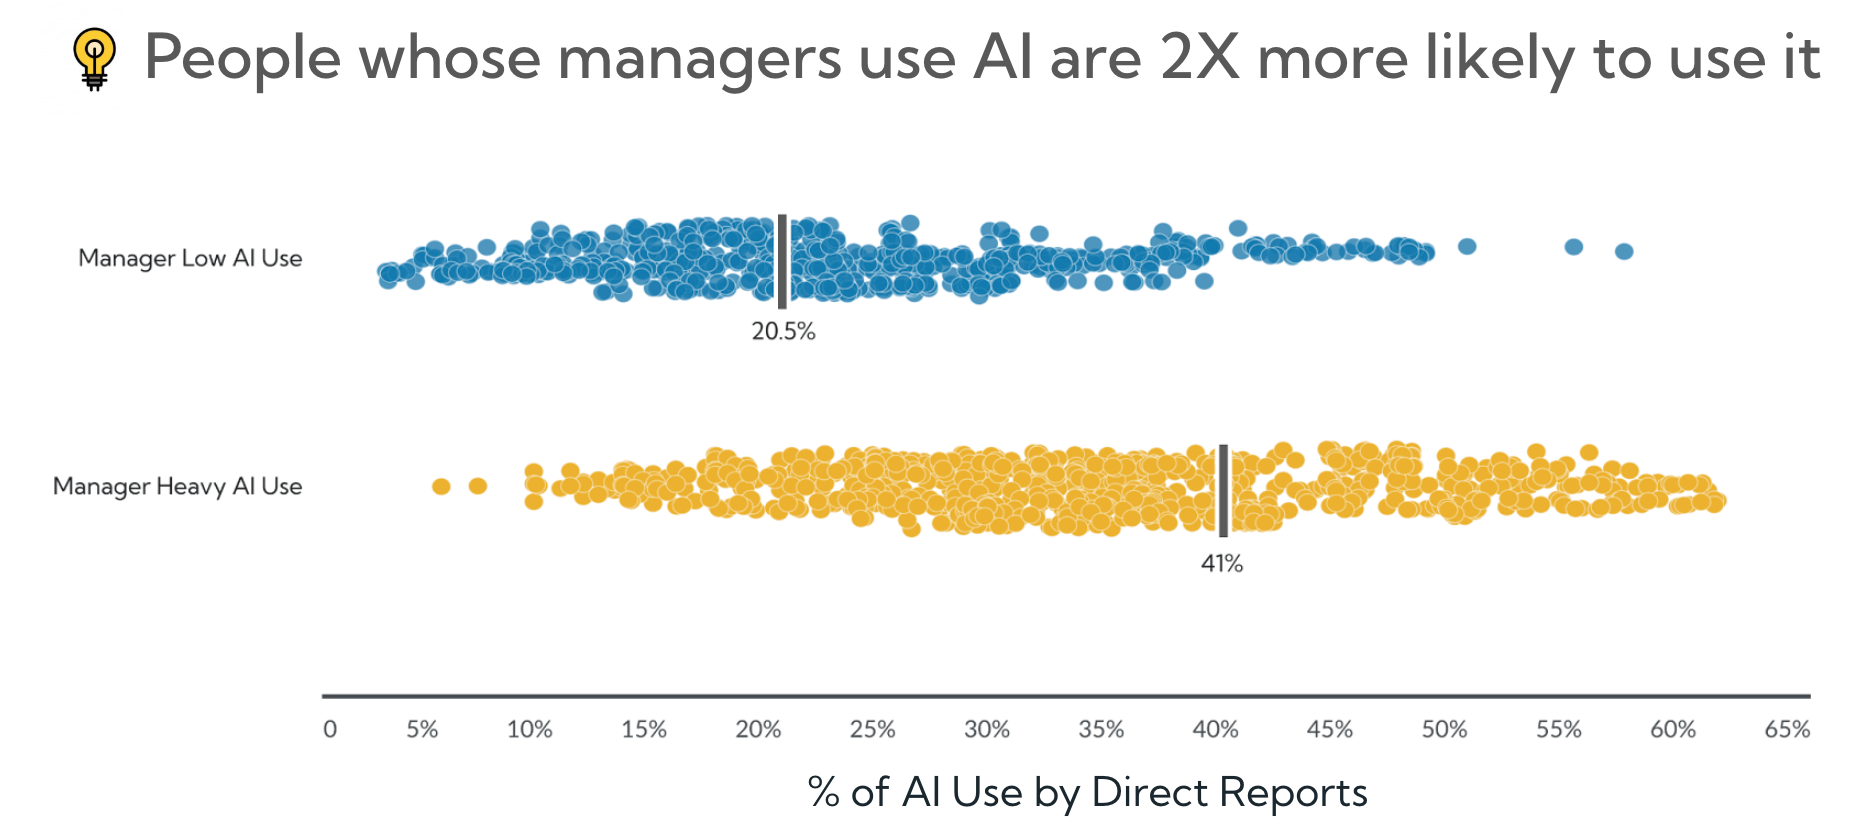
Managers are the unit that determines whether either intervention holds. Adoption on a team tracks closely with whether its manager uses AI visibly and asks about it in one-to-ones, which makes manager-level AI behavior a leading indicator for team-level adoption three to four weeks out. Worklytics surfaces this through the manager scorecard and manager effectiveness analytics, so enablement can be directed at the managers whose teams have stalled rather than broadcast to everyone.
Behavioral measurement of AI skill fails on two grounds if it is designed at the individual level and exposed to managers. The first is the obvious privacy objection. The second is less obvious and more damaging: individual AI scores create an incentive to produce the metric rather than the outcome. People pad prompts, open extra tools, and run sessions they do not need. The measurement degrades precisely as visibility increases.
Aggregate-only reporting solves both problems with the same design decision. The controls that make it defensible:
Worklytics is built on this model. The privacy architecture and security documentation cover the aggregation and pseudonymization approach, and the data dictionary specifies exactly which fields are collected, which is the document works councils and data protection officers will ask for first.
The point of the 60-day cycle is that each intervention leaves an evidence trail. That trail is what turns an AI skills program into something reportable to a board, an auditor, or a regulator.
Can you measure AI skills without surveys entirely? Behavioral data measures what people do, which is the capability question. Surveys remain useful for the barrier question: why a team with access is not using a tool. The reliable pattern is behavioral data for measurement and short targeted surveys for diagnosis, run against the specific cohorts the data flags rather than across the whole workforce.
What is a good AI adoption rate? Peer distributions run from roughly 4% at the 10th percentile to 67% at the 90th, with the median near 31%. A target is only meaningful relative to that distribution and to your own starting point. Moving from the 30th to the 50th percentile in two quarters is a stronger result than holding a high absolute number that has not changed.
How is AI proficiency different from AI adoption? Adoption counts whether and how often someone uses AI. Proficiency measures what share of their work involves AI and how substantive each interaction is, using signals such as messages per session, prompt length, tool selection, and number of agents in regular use. Two people with identical adoption numbers can differ several-fold on proficiency.
Does measuring AI proficiency require reading employee prompts? No. Depth metrics such as session counts, message counts, prompt length, and model selection are all derived from metadata. Prompt length is a character count, not a content read. Worklytics analyzes usage metadata only and reports at aggregate level.
How long before the data is meaningful? Connection to major platforms produces first metrics within about a week, with usable trend data after roughly 30 days. Anything shorter than a month will misread normal weekly variation as a trend, particularly in functions with month-end or quarter-end cycles.
How does this support EU AI Act Article 4 documentation? The Digital Omnibus adopted in June 2026 softened Article 4 to a duty to take measures supporting AI literacy development, and supervision by national market surveillance authorities begins in August 2026. The Commission's guidance expects organizations to record the measures they implement. Attendance records show a measure was offered. Behavioral data across the same cohort before and after shows the measure worked, which is a materially stronger position.
Skill measurement fails when it produces a number nobody can act on. Adoption, proficiency, and leverage are useful because each one points at a different intervention, and because the gap between them tells you where a program is stuck. If you want to see these metrics against your own data, book a walkthrough of the AI adoption dashboard or request the sample AI Adoption Report.