AI task automation discovery answers a narrow question with broad consequences: which specific tasks are your employees already handing to AI, in which teams, and with what result. It differs from traditional process mining or automation candidate discovery, which look for tasks a company could automate in the future. Discovery in this context looks backward at automation that is already happening, usually without a formal program behind it.
The reason this question needs a deliberate answer is that adoption outran governance. Gallup's February 2026 data shows AI use at work climbed from 21% of US employees in mid-2023 to 50% in Q1 2026, with 13% using it daily. Only 41% of employees say their organization has formally integrated AI into its practices, which leaves a wide gap between what companies believe is happening and what employees actually do each day. Any leader who relies on rollout plans and license purchases to describe AI usage is describing the smaller half of the activity.
A useful mental model for the discovery process is the three-stage framework Worklytics applies to AI measurement: Adoption asks what share of the team uses AI at all, Proficiency asks what share of work is aided by AI, and Leverage asks whether the organization gets more done because of it. Task-level discovery is the engine of the second and third stages, because you cannot assess proficiency or leverage without knowing which tasks the AI is performing.

The Worklytics Adoption, Proficiency, Leverage model. Task discovery powers stages two and three.
License counts fail because a seat is a permission, not a behavior. In deployments Worklytics has analyzed, it is common for 500 licensed seats to translate into 440 weekly active users, and for half of those active users to touch a single tool once or twice a week. A survey fails for a different reason: recall bias and social pressure distort answers in both directions. Employees who fear monitoring understate usage, while employees who want to appear current overstate it, and neither group can accurately estimate what percentage of their drafting or analysis work involved AI last month.
Task concentration makes averages even less trustworthy. The Anthropic Economic Index, which analyzes millions of anonymized AI conversations, found that usage clusters heavily in a narrow band of tasks, with the ten most common tasks accounting for roughly a quarter of all consumer usage and nearly a third of business API usage. If automation concentrates in a handful of tasks and a handful of teams, an organization-wide average of "how much do we use AI" hides exactly the information a leader needs. Vendor admin consoles do not solve this either, because Microsoft's reports cover the Microsoft ecosystem, OpenAI's cover ChatGPT, and no single console shows the cross-tool task picture.
Discovery starts with a unified inventory, because the tool mix itself is a task signal. Coding assistants imply code automation, meeting AI implies summarization, and workspace copilots imply document and email work. The Worklytics AI adoption dashboard connects usage metadata from Slack, Microsoft Copilot, Gemini, Zoom, ChatGPT Enterprise, Claude, and coding tools through API integrations, then normalizes it into weekly active users, days per week, and uses per active day for every tool in one view. Teams that want the raw records instead of dashboards can pipe the same data into their warehouse through DataStream.
The consolidated view surfaces patterns no single console can. In a representative mid-size deployment, Google Workspace AI reached 40% of the workforce weekly while ChatGPT reached 28%, yet Cursor users averaged 6.8 uses per active day against 4.4 for Workspace AI, a signal that the smallest tool population was doing the deepest automation. The same deployment showed a median of 1.8 tools per active user and 54% of active employees using only one tool, which identifies the single-tool majority as the largest expansion opportunity before any training budget is spent. For tool-specific setup, see the Worklytics guides to tracking ChatGPT usage and tracking Copilot utilization.

Worklytics tool inventory from a sample report: weekly active users, frequency, intensity, and trend for every AI tool in one table.
Tool-level counts tell you who is using AI. Task classification tells you what the AI is doing, which is the actual object of discovery. Worklytics automatically classifies AI activity metadata into work categories such as code generation, research and ideation, analysis and data work, summarization, content creation, email authoring, and workflow management, and rolls the classification into the Workplace Insights dashboards. The classification runs on metadata and activity signals rather than prompt text, so the task picture emerges without anyone reading employee conversations.
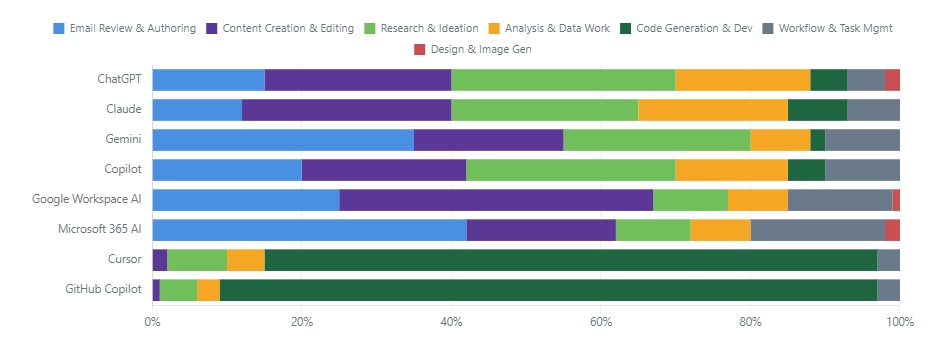
The distribution differs sharply by tool, and that difference is the finding. In the same representative deployment, Cursor and GitHub Copilot activity was almost entirely code generation, above 90% of classified activity, while ChatGPT activity spread across six categories with research and content creation leading. Microsoft 365 AI skewed toward email review and authoring. This means the question "are employees automating email" has a different answer per tool and per team, and only a cross-tool classification can total it up correctly.

Task-type mix by tool in a Worklytics sample report. Coding tools concentrate on one task while general assistants spread across six.
Averages across an organization conceal the operative fact that AI task automation is a departmental phenomenon. In first-hand Worklytics deployment data, Engineering ran an estimated 29% of its work activity with some form of AI assistance, Product reached 16.1%, Sales 14.9%, and Marketing 3.5%. A company-wide average of that distribution would read as moderate adoption and would mislead in both directions, overstating Marketing's automation and understating Engineering's dependence on it.
Segmentation also exposes the management layer behind adoption gaps. When two teams with identical tooling and comparable work show a threefold difference in AI-aided task share, the differentiator is usually local: a manager who models usage, a team norm, or a workflow that was redesigned around the tools. Worklytics connects these signals to its manager effectiveness scorecards so leaders can see which managers' teams are converting access into automation and which need targeted enablement, and the productivity analytics layer ties the same segments to output signals rather than leaving adoption as a vanity metric.

Non-usage by department in a Worklytics sample report. Sales, HR, and Finance show the largest untapped populations.
Two employees can both count as weekly active users while one runs a lookup once a week and the other automates half a workflow daily. Discovery has to distinguish them, because only the second represents real task automation. Worklytics plots frequency, measured in days per week using AI, against intensity, measured in uses per active day, which sorts every team into dabblers, occasional deep users, habit starters, and power users. Enablement responses differ per quadrant: dabblers need use cases, habit starters need depth, and power users need their workflows documented and shared.
Depth proxies sharpen the picture further. In one deployment's ChatGPT Enterprise data, messages per session climbed from 5.4 to 6.8 over 14 weeks, average prompt length grew from roughly 210 to 312 characters, and the share of sessions on advanced models rose 18 percentage points to 61%. Rising multi-turn depth and longer prompts indicate a shift from lookup behavior to genuine task delegation, and tracking those trends per team shows where automation habits are forming versus stalling. Organizations tracking Claude alongside ChatGPT can apply the same approach with the guide to tracking Claude Enterprise usage.

Frequency versus intensity quadrant from a Worklytics sample report. Engineering, IT, and Support operate as power users while Sales and HR remain dabblers.
Agents break the assumptions behind chat-based metrics. A chat interaction represents one employee performing one task with assistance, while an agent can execute hundreds of tasks per week after a single setup, so agent activity must be measured in actions taken rather than sessions opened. Worklytics tracks the number of unique agents in regular use per function and the volume of actions those agents execute, which is where the most surprising discovery findings tend to appear.
The clearest first-hand example: in one analyzed organization, Sales showed the lowest conversational AI adoption of any department yet its agents executed roughly 1,400 actions per week, more than triple Engineering's agent volume. Judged by chat metrics alone, Sales looked like a laggard. Judged by task automation, it was the most automated function in the company. Engineering organizations should apply the same separate lens to coding agents using the Worklytics guides to measuring Cursor usage and tracking Claude Code usage, since agentic coding sessions automate multi-step work that per-session counts undercount.

Agent actions per week by function in an illustrative Worklytics example. Sales automates at more than triple the volume of any other department.
The final step converts task discovery into impact measurement, because the business question behind "which tasks are automated" is always "what is that worth and what is left." Worklytics estimates hours saved per active user per task type by combining classified activity volume with time-saved models. In representative deployment data, code generation led at 4.2 hours saved per active user per week, analysis and data work followed at 3.8, meeting summaries delivered 2.1, and email authoring trailed at 0.7. That ranking should drive enablement priorities, since an hour invested in spreading analysis automation returns more than five times an hour spent promoting email drafting.
The same model quantifies the gap. The deployment above totaled roughly 1,240 hours saved per week, an annualized productivity value of $2.4M, while 68% of automatable work remained without AI assistance and 853 employees were not yet weekly users, an untapped value estimated at $5.2M per year. Framing discovery output as realized value against untapped value is what turns an adoption report into a board-level document. The free Worklytics AI ROI calculator applies the same logic to your own headcount and adoption figures.
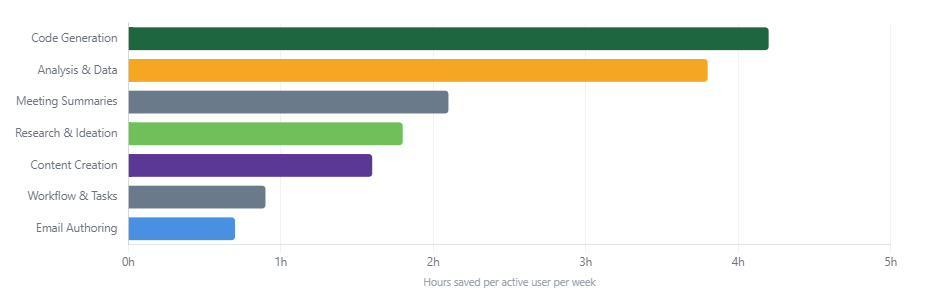
Hours saved per active user per week by task type in a Worklytics sample report. Code generation and analysis dominate realized value.
Internal numbers lack a reference point until they are compared externally. An organization at 22% total AI adoption cannot judge whether that figure is strong without knowing that peer organizations range from 4.1% at the tenth percentile to 67% at the ninetieth, which is the spread Worklytics observes across its benchmark dataset. Percentile placement changes decisions: a company at the fortieth percentile on overall adoption but the eighty-fifth on sales automation should protect its sales advantage and fund catch-up elsewhere, a conclusion that internal data alone could never produce.

Worklytics peer benchmarking across adoption, weekly usage, agents utilized, meeting AI, and sales AI, plotted from p10 to p90.
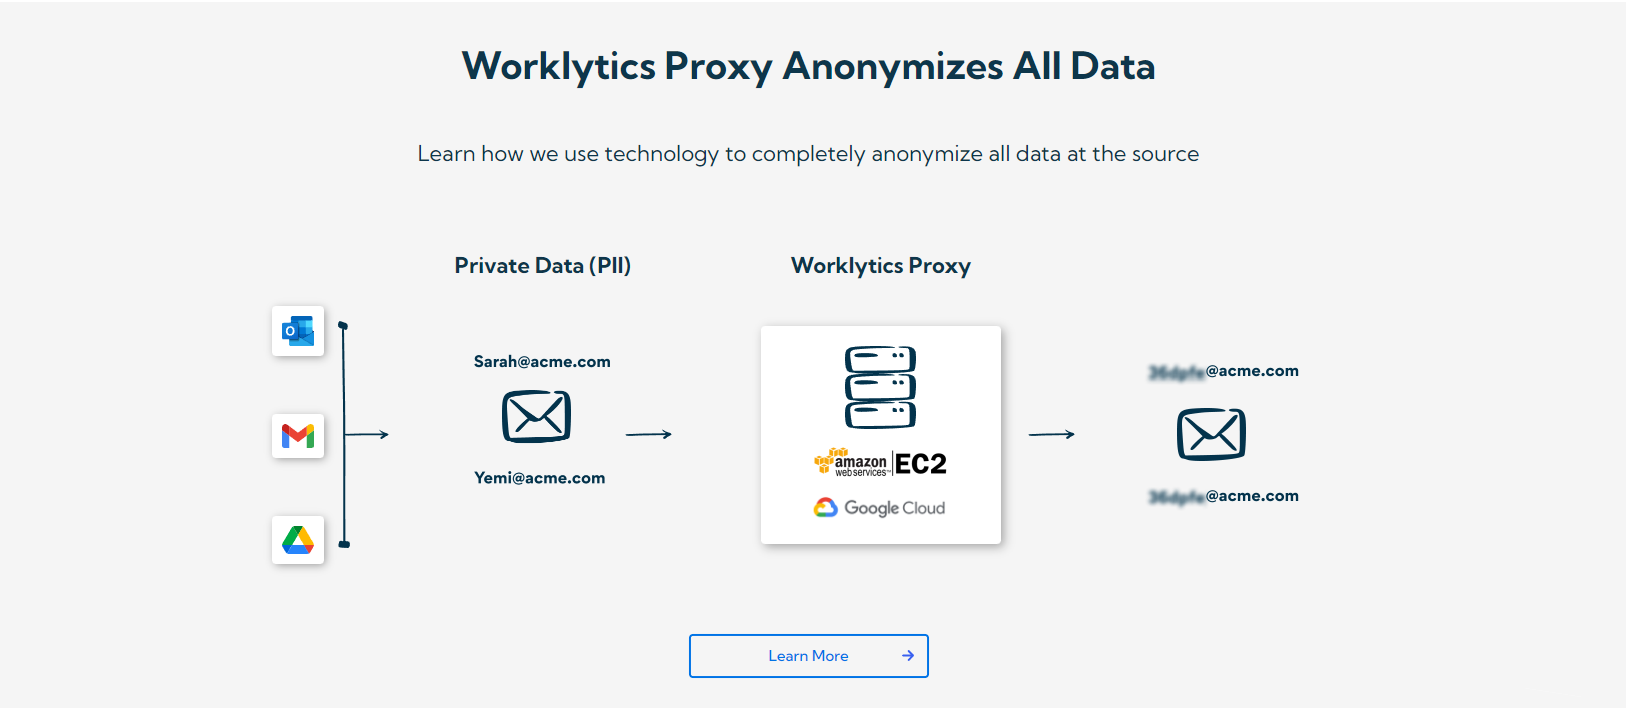
The discovery method determines whether the data stays reliable. Task mining tools that record screens or capture keystrokes create a surveillance dynamic, and employees who feel surveilled shift work to personal accounts and unsanctioned tools, which removes that activity from view and defeats the entire exercise. The durable approach analyzes usage metadata only: which tools were used, how often, by which teams at aggregate level, and what category of task the activity represents, never the content of prompts or outputs. Worklytics is built on this model, documented on its privacy approach page, with anonymized team-level aggregation as the default reporting layer. Privacy here is not a compliance concession, it is the mechanism that keeps sanctioned tools attractive enough that the usage data remains complete.
AI task automation discovery is the process of identifying which specific work tasks employees already perform with AI tools, which teams and roles the automation concentrates in, and how much time it saves. It relies on usage metadata from platforms like ChatGPT Enterprise, Copilot, Gemini, Claude, and coding assistants, classified into task categories such as code generation, analysis, summarization, and drafting.
Yes. Task classification works on metadata and activity signals: which tool was used, session frequency and depth, and the activity category the platform reports. Worklytics classifies AI activity into work categories using this metadata alone and reports at anonymized team level, so no individual prompt or output content is ever read.
Task mining records desktop activity to find tasks a company could automate in the future, and process mining reconstructs workflows from system event logs for the same purpose. AI task automation discovery looks at automation that already exists by analyzing how employees currently use AI tools, which makes it faster to deploy, less invasive, and focused on measuring real behavior rather than modeling hypothetical opportunities.
Code generation consistently leads in both volume and time saved, followed by analysis and data work, research, summarization, and content drafting. The Anthropic Economic Index finds usage concentrated in software development and technical writing tasks, and Worklytics deployment data mirrors this, with code generation saving 4.2 hours per active user per week against 0.7 hours for email authoring. The mix varies by department, which is why segment-level classification matters more than any general ranking.
Worklytics connects to Microsoft 365, Google Workspace, and other AI platforms through APIs, and most organizations see their first adoption and task metrics within a week of setup. Meaningful trend data, including depth trajectories and hours-saved estimates, builds over the following 30 days.