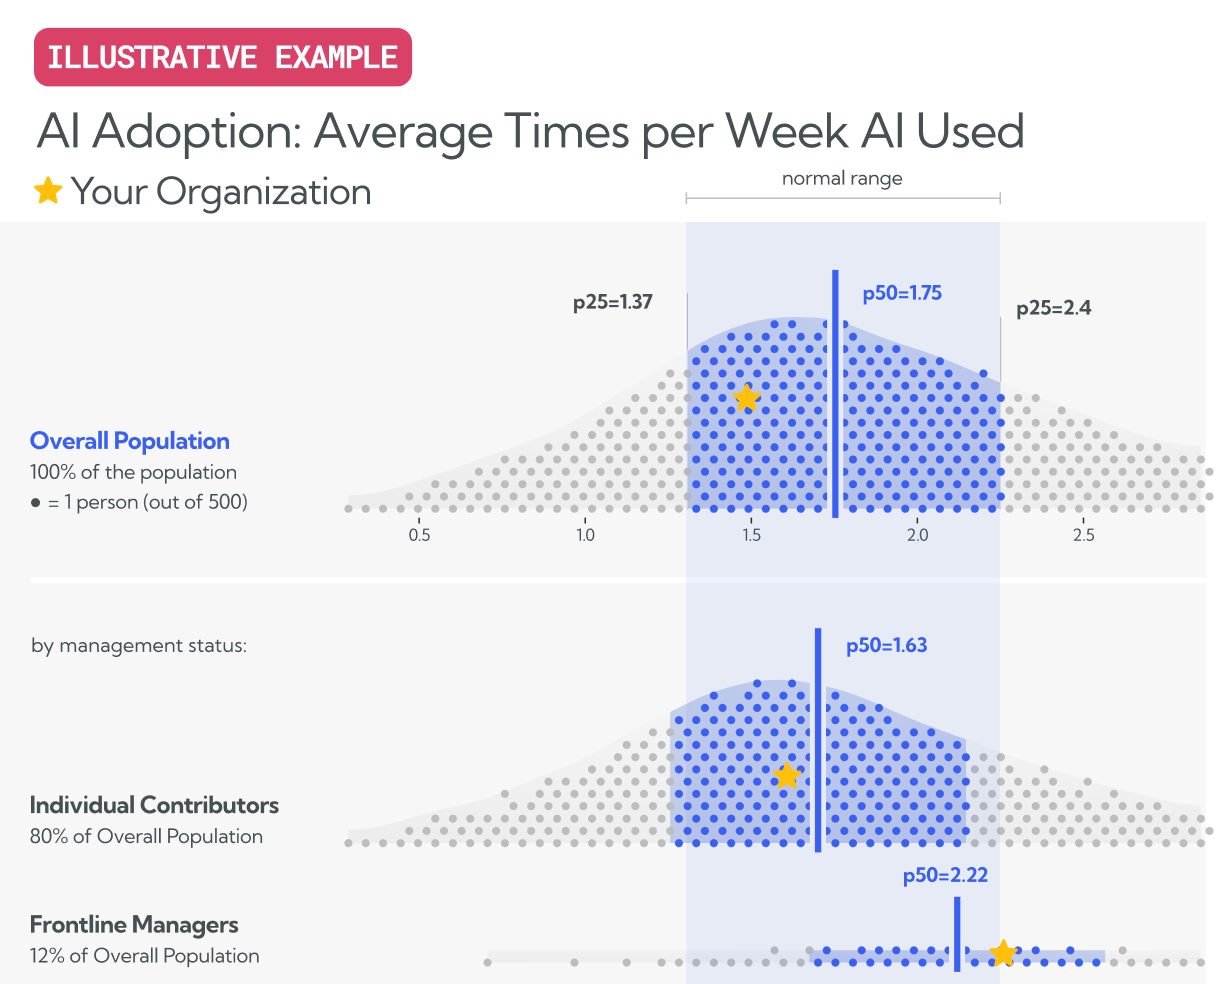
Executives are demanding proof. While nearly every company is experimenting with AI—over 95% of US firms report using generative AI—about 74% have yet to achieve tangible value from AI initiatives (Worklytics). The gap between adoption and results has created what many call "pilot purgatory," where organizations launch disjointed AI projects without a comprehensive strategy to measure meaningful returns.
The challenge isn't just implementation—it's measurement. Companies are beginning to see positive return on investment (ROI) from deployment of generative-AI powered platforms and tools (MIT Technology Review), but quantifying these benefits requires a structured approach that goes beyond simple adoption metrics.
This comprehensive guide combines insights from Google Cloud's enterprise survey data with practical frameworks from leading organizations to present a three-layer ROI measurement model: leading indicators, efficiency gains, and revenue impact. We'll show you exactly how to plug workplace analytics metrics—like meeting hours saved and collaboration improvements—into proven formulas that directly answer the executive question: "What's our ROI on generative AI?"
Despite widespread experimentation, most organizations struggle to translate AI adoption into measurable business value. Many companies lack a comprehensive AI strategy, resulting in disjointed projects that fail to deliver enterprise-wide impact (Worklytics). This disconnect stems from treating AI adoption as an IT experiment rather than a strategic initiative requiring systematic measurement.
The problem is compounded by a shortage of staff who know how to interpret AI outputs or integrate AI into workflows (Worklytics). Without proper measurement frameworks, organizations can't identify what's working, what's not, and where to focus their AI investments for maximum return.
Traditional ROI calculations—focused on direct cost savings and revenue increases—miss the nuanced benefits of generative AI. Future employee performance productivity measures will extend beyond current parameters to include aspects like quality, innovation, employee well-being, and ethical practices (Work Design). This evolution requires new measurement approaches that capture both quantitative efficiency gains and qualitative improvements in work quality and employee experience.
Generative AI has rapidly advanced beyond its early, human-like capacity to enhance chat functions, showing promise across a range of use cases including content creation, translation, image processing, and code writing (MIT Technology Review). These diverse applications require equally diverse measurement strategies.
The foundation of AI ROI measurement starts with adoption metrics that predict downstream value. High adoption metrics are necessary for achieving downstream benefits of AI tools (Worklytics). Without widespread adoption, even the most sophisticated AI tools cannot deliver enterprise-wide ROI.
Key Leading Indicators:
| Metric | Formula | Benchmark Target |
|---|---|---|
| Active User Rate | (Daily Active Users / Total Licensed Users) × 100 | >70% within 90 days |
| Feature Utilization | (Users Using Core Features / Total Active Users) × 100 | >60% for primary features |
| Time to First Value | Days from license to first meaningful use | <14 days |
| User Engagement Score | (Sessions per User × Average Session Duration) / 30 days | >5 meaningful sessions/month |
Many organizations segment usage by team, department, or role to uncover adoption gaps (Worklytics). This segmentation reveals which groups are driving value and which need additional support or training.
The second layer focuses on measurable efficiency improvements that directly impact productivity and cost reduction. This is where workplace analytics platforms like Worklytics provide crucial data points for ROI calculations.
Core Efficiency Metrics:
Meeting Time Optimization:
Email Response Efficiency:
Document Creation Speed:
The top layer captures direct revenue impact and strategic business outcomes that justify AI investments at the executive level.
Revenue-Focused Calculations:
Sales Productivity Enhancement:
Customer Service Efficiency:
Innovation Acceleration:
Worklytics provides the workplace analytics foundation needed to measure AI ROI accurately. By analyzing collaboration, calendar, communication, and system usage data—without relying on surveys—organizations can quantify the efficiency gains that drive ROI calculations (Worklytics).
Step 1: Baseline Measurement
Before implementing AI tools, establish baseline metrics using Worklytics data:
Step 2: Implementation Tracking
Monitor changes in workplace patterns as AI tools are deployed:
Step 3: ROI Calculation
Apply the three-layer model using Worklytics data:
Total AI ROI = (Efficiency Gains + Revenue Impact - Implementation Costs) / Implementation Costs × 100

Where:
Efficiency Gains = Σ(Time Saved × Hourly Rate × Employee Count)
Revenue Impact = Σ(Productivity Improvements × Revenue per Employee)
Implementation Costs = License Fees + Training + Integration + Management
Company Profile: 500-employee technology company implementing Microsoft 365 Copilot
Layer 1 - Leading Indicators (Month 3):
Layer 2 - Efficiency Gains (Month 6):
Calculation:
Meeting Time Savings: 2 hours × 500 employees × $75/hour × 52 weeks = $3,900,000
Email Efficiency: 0.5 hours × 500 employees × $75/hour × 52 weeks = $975,000
Document Creation: 1 hour × 500 employees × $75/hour × 52 weeks = $1,950,000

Total Efficiency Gains: $6,825,000
Implementation Costs: $1,200,000 (licenses + training + integration)

ROI = ($6,825,000 - $1,200,000) / $1,200,000 × 100 = 469%
Layer 3 - Revenue Impact (Month 12):
Additional revenue impact: $2,400,000
Total ROI: 685%
Different industries see varying ROI timelines and magnitudes based on their AI use cases and implementation approaches.
Technology Sector:
Financial Services:
Healthcare:
Manufacturing:
Organizations are increasingly integrating generative AI to boost productivity, innovation, and competitive advantage, but common challenges can derail ROI realization (LinkedIn):
Resistance to Change:
One recent survey on generative AI adoption revealed that 31% of employees—especially younger staff—admitted to sabotaging their company's AI efforts (Worklytics). This resistance can significantly impact ROI calculations by reducing adoption rates and effectiveness.
Inadequate Training:
Many companies are launching internal AI academies or partnering with online education platforms to teach employees data science, AI tools, or prompt engineering for generative AI (Worklytics). Without proper training, even the most sophisticated AI tools fail to deliver expected returns.
Privacy and Compliance Concerns:
Transparency in the use of data, ethical consent, and the protection of employee privacy will become imperative to maintain trust and balance the benefits and risks associated with AI in the workplace (Work Design). Organizations must factor compliance costs into their ROI calculations.
Hybrid work has changed the shape of the workday, elongating the span of the day but also changing the intensity of work (Worklytics). This shift requires new approaches to measuring AI ROI that account for distributed work patterns.
Workday Intensity Metrics:
Workday intensity is measured as time spent on digital work as a percentage of the overall workday span (Worklytics). AI tools that help maintain productivity during extended work spans can deliver significant ROI in hybrid environments.
Collaboration Efficiency:
With over 58% of the workforce now engaging in remote work, measuring collaboration efficiency becomes crucial for ROI calculations (Worklytics). AI tools that improve virtual collaboration can deliver measurable returns through reduced meeting fatigue and improved decision-making speed.
Artificial Intelligence will play a crucial role in advancing and refining performance metrics, offering deeper analytics for efficiency (Work Design). Organizations can use AI itself to predict and optimize ROI from AI investments.
Leading Indicator Prediction:
Use historical adoption patterns to predict future ROI realization:
Predicted ROI = (Current Adoption Rate × Historical ROI per Adoption Point) + (Projected Efficiency Gains × Time Factor)
Risk-Adjusted ROI:
Account for implementation risks and change management challenges:
Risk-Adjusted ROI = (Expected ROI × Success Probability) - (Implementation Costs × Risk Factor)
Establish Baseline Metrics:
Start with an AI game plan and treat AI adoption as a strategic initiative, not just an IT experiment (Worklytics). Use workplace analytics to establish comprehensive baselines across all three measurement layers.
Key Actions:
Track Leading Indicators:
Focus on adoption metrics that predict downstream value. Companies large and small face a stark choice: adopt AI to drive innovation and efficiency or risk stagnation and obsolescence (Worklytics).
Key Actions:
Quantify Productivity Gains:
Lead with empathy, transparency, and involvement when measuring efficiency improvements (Worklytics). Focus on metrics that demonstrate clear value to both employees and executives.
Key Actions:
Measure Business Outcomes:
Worklytics can boost AI adoption in your organization by providing the measurement framework needed to demonstrate clear business value (Worklytics).
Key Actions:
Create executive-friendly dashboards that tell the complete ROI story across all three measurement layers. A recent LinkedIn survey found that 7 in 10 executives worldwide say the pace of change at work is accelerating, making clear ROI communication essential (Worklytics).
Dashboard Components:
| Layer | Key Metrics | Visualization | Update Frequency |
|---|---|---|---|
| Leading Indicators | Adoption Rate, Feature Usage | Progress bars, trend lines | Weekly |
| Efficiency Gains | Time saved, Process improvements | Bar charts, heat maps | Monthly |
| Revenue Impact | ROI percentage, Dollar impact | Waterfall charts, scorecards | Quarterly |
For C-Suite:
For Department Heads:
For Employees:
In 2025, AI is as ubiquitous as the internet, embedded in the software we use daily (Worklytics). As AI capabilities expand, ROI measurement must evolve to capture new value dimensions.
Emerging Measurement Areas:
Today's AI can draft documents, write code, design marketing content, answer customer queries, and discover patterns in big data—often in seconds (Worklytics). As capabilities expand, measurement frameworks must adapt.
Quarterly Review Process:
Measuring ROI of generative AI requires a sophisticated, multi-layered approach that goes beyond simple cost-benefit calculations. The three-layer model—leading indicators, efficiency gains, and revenue impact—provides a comprehensive framework for quantifying AI value across different time horizons and business dimensions.
Nearly all organizations are experimenting with AI in some form, yet only a tiny fraction can claim it's fully integrated into their operations (Worklytics). The organizations that succeed in demonstrating clear ROI will be those that implement systematic measurement from day one, using workplace analytics platforms to capture the granular data needed for accurate calculations.
The key to success lies in treating AI ROI measurement as an ongoing strategic capability rather than a one-time assessment. By combining leading indicators that predict success, efficiency metrics that quantify improvements, and revenue calculations that demonstrate business impact, organizations can build compelling cases for continued AI investment while optimizing their implementations for maximum return.
As the pace of AI advancement accelerates, the organizations that master ROI measurement will be best positioned to make informed decisions about where to invest, how to scale, and when to pivot their AI strategies for sustained competitive advantage.
The three-layer framework combines leading indicators (adoption metrics, user engagement), efficiency gains (time savings, productivity improvements), and revenue impact (cost reduction, revenue generation). This comprehensive approach helps organizations move beyond basic usage metrics to measure tangible business value from AI investments.
According to Worklytics research, while 95% of US firms report using generative AI, most remain stuck in "pilot purgatory" due to lack of proper measurement frameworks. Companies often focus only on adoption metrics without tracking efficiency gains or revenue impact, making it difficult to prove ROI and scale successful initiatives.
Workplace analytics platforms like Worklytics can track AI tool usage patterns, measure productivity improvements, and identify adoption gaps across teams and departments. By analyzing digital work patterns and collaboration metrics, organizations can quantify the efficiency gains from AI tools like GitHub Copilot and other generative AI platforms.
Key leading indicators include user adoption rates, frequency of AI tool usage, feature utilization depth, and user engagement scores. High adoption metrics are necessary for achieving downstream benefits, and many organizations segment usage by team, department, or role to uncover adoption gaps and optimize deployment strategies.
Efficiency gains are calculated by measuring time savings per task, productivity improvements, and quality metrics before and after AI implementation. The formula typically involves comparing baseline performance metrics with post-implementation results, factoring in variables like task completion time, error rates, and output quality.
Based on survey data from 2,500+ leaders, successful AI implementations typically show 20-40% time savings in targeted tasks, 15-25% productivity improvements, and positive ROI within 6-12 months. However, benchmarks vary significantly by industry, use case, and implementation approach, making it crucial to establish baseline metrics specific to your organization.