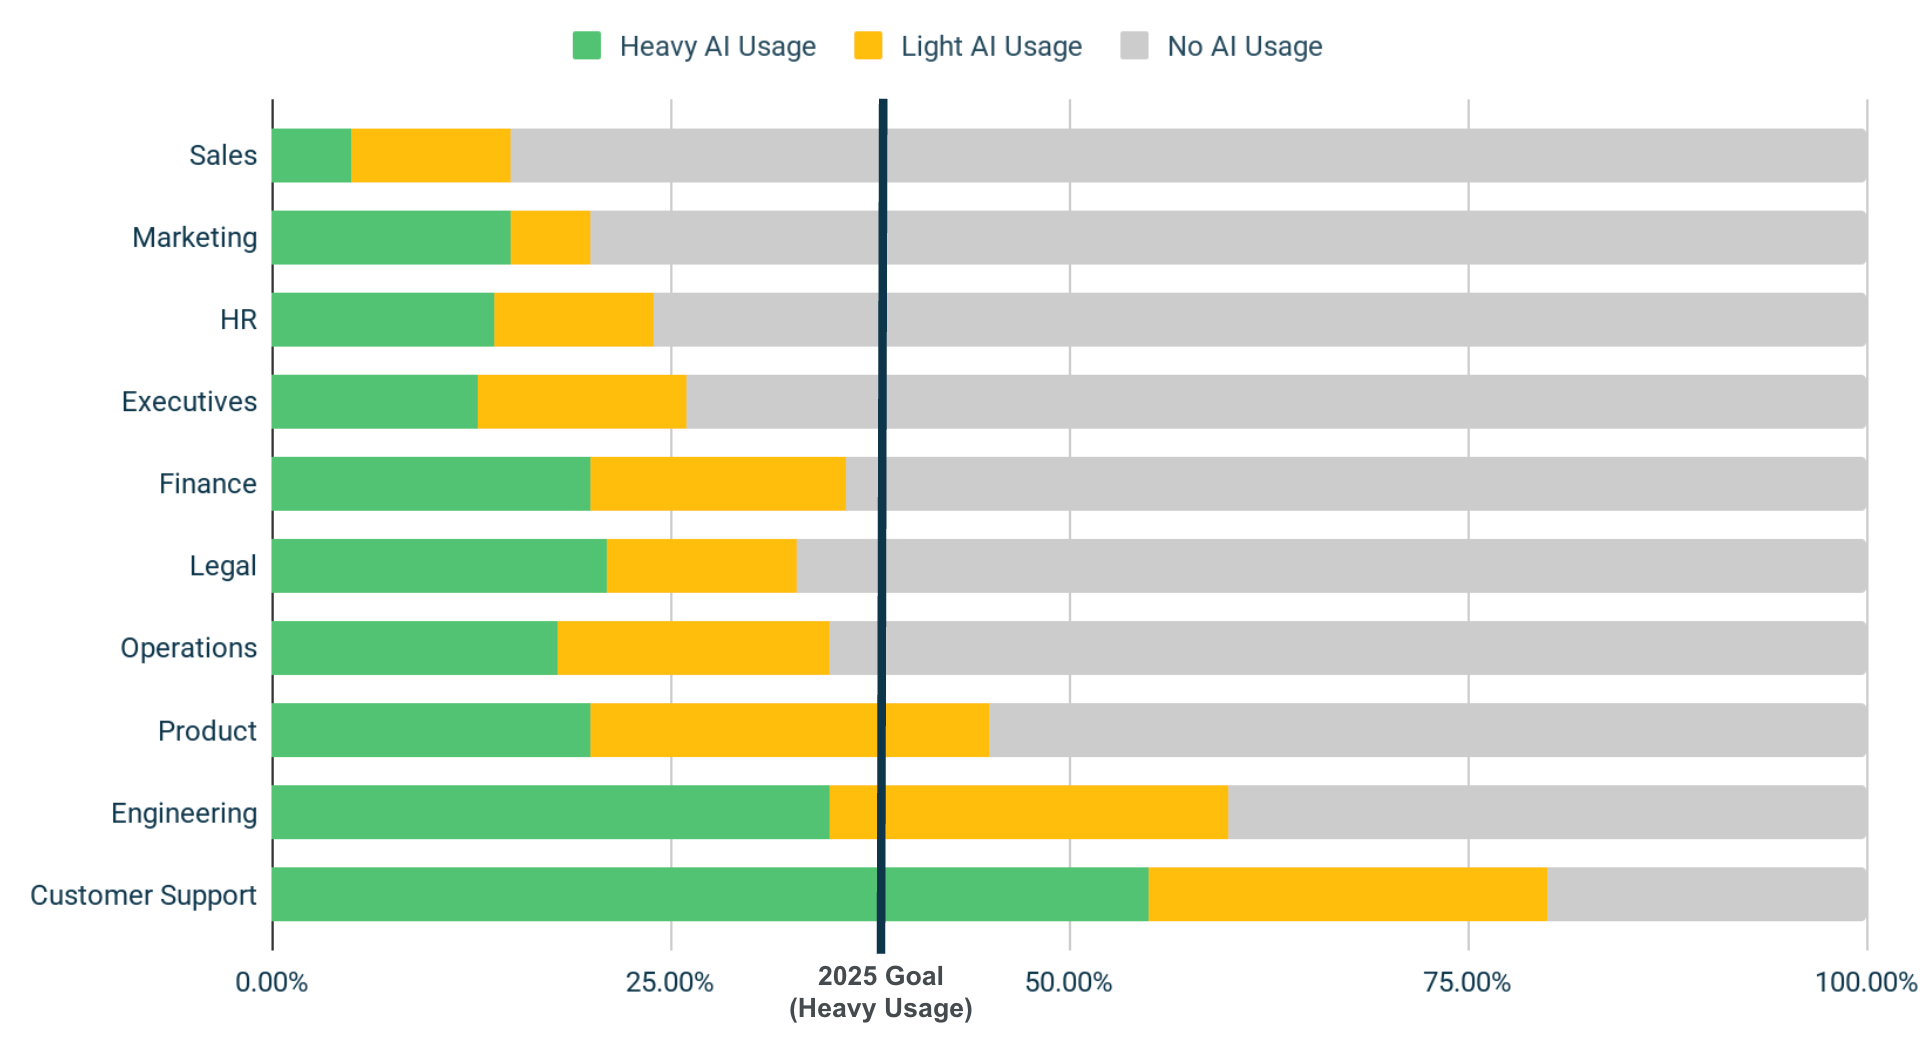
As AI tools like Microsoft Copilot become mission-critical for enterprise productivity, IT administrators need comprehensive visibility into adoption patterns, usage trends, and performance metrics. (Worklytics) The challenge isn't just deploying AI tools—it's ensuring they deliver measurable value and maintaining momentum after the initial rollout excitement fades.
Microsoft's Graph API now provides detailed Copilot usage endpoints that can feed real-time adoption data into analytics platforms like Worklytics. (Microsoft 365 Admin) This integration creates a powerful feedback loop: track which teams are embracing AI, identify usage patterns that correlate with productivity gains, and configure automated alerts when adoption metrics drop below target thresholds.
This guide walks enterprise IT administrators through the complete process—from API authentication and data extraction to Power BI transformation and Worklytics integration. (Worklytics) By the end, you'll have a working pipeline that delivers actionable AI adoption insights in less than a day.
Microsoft Graph provides several endpoints for Copilot usage analytics, each serving different monitoring needs. (Microsoft 365 Admin) The primary endpoints include:
Successful AI adoption measurement requires focusing on metrics that correlate with business outcomes rather than vanity statistics. (Worklytics) Essential metrics include:
Adoption Metrics:
Engagement Depth:
Business Impact Indicators:
High adoption metrics provide the necessary foundation for achieving downstream benefits, as teams become more proficient with AI tools over time. (Worklytics)
Before accessing Copilot usage data, you'll need to configure appropriate Microsoft Graph permissions. The following permissions are essential:
# Required Graph API Permissions
Reports.Read.All
Reports.ReadWrite.All
User.Read.All
Directory.Read.All
Create a new Azure AD application registration with the following configuration:
Install the required PowerShell modules for Microsoft Graph integration:
# Install Microsoft Graph PowerShell SDK
Install-Module Microsoft.Graph -Scope CurrentUser -Force

# Install additional modules for data processing
Install-Module ImportExcel -Scope CurrentUser -Force
Install-Module PSWriteHTML -Scope CurrentUser -Force
Establish a secure connection to Microsoft Graph using your application credentials:
# Define connection parameters
$TenantId = "your-tenant-id"
$ClientId = "your-app-client-id"
$ClientSecret = "your-client-secret"

# Create credential object
$SecureSecret = ConvertTo-SecureString $ClientSecret -AsPlainText -Force
$Credential = New-Object System.Management.Automation.PSCredential($ClientId, $SecureSecret)

# Connect to Microsoft Graph
Connect-MgGraph -TenantId $TenantId -ClientSecretCredential $Credential
Retrieve Copilot usage metrics using Microsoft Graph endpoints. (Microsoft 365 Admin) The following script demonstrates data extraction:
# Function to get Copilot usage summary
function Get-CopilotUsageSummary {
    param(
        [Parameter(Mandatory=$true)]
        [string]$Period = "D30",  # Last 30 days
        [string]$OutputPath = "./copilot-usage.csv"
    )

    try {
        # Get usage summary data
        $UsageData = Invoke-MgGraphRequest -Method GET -Uri "https://graph.microsoft.com/v1.0/reports/getM365CopilotUsageUserDetail(period='$Period')"

        # Process and export data
        $ProcessedData = $UsageData.value | ForEach-Object {
            [PSCustomObject]@{
                UserPrincipalName = $_.userPrincipalName
                DisplayName = $_.displayName
                LastActivityDate = $_.lastActivityDate
                CopilotActionsCount = $_.copilotActionsCount
                WordActionsCount = $_.wordActionsCount
                ExcelActionsCount = $_.excelActionsCount
                PowerPointActionsCount = $_.powerPointActionsCount
                TeamsActionsCount = $_.teamsActionsCount
                OutlookActionsCount = $_.outlookActionsCount
                IsActive = $_.copilotActionsCount -gt 0
                ExtractDate = Get-Date -Format "yyyy-MM-dd"
            }
        }

        # Export to CSV
        $ProcessedData | Export-Csv -Path $OutputPath -NoTypeInformation
        Write-Host "Usage data exported to: $OutputPath"

        return $ProcessedData
    }
    catch {
        Write-Error "Failed to retrieve Copilot usage data: $($_.Exception.Message)"
    }
}

# Execute data extraction
$CopilotData = Get-CopilotUsageSummary -Period "D30"
For deeper insights, query application-specific usage patterns:
# Function to get detailed application usage
function Get-CopilotApplicationUsage {
    param(
        [string]$ApplicationFilter = "All",
        [int]$DaysBack = 30
    )

    $StartDate = (Get-Date).AddDays(-$DaysBack).ToString("yyyy-MM-dd")
    $EndDate = (Get-Date).ToString("yyyy-MM-dd")

    # Query application-specific metrics
    $AppUsageUri = "https://graph.microsoft.com/v1.0/reports/getM365CopilotUsageUserDetail(period='D$DaysBack')"
    $AppUsageData = Invoke-MgGraphRequest -Method GET -Uri $AppUsageUri

    # Calculate application adoption rates
    $AppMetrics = $AppUsageData.value | Group-Object userPrincipalName | ForEach-Object {
        $UserData = $_.Group[0]
        [PSCustomObject]@{
            User = $UserData.userPrincipalName
            TotalActions = $UserData.copilotActionsCount
            WordUsage = [math]::Round(($UserData.wordActionsCount / [math]::Max($UserData.copilotActionsCount, 1)) * 100, 2)
            ExcelUsage = [math]::Round(($UserData.excelActionsCount / [math]::Max($UserData.copilotActionsCount, 1)) * 100, 2)
            PowerPointUsage = [math]::Round(($UserData.powerPointActionsCount / [math]::Max($UserData.copilotActionsCount, 1)) * 100, 2)
            TeamsUsage = [math]::Round(($UserData.teamsActionsCount / [math]::Max($UserData.copilotActionsCount, 1)) * 100, 2)
            OutlookUsage = [math]::Round(($UserData.outlookActionsCount / [math]::Max($UserData.copilotActionsCount, 1)) * 100, 2)
        }
    }

    return $AppMetrics
}
Power BI serves as the transformation layer between raw Microsoft Graph data and Worklytics' privacy-preserving schema. (Power BI Workout Wednesday) Create a new Power BI report and establish data connections:
Transform the raw usage data to align with Worklytics' expected format:
// Create calculated columns for adoption metrics
Adoption_Status =
IF(
    [CopilotActionsCount] > 0,
    "Active",
    IF(
        [LastActivityDate] <> BLANK(),
        "Inactive",
        "Never_Used"
    )
)

// Calculate engagement intensity
Engagement_Score =
SWITCH(
    TRUE(),
    [CopilotActionsCount] >= 50, "High",
    [CopilotActionsCount] >= 10, "Medium",
    [CopilotActionsCount] > 0, "Low",
    "None"
)

// Application diversity metric
App_Diversity =
(
    IF([WordActionsCount] > 0, 1, 0) +
    IF([ExcelActionsCount] > 0, 1, 0) +
    IF([PowerPointActionsCount] > 0, 1, 0) +
    IF([TeamsActionsCount] > 0, 1, 0) +
    IF([OutlookActionsCount] > 0, 1, 0)
)
Worklytics emphasizes privacy-preserving analytics, so transform personal identifiers into anonymized tokens. (Worklytics) Use Power BI's data transformation capabilities:
// Create anonymized user identifiers
Anonymized_User_ID =
HASHBYTES("SHA256", [UserPrincipalName] & "your-salt-key")

// Department-level aggregation
Department_Metrics =
SUMMARIZE(
    CopilotUsage,
    [Department],
    "Active_Users", COUNTROWS(FILTER(CopilotUsage, [Adoption_Status] = "Active")),
    "Total_Actions", SUM([CopilotActionsCount]),
    "Avg_Engagement", AVERAGE([CopilotActionsCount])
)
Develop department and team-level metrics that provide insights without exposing individual user data:
| Metric Category | Calculation | Business Value |
|---|---|---|
| Adoption Rate | Active Users / Total Licensed Users | Overall penetration |
| Engagement Depth | Average Actions per Active User | Usage intensity |
| Feature Breadth | Applications Used / Total Applications | Tool utilization |
| Retention Rate | Users Active in Current vs Previous Period | Sustained adoption |
| Growth Velocity | Week-over-week adoption change | Momentum tracking |
Worklytics processes workplace data through a privacy-preserving schema that aggregates individual activities into team and organizational insights. (Worklytics) The platform expects data in specific formats that maintain anonymity while enabling meaningful analysis.
Transform your Power BI output to match Worklytics' expected data structure. (CLK Hash Schema) The following mapping ensures compatibility:
{
  "user_id": "anonymized_hash",
  "date": "2025-01-15",
  "activity_type": "ai_tool_usage",
  "application": "microsoft_copilot",
  "action_count": 25,
  "session_duration": 45,
  "feature_usage": {
    "word": 8,
    "excel": 5,
    "powerpoint": 3,
    "teams": 6,
    "outlook": 3
  },
  "engagement_level": "medium",
  "department": "engineering",
  "team_id": "team_alpha_hash"
}
Configure Power BI to export transformed data in Worklytics-compatible format:
// Create final export table
Worklytics_Export =
ADDCOLUMNS(
    SUMMARIZE(
        CopilotUsage,
        [Anonymized_User_ID],
        [Date],
        [Department]
    ),
    "activity_type", "ai_tool_usage",
    "application", "microsoft_copilot",
    "total_actions", CALCULATE(SUM([CopilotActionsCount])),
    "engagement_level", CALCULATE(MAX([Engagement_Score])),
    "app_diversity", CALCULATE(MAX([App_Diversity]))
)
Establish an automated pipeline that refreshes data daily and pushes updates to Worklytics:
# Automated refresh script
function Update-WorklyticsData {
    param(
        [string]$PowerBIWorkspaceId,
        [string]$DatasetId,
        [string]$WorklyticsEndpoint
    )

    try {
        # Refresh Power BI dataset
        Invoke-PowerBIRestMethod -Url "groups/$PowerBIWorkspaceId/datasets/$DatasetId/refreshes" -Method Post

        # Wait for refresh completion
        do {
            Start-Sleep -Seconds 30
            $RefreshStatus = Invoke-PowerBIRestMethod -Url "groups/$PowerBIWorkspaceId/datasets/$DatasetId/refreshes" -Method Get
            $LatestRefresh = ($RefreshStatus | ConvertFrom-Json).value[0]
        } while ($LatestRefresh.status -eq "InProgress")

        if ($LatestRefresh.status -eq "Completed") {
            # Export data for Worklytics
            $ExportedData = Export-PowerBIData -WorkspaceId $PowerBIWorkspaceId -DatasetId $DatasetId

            # Send to Worklytics
            Send-WorklyticsData -Data $ExportedData -Endpoint $WorklyticsEndpoint

            Write-Host "Data successfully updated in Worklytics"
        } else {
            Write-Error "Power BI refresh failed: $($LatestRefresh.serviceExceptionJson)"
        }
    }
    catch {
        Write-Error "Pipeline update failed: $($_.Exception.Message)"
    }
}
Worklytics enables automated alerts when AI adoption metrics fall below target thresholds. (Workforce Alerts) Configure alerts based on your organization's adoption goals:
Critical Alert Thresholds:
Set up custom alerts using Worklytics' notification system. (Workday Alerts) The platform supports various alert types:
# Example alert configuration
alerts:
  - name: "Copilot Adoption Drop"
    metric: "daily_active_users_percentage"
    threshold: 70
    comparison: "less_than"
    frequency: "daily"
    recipients: ["it-admin@company.com", "ai-adoption-team@company.com"]

  - name: "Engagement Decline"
    metric: "weekly_actions_change"
    threshold: -20
    comparison: "less_than"
    frequency: "weekly"
    escalation: true

  - name: "Department Lagging"
    metric: "department_adoption_rate"
    threshold: "org_average_minus_10"
    comparison: "relative"
    frequency: "weekly"
Implement sophisticated alert logic that considers context and trends rather than simple threshold breaches:
// Smart alert calculation
Alert_Trigger =
VAR CurrentAdoption = [Current_Adoption_Rate]
VAR PreviousAdoption = [Previous_Period_Adoption_Rate]
VAR AdoptionTrend = DIVIDE(CurrentAdoption - PreviousAdoption, PreviousAdoption)
VAR OrganizationalAverage = [Org_Average_Adoption]

RETURN
SWITCH(
    TRUE(),
    CurrentAdoption < 0.5, "CRITICAL: Adoption below 50%",
    AdoptionTrend < -0.15, "WARNING: 15%+ decline detected",
    CurrentAdoption < OrganizationalAverage * 0.8, "INFO: Below org average",
    "OK"
)
Connect alerts to your organization's communication tools for immediate visibility:
# Teams webhook integration
function Send-TeamsAlert {
    param(
        [string]$WebhookUrl,
        [string]$AlertMessage,
        [hashtable]$MetricData
    )

    $TeamsMessage = @{
        "@type" = "MessageCard"
        "@context" = "https://schema.org/extensions"
        "summary" = "Copilot Adoption Alert"
        "themeColor" = "FF6B35"
        "sections" = @(
            @{
                "activityTitle" = "AI Adoption Alert"
                "activitySubtitle" = $AlertMessage
                "facts" = @(
                    @{ "name" = "Current Adoption Rate"; "value" = "$($MetricData.AdoptionRate)%" },
                    @{ "name" = "Active Users"; "value" = $MetricData.ActiveUsers },
                    @{ "name" = "Trend"; "value" = $MetricData.Trend }
                )
            }
        )
    }

    Invoke-RestMethod -Uri $WebhookUrl -Method Post -Body ($TeamsMessage | ConvertTo-Json -Depth 10) -ContentType "application/json"
}
Create a comprehensive dashboard that provides multiple perspectives on AI adoption. (Worklytics) The dashboard should include:
Executive Summary View:
Operational Metrics:
Detailed Analytics:
Track metrics that correlate with business value rather than vanity statistics. (Worklytics) Essential KPIs include:
| KPI Category | Metric | Target | Business Impact |
|---|---|---|---|
| Adoption | Licensed users actively using Copilot | >80% | License ROI |
| Engagement | Average actions per user per week | >25 | Productivity correlation |
| Retention | Users active in consecutive weeks | >90% | Sustained value |
| Breadth | Applications used per user | >3 | Tool integration |
| Growth | New user activation rate | >95% | Onboarding effectiveness |
Implement real-time monitoring capabilities that provide immediate insights into adoption patterns. (Worklytics) This enables proactive intervention when adoption metrics decline.
Microsoft Copilot Usage APIs provide detailed analytics on how employees interact with AI tools across Microsoft 365 applications. These APIs track adoption patterns, usage trends, and performance metrics, enabling IT administrators to measure the ROI of AI investments and optimize deployment strategies for maximum productivity impact.
Worklytics transforms raw Copilot usage data into actionable insights by measuring the journey from adoption to efficiency. The platform tracks not just who uses Copilot, but how it impacts productivity, collaboration patterns, and work-life balance, providing a comprehensive view of AI tool effectiveness across the organization.
The Microsoft 365 Copilot agent usage report shows adoption of custom agents built through Microsoft Copilot Studio or Teams Toolkit. The report becomes available within 72 hours of the end of a given day and provides insights into how employees are utilizing organization-specific AI agents and workflows.
Worklytics enables ROI measurement by connecting Copilot usage data with productivity metrics like meeting efficiency, collaboration patterns, and workday intensity. Organizations can track how AI adoption translates into measurable business outcomes, similar to how they measure GitHub Copilot's impact on development productivity and code quality.
A comprehensive AI adoption dashboard provides visibility into usage patterns, identifies power users and laggards, tracks feature adoption rates, and correlates AI usage with productivity outcomes. This holistic view enables data-driven decisions about training programs, license optimization, and strategic AI deployment across different teams and departments.
Hybrid work has changed workday patterns, elongating the span while decreasing intensity, which affects how employees interact with AI tools. Worklytics measures workday intensity as time spent on digital work as a percentage of overall workday span, helping organizations understand how AI tools like Copilot fit into modern work patterns and productivity cycles.