


Executives face a critical challenge in 2025: justifying the budget for AI monitoring tools when nearly every company is experimenting with AI, yet over 95% of US firms report using generative AI without achieving tangible value. (Worklytics) The gap between AI investment and measurable returns has created what many call "pilot purgatory" - a state where companies launch disjointed AI projects without a comprehensive strategy to measure their impact. (Worklytics)
The solution lies in building a robust ROI framework that transforms AI usage tracking from a cost center into a strategic investment. Organizations are almost six times as likely to receive significant financial benefits from AI when their workers personally derive value from it. (Deloitte) This comprehensive guide synthesizes insights from leading research and real-world calculators to build a three-tier ROI model: efficiency gains, quality uplift, and revenue acceleration.
AI adoption in companies surged to 72% in 2024, up from 55% in 2023, yet measuring which department is using AI, how often, what AI agents, and with what impact remains crucial to bridge the gap between lofty promises and tangible outcomes. (Worklytics) The challenge isn't just adoption - it's proving value.
Consider these telling statistics from recent workplace studies:
• About 74% of companies have yet to achieve tangible value from AI initiatives (Worklytics)
• GitHub Copilot has seen rapid adoption with over 1.3 million developers on paid plans and over 50,000 organizations issuing licenses in under two years (Worklytics)
• Microsoft has identified an "11-week tipping point" where AI tools become a significant factor in job choice for early-in-career employees (Microsoft)
The disconnect between adoption metrics and business value has left executives struggling to justify monitoring budgets. Traditional ROI calculations fall short because they focus on tool costs rather than usage patterns and their downstream effects on productivity, quality, and revenue.
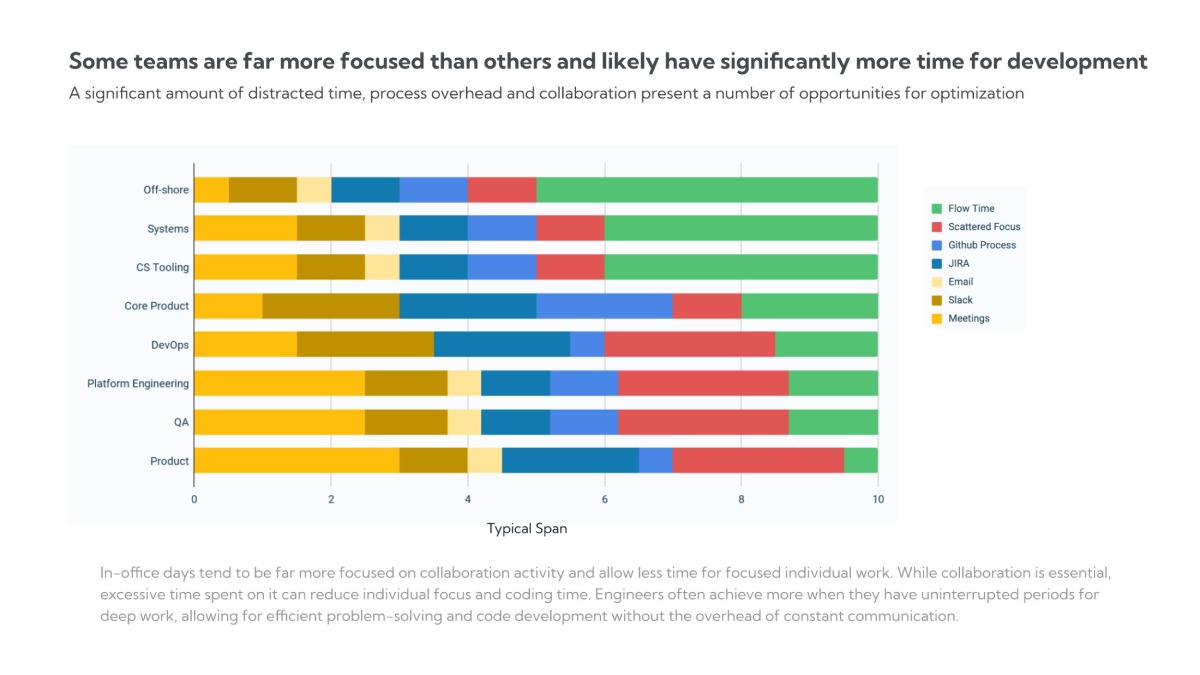
Efficiency gains represent the most immediate and measurable ROI from AI usage tracking. These gains manifest in three primary areas:
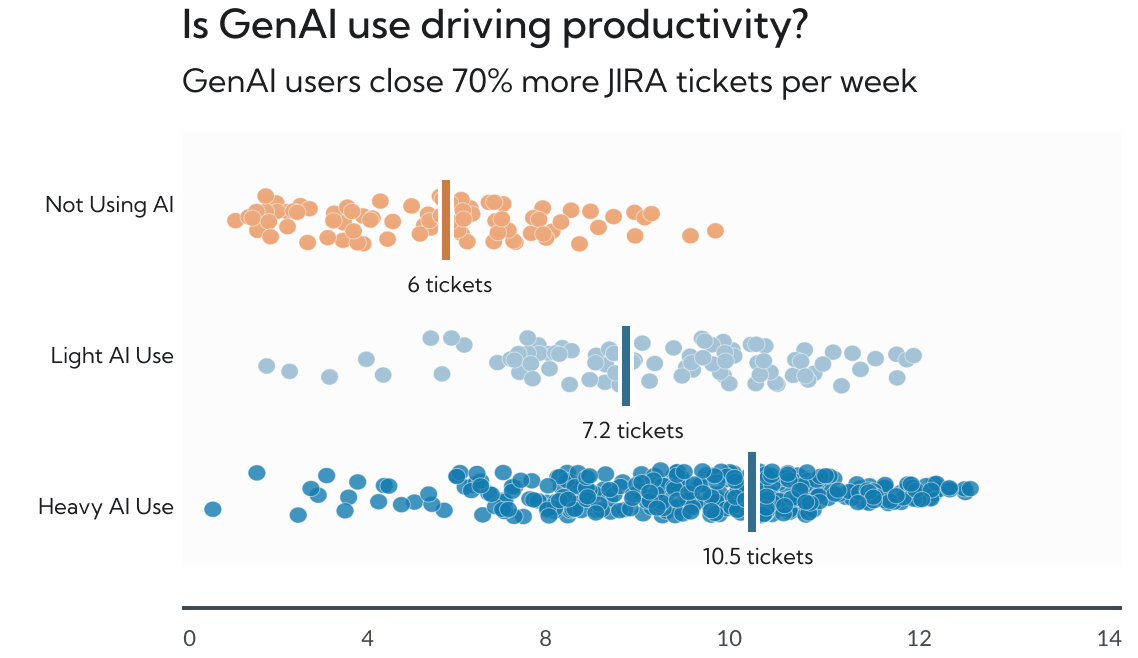
High adoption metrics are necessary for achieving downstream benefits of AI tools like GitHub Copilot. (
Key metrics to track:
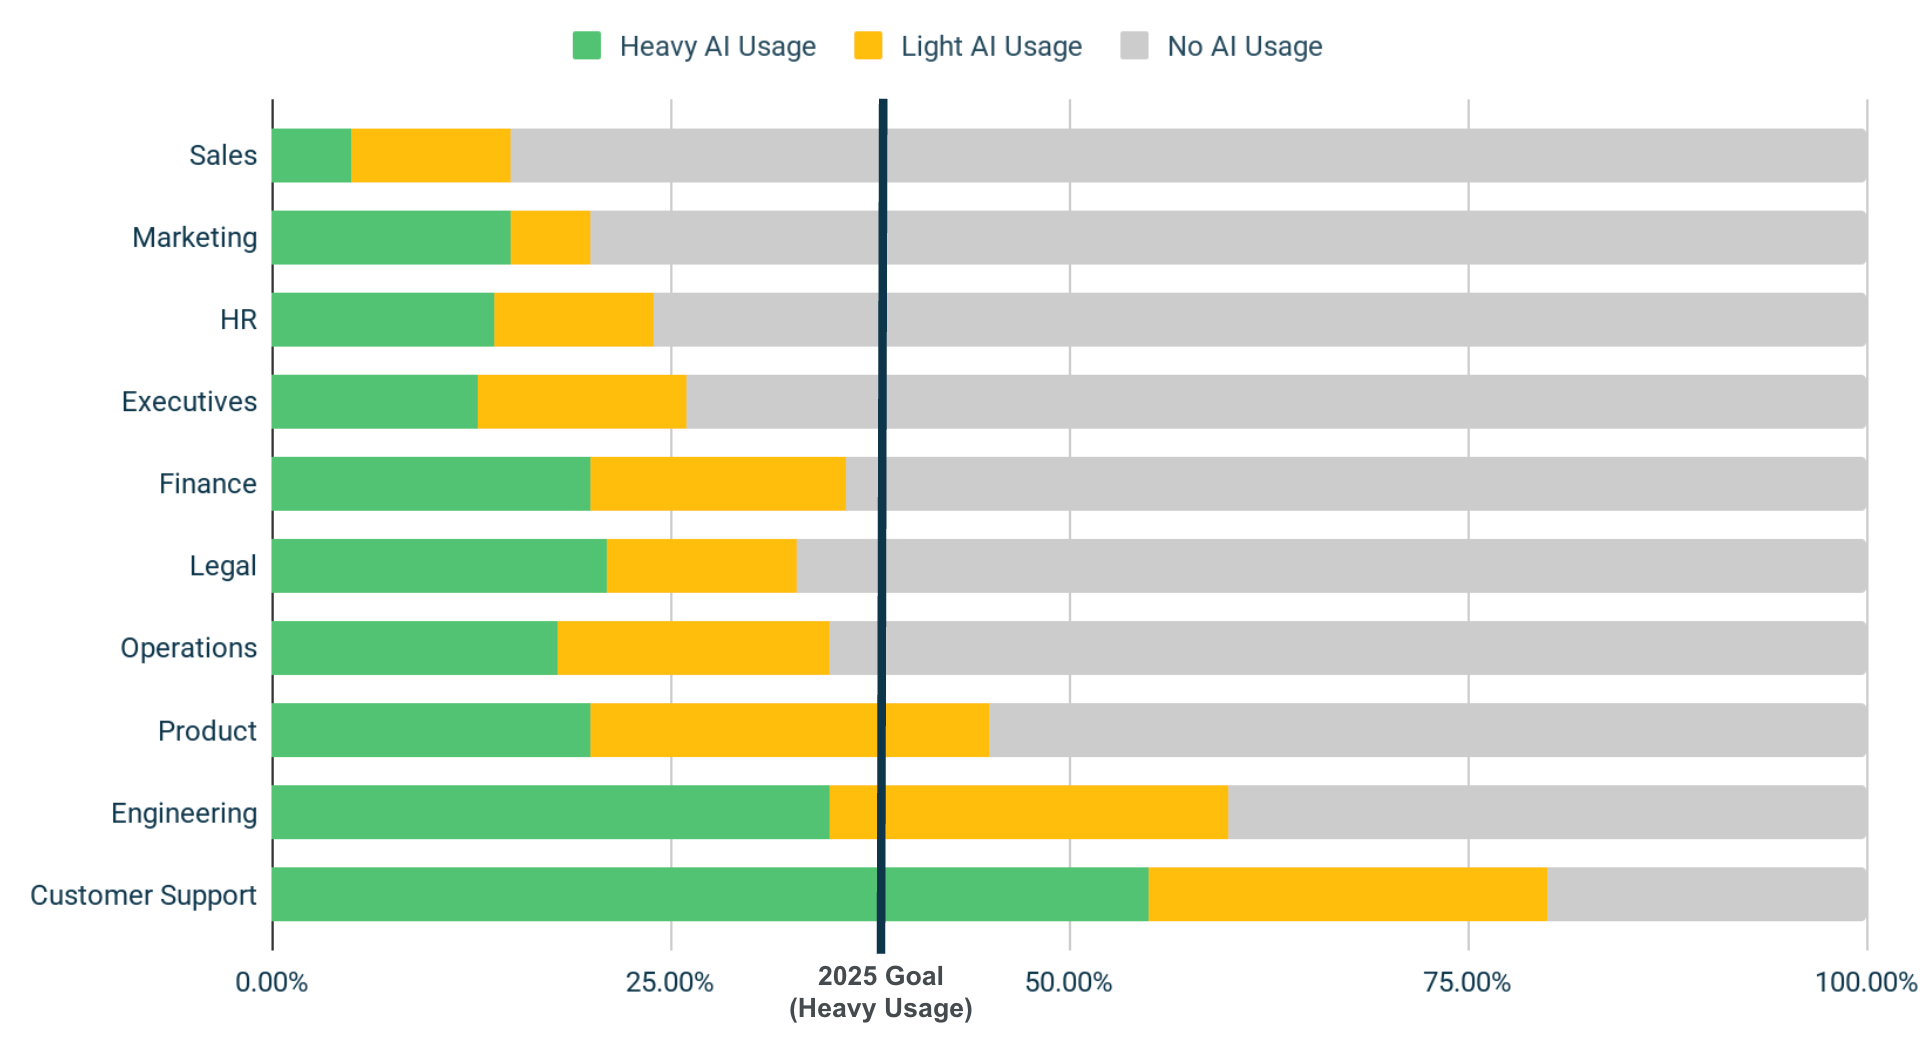
• Light vs. Heavy Usage Rate across departments
• AI Adoption per Department percentages
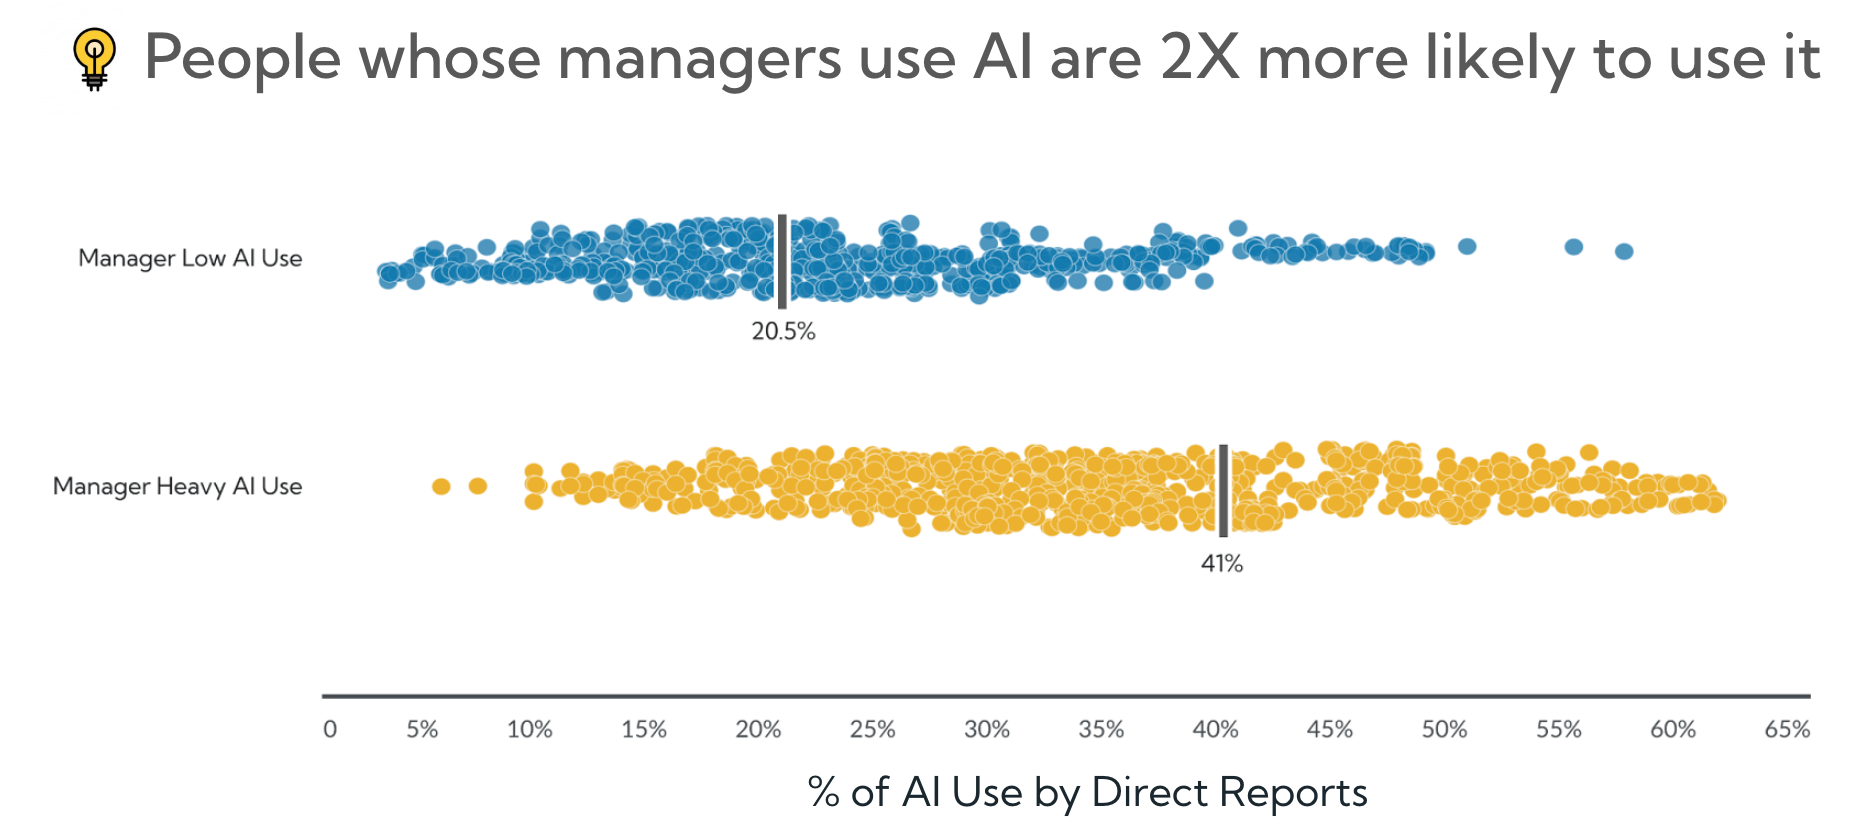
• Manager Usage per Department ratios
• New-Hire vs. Tenured Employee Usage patterns (Worklytics)
Calculation Framework:
Efficiency ROI = (Hours Saved × Hourly Rate × Number of Employees) - Monitoring Tool Cost
For example, if your Engineering and Customer Support departments have 80% of staff actively using AI, and each heavy user saves 5 hours per week, the annual value for a 100-person engineering team earning $100/hour would be:
(5 hours × $100 × 80 employees × 52 weeks) - Annual Monitoring Cost = $2,080,000 - Monitoring Cost
Many organizations segment usage by team, department, or role to uncover adoption gaps and identify areas requiring additional support or training. (
Quality improvements often provide 2-3x the ROI of pure efficiency gains because they compound over time. Future employee performance productivity measures will extend beyond current parameters to include aspects like quality, innovation, employee well-being, and ethical practices. (Work Design)
AI tools excel at catching errors before they propagate through workflows. Tracking usage patterns helps identify which teams are leveraging AI for quality assurance versus those still relying on manual processes.
Artificial Intelligence will play a crucial role in advancing and refining performance metrics, offering deeper analytics for efficiency. (
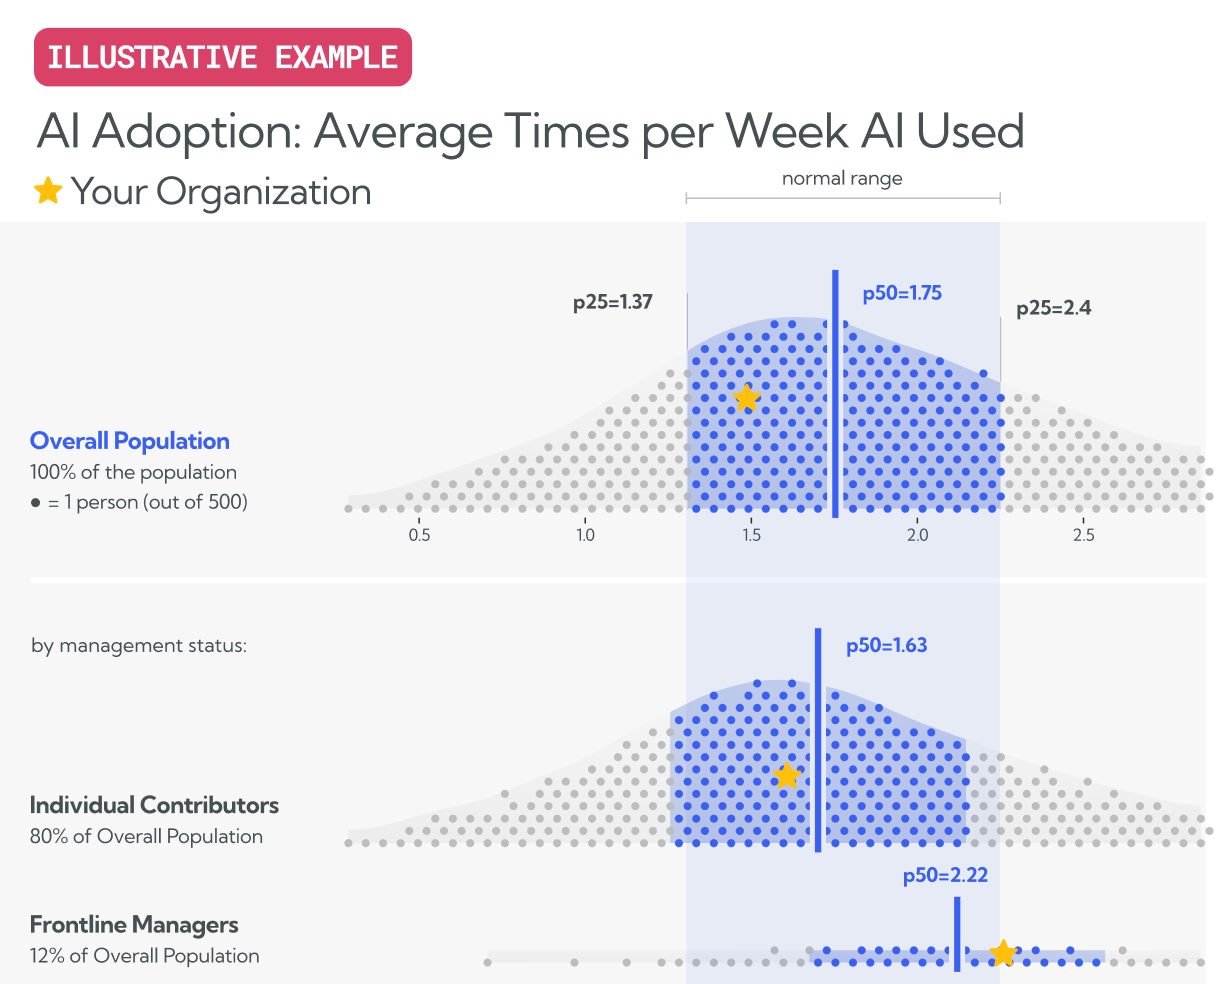
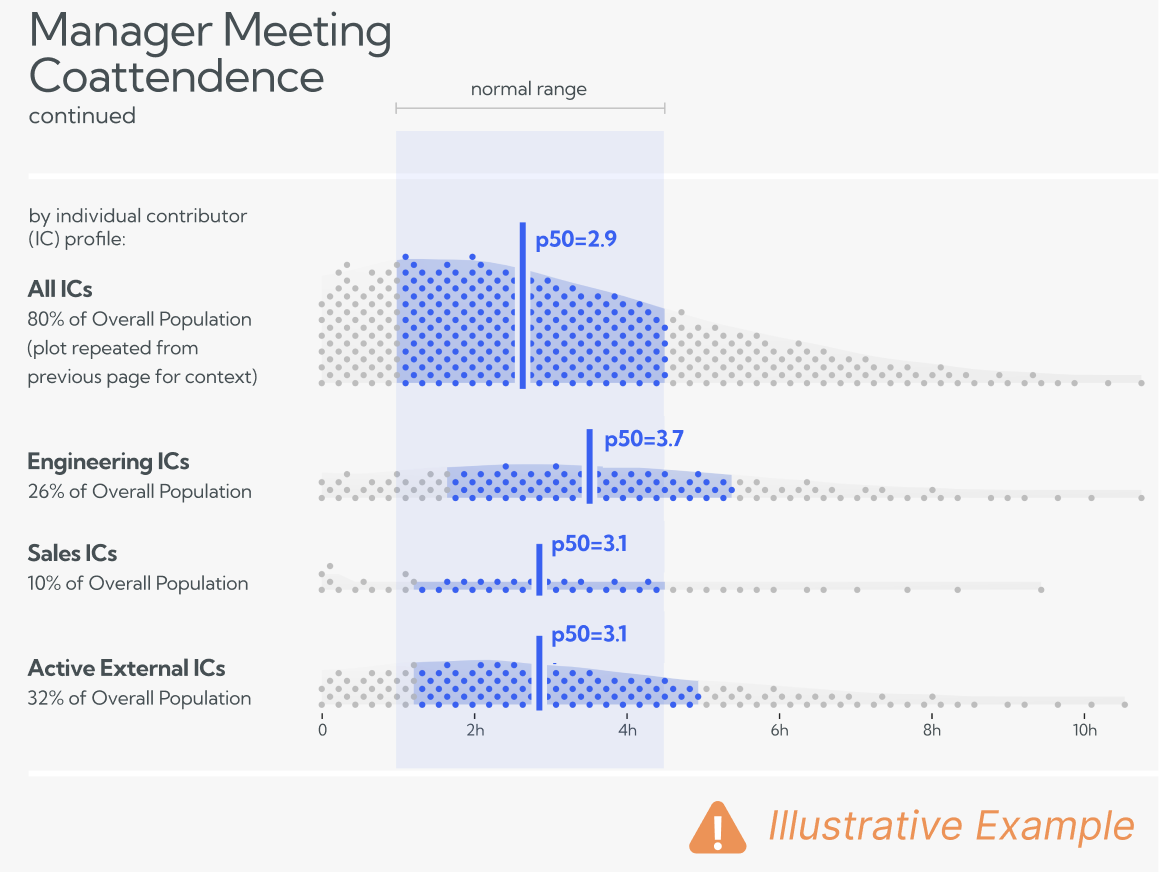
In Sales, 90% of frontline reps use an AI-driven CRM assistant, but only 40% of Sales managers do. (
The highest ROI tier focuses on how AI usage tracking drives top-line growth through better resource allocation and strategic decision-making.
85% of employees hired in the last 12 months use AI weekly versus only 50% of those with 10+ years at the company. (
• Design targeted retention programs for AI-savvy employees
• Adjust hiring criteria to attract AI-proficient candidates
• Reduce turnover costs (typically 50-200% of annual salary)
Companies that track AI usage can identify and scale successful patterns faster than competitors. This speed advantage translates directly to market share and revenue growth.
Detailed usage analytics enable executives to invest in AI tools and training where they'll have the highest impact, rather than spreading resources thin across all departments.
When building your ROI model, these variables have the highest impact on outcomes:
Employee Productivity Metrics
• Average hourly compensation (including benefits)
• Baseline productivity measurements
• AI tool adoption rates by role and department
• Time savings per AI interaction
Quality and Error Metrics
• Cost of rework and error correction
• Customer satisfaction impact scores
• Innovation project success rates
• Compliance and risk reduction values
Strategic Business Metrics
• Employee turnover costs
• Time-to-market improvements
• Revenue per employee ratios
• Competitive positioning value
To build board-ready presentations, test your ROI model against these scenarios:
Conservative Scenario (25th percentile outcomes)
• 20% of employees achieve meaningful AI productivity gains
• 2 hours per week time savings for active users
• 10% reduction in quality-related rework
• 5% improvement in employee retention
Realistic Scenario (50th percentile outcomes)
• 50% of employees achieve meaningful AI productivity gains
• 5 hours per week time savings for active users
• 25% reduction in quality-related rework
• 15% improvement in employee retention
Optimistic Scenario (75th percentile outcomes)
• 80% of employees achieve meaningful AI productivity gains
• 10 hours per week time savings for active users
• 40% reduction in quality-related rework
• 25% improvement in employee retention
ROI Summary Table
ROI ComponentConservativeRealisticOptimisticEfficiency Gains$500K$1.2M$2.1MQuality Uplift$200K$600K$1.1MRevenue Acceleration$150K$450K$850KTotal Annual ROI$850K$2.25M$4.05MMonitoring Investment$100K$100K$100KNet ROI$750K$2.15M$3.95MROI Multiple8.5x22.5x40.5x
Key Performance Indicators (KPIs) Dashboard
Track these metrics monthly to validate your ROI assumptions:
• AI adoption rate by department
• Average time savings per user
• Quality improvement scores
• Employee satisfaction with AI tools
• Revenue per employee trends
• Customer satisfaction correlations
Transparency in the use of data, ethical consent, and the protection of employee privacy will become imperative to maintain trust and balance the benefits and risks associated with AI in the workplace. (Work Design) Address these concerns proactively:
Over 58% of the workforce now engages in remote work, increasing reliance on employee monitoring tools, while 86% of employees believe it should be a legal requirement for employers to disclose if they use monitoring tools. (
One recent survey on generative AI adoption revealed that 31% of employees - especially younger staff - admitted to sabotaging their company's AI efforts. (
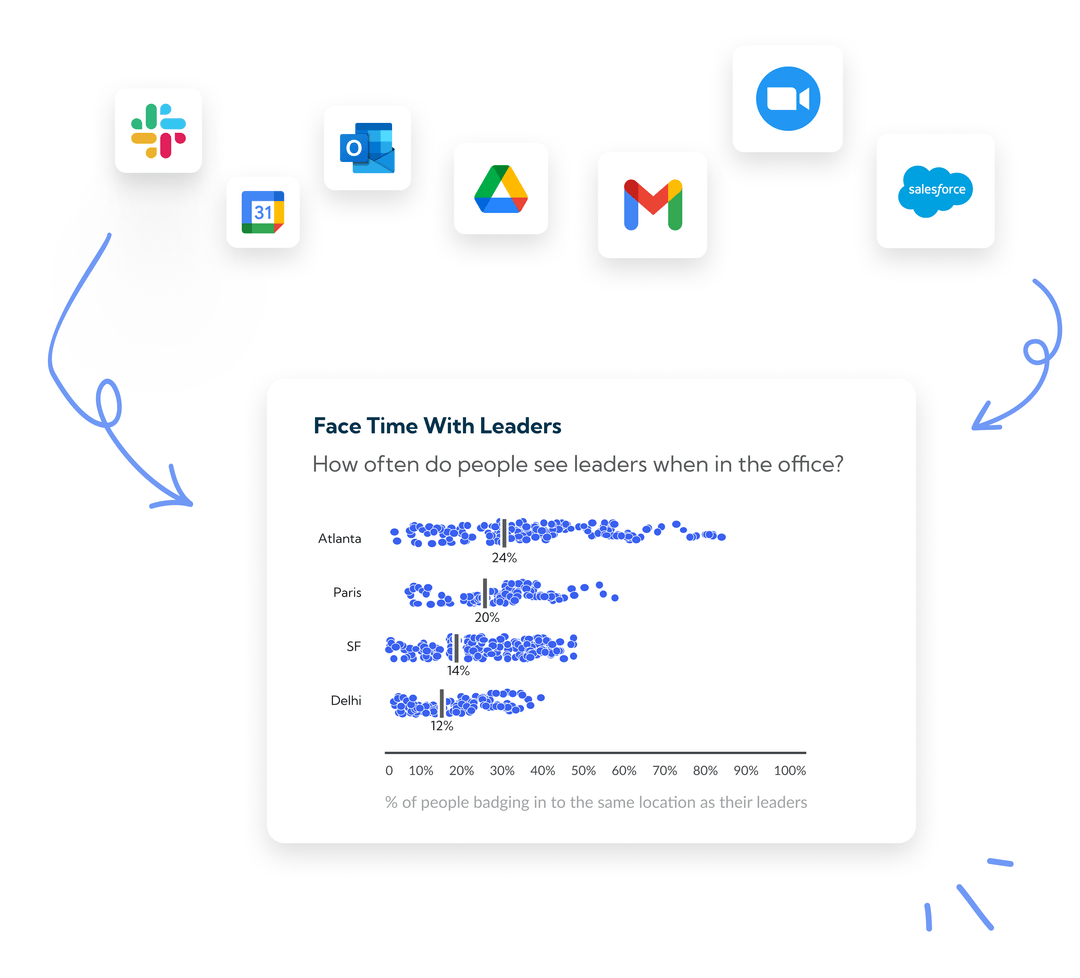
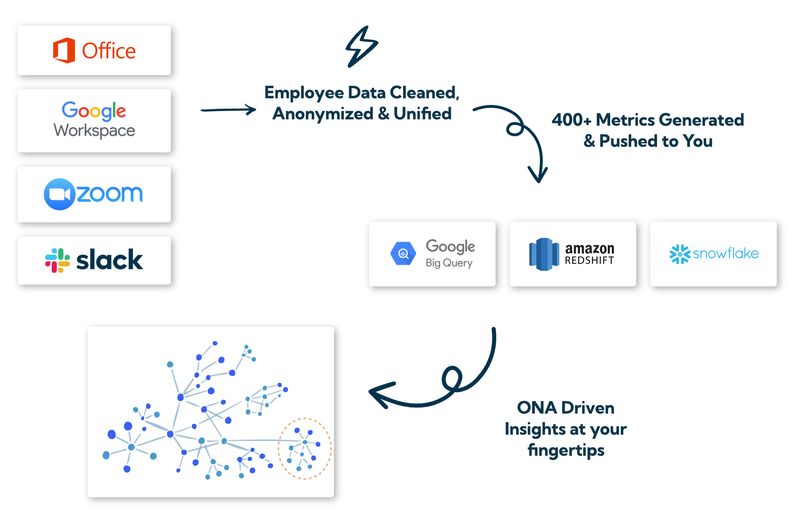
Worklytics provides data from more than 25 of the most common collaboration tools and uses machine learning to clean, de-duplicate, and standardize datasets. (
Key Activities:
• Deploy AI usage tracking tools
• Establish baseline productivity measurements
• Create privacy and compliance frameworks
• Begin employee communication and training
Many companies are launching internal AI academies or partnering with online education platforms to teach employees data science, AI tools, or prompt engineering for generative AI. (
Key Activities:
• Analyze usage patterns and identify high-impact use cases
• Scale successful AI implementations across departments
• Refine ROI calculations based on actual data
• Adjust training and support programs
56% of respondents say it is very or critically important to share the rewards that AI creates with workers, yet 77% of organizations aren't doing anything meaningful about sharing AI-created rewards with workers. (
Key Activities:
• Implement AI-based performance incentives
• Integrate AI metrics into strategic planning
• Develop competitive advantage strategies
• Plan for advanced AI implementations
AI tools often exhibit network effects where value increases exponentially as more team members adopt them. Skilled AI talent is scarce, and there's also a shortage of staff who know how to interpret AI outputs or integrate AI into workflows. (Worklytics) Tracking these network effects helps quantify the compounding value of widespread adoption.
A well-defined strategy ensures all AI efforts are pulling in the same direction toward business value. (Worklytics) The ROI of AI usage tracking extends beyond immediate productivity gains to include:
• Organizational learning and capability building
• Data-driven decision making culture
• Competitive intelligence and benchmarking
• Future AI investment optimization
Different industries see varying ROI patterns from AI usage tracking:
GitHub Copilot and similar tools show immediate productivity gains, with some organizations reporting 30-50% faster code completion rates.
AI-powered support tools can reduce response times and improve resolution rates, directly impacting customer satisfaction and retention.
AI usage in CRM systems and marketing automation can significantly improve conversion rates and customer lifetime value.
These metrics predict future ROI and help course-correct early:
• AI tool adoption velocity
• User engagement depth (frequency and duration)
• Training completion rates
• Employee satisfaction with AI tools
• Manager support and advocacy levels
These metrics confirm ROI achievement:
• Productivity improvements per employee
• Quality metrics and error reduction
• Customer satisfaction scores
• Revenue per employee growth
• Employee retention rates
Worklytics can boost AI adoption in your organization by providing visibility into usage patterns and identifying optimization opportunities. (Worklytics) Compare your metrics against industry benchmarks:
• Average AI adoption rates by industry
• Productivity improvement ranges
• ROI multiples for similar organizations
• Time-to-value benchmarks
Many organizations make the mistake of viewing AI usage tracking purely as a cost-cutting exercise. This narrow focus misses the larger opportunities for quality improvement and revenue acceleration.
Solution: Build a balanced scorecard that includes efficiency, quality, and strategic metrics.
Technical implementation without proper change management often leads to low adoption and poor ROI. Running an AI impact assessment unveils hidden risks and missed opportunities. (Worklytics)
Solution: Invest equally in technology and people-focused initiatives.
AI ROI often follows a J-curve, with initial investments showing negative returns before significant positive impact emerges.
Solution: Set realistic expectations and measure progress over 12-18 month periods.
Worklytics uses data anonymization and aggregation to ensure compliance with GDPR, CCPA, and other data protection standards. (Worklytics) Failing to address privacy concerns can derail AI initiatives.
Solution: Build privacy-by-design principles into your tracking implementation.
The AI landscape evolves rapidly, and your ROI model should account for emerging trends:
Future AI tools will combine text, voice, image, and video processing, potentially multiplying productivity gains.
New frameworks for AI-human collaboration will emerge, requiring updated measurement approaches.
Evolving AI regulations may impact implementation costs and compliance requirements.
Worklytics has a pipeline that can connect to existing data warehouses or visualization tools. (Worklytics) Design your ROI framework to scale with organizational growth:
• Modular measurement components
• Automated data collection and analysis
• Flexible reporting and visualization
• Integration with existing business systems
Calculating the ROI of tracking employee AI usage transforms from a budget justification exercise into a strategic advantage when approached systematically. The three-tier framework - efficiency gains, quality uplift, and revenue acceleration - provides executives with the comprehensive view needed to make informed investment decisions.
The impact of AI in businesses extends far beyond simple productivity metrics. (Worklytics) Organizations that invest in robust AI usage tracking and measurement capabilities position themselves to:
• Make data-driven decisions about AI investments
• Optimize AI adoption across departments and roles
• Identify and scale successful AI use cases
• Build competitive advantages through superior AI utilization
• Create sustainable value from AI initiatives
Insights on your AI usage and optimizing for AI proficiency become critical differentiators in an increasingly AI-driven business landscape. (Worklytics) The organizations that master AI usage measurement today will be the ones that capture disproportionate value from AI investments tomorrow.
As you build your business case for AI usage tracking, remember that the goal isn't just to justify costs - it's to create a framework for continuous optimization and strategic advantage. The ROI of tracking employee AI usage isn't just about the dollars saved or earned; it's about building the organizational capability to thrive in an AI-first future.
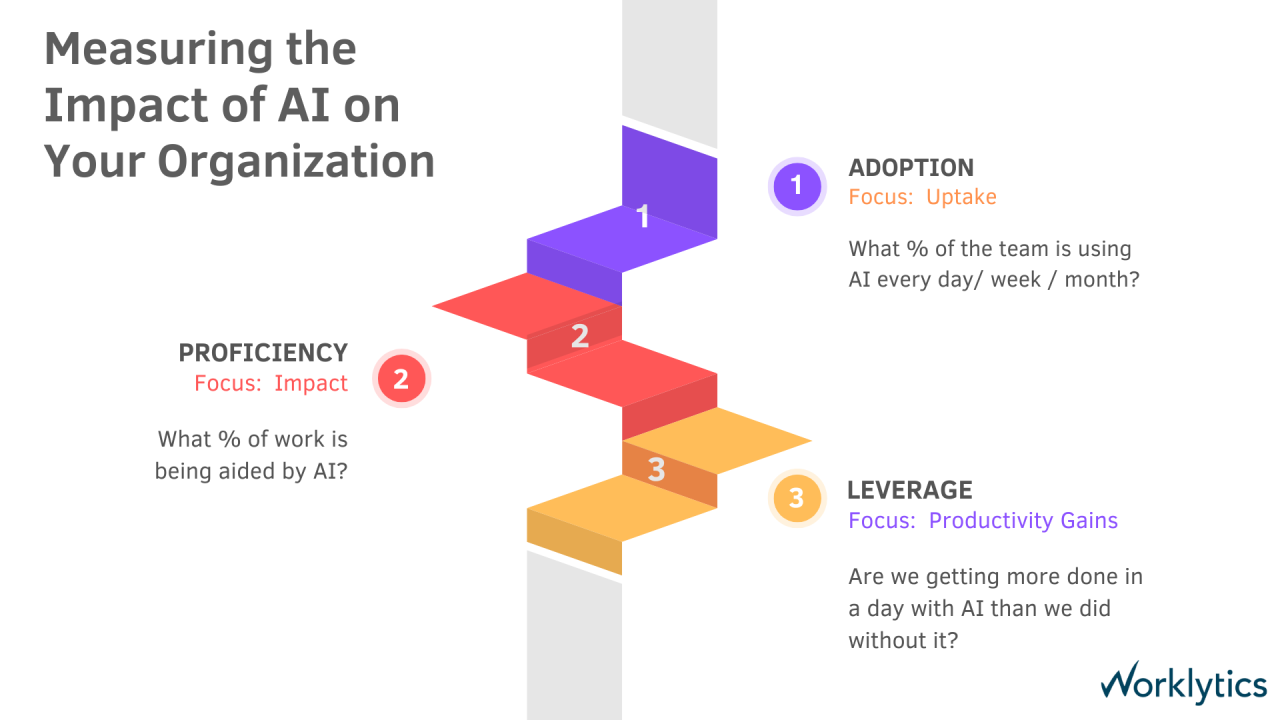
The three-tier framework includes efficiency gains (measuring time savings and productivity improvements), quality improvements (tracking error reduction and output enhancement), and revenue acceleration (quantifying business growth from AI adoption). Each tier builds upon the previous one, creating a comprehensive view of AI monitoring value from operational metrics to bottom-line impact.
Calculate ROI by measuring time savings multiplied by hourly rates, quality improvements reducing rework costs, and revenue increases from faster delivery or innovation. Use sensitivity analysis to account for variables like adoption rates and productivity multipliers. The framework includes practical calculators that convert leading indicators like usage metrics into concrete financial returns.
Key leading indicators include adoption rates across teams and departments, usage frequency and depth, and engagement patterns over time. Research shows that high adoption metrics are necessary for achieving downstream benefits, with organizations needing to segment usage by role to identify gaps requiring additional support or training.
According to Worklytics research, most companies experiment with AI without proper measurement frameworks or tracking mechanisms. The gap between AI investment and measurable returns stems from lack of visibility into actual usage patterns, inability to connect AI adoption to business outcomes, and absence of systematic approaches to optimize AI tool deployment across the organization.
Board-ready templates translate complex usage data into executive-friendly dashboards showing clear ROI progression from adoption metrics to financial impact. These visualizations demonstrate the business case for monitoring tools by connecting employee AI usage patterns to productivity gains, quality improvements, and revenue acceleration in formats that resonate with C-suite decision makers.
Sensitivity analysis helps executives understand how changes in key variables like adoption rates, productivity multipliers, and tool costs affect overall ROI. This analysis provides confidence ranges for financial projections and helps identify which factors have the greatest impact on returns, enabling more informed decisions about AI monitoring investments and optimization strategies.
2. https://www.workdesign.com/2024/04/ai-will-shape-the-new-era-of-employee-performance-metrics/
3. https://www.worklytics.co/blog/adoption-to-efficiency-measuring-copilot-success
4. https://www.worklytics.co/blog/impact-of-ai-in-businesses
5. https://www.worklytics.co/blog/insights-on-your-ai-usage-optimizing-for-ai-proficiency
6. https://www.worklytics.co/blog/key-compliance-laws-for-remote-employee-monitoring-data-protection
7. https://www.worklytics.co/blog/top-ai-adoption-challenges-and-how-to-overcome-them
8. https://www.worklytics.co/blog/tracking-employee-ai-adoption-which-metrics-matter
10. https://www.worklytics.co/get-started


