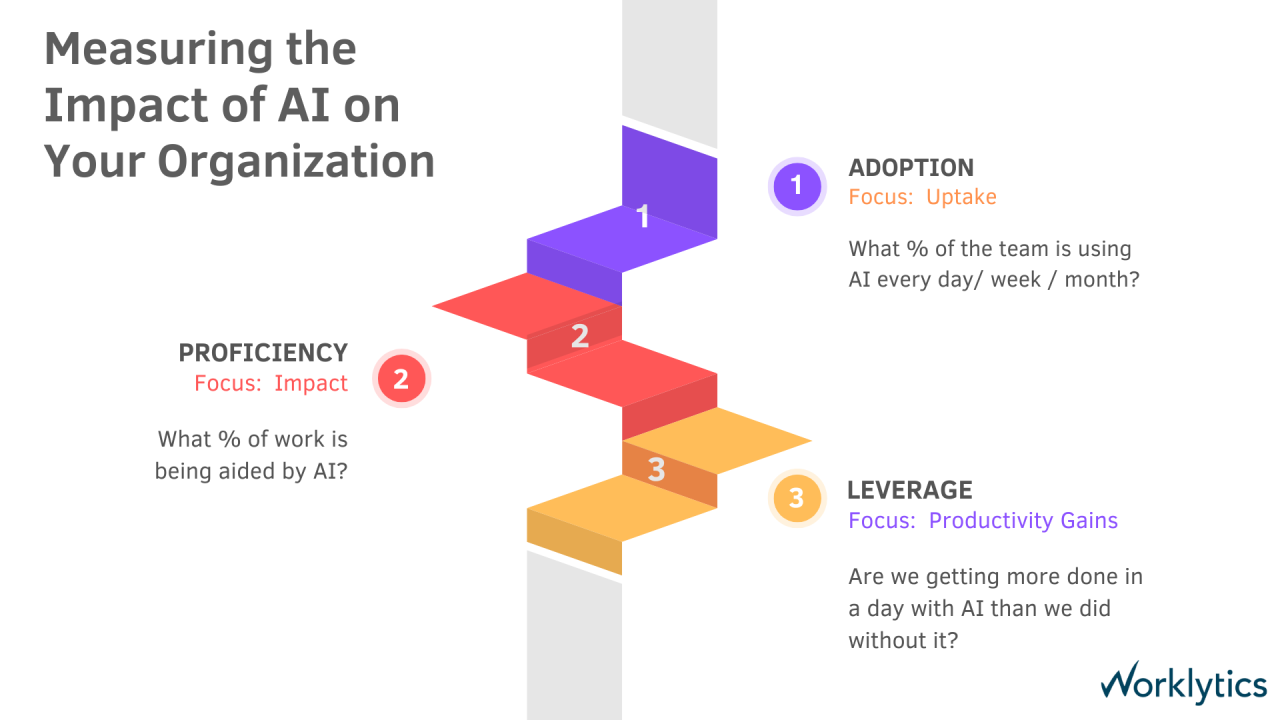
As we move deeper into 2025, artificial intelligence has shifted from experimental technology to business-critical infrastructure. Recent surveys reveal striking adoption patterns: Gallup reports that 40% of employees use AI annually, with 19% engaging weekly, while EY found 75% overall usage across organizations (Workera). But here's the challenge—these industry benchmarks only tell part of the story. Without internal measurement capabilities, organizations remain blind to their actual AI adoption rates, usage patterns, and ROI potential.
The gap between knowing industry averages and understanding your organization's AI maturity can cost millions in missed productivity gains. Companies that effectively measure and optimize AI adoption see transformative results: 93% of leaders at high-AI-usage companies were open to a four-day workweek, compared to fewer than half of those with minimal AI integration (Worklytics). This isn't just about tracking usage—it's about unlocking the future of work.
This comprehensive guide establishes realistic 2025 AI adoption baselines by industry and role, then details exactly how to recreate those metrics internally using Worklytics' collaboration analytics combined with Copilot and Gemini audit logs. We'll provide a downloadable KPI template and explain how to visualize trends against external benchmarks, giving you the complete toolkit to answer: "What percent of employees use AI tools weekly in 2025?"
The latest research reveals significant variation in AI adoption across different sectors and use cases. According to the World Economic Forum's survey of 1,000 global employers representing 14.1 million workers, 86% expect AI and information processing technologies to transform their business by 2030 (Workera). However, current adoption tells a more nuanced story.
Gallup's comprehensive analysis shows that while 40% of employees report annual AI usage, only 19% engage with generative AI tools on a weekly basis. This weekly usage metric has become the gold standard for measuring meaningful AI integration, as it indicates consistent workflow incorporation rather than occasional experimentation.
EY's broader survey found 75% overall AI usage, but this includes everything from basic automation to advanced generative AI applications. The key insight: organizations need granular metrics to understand not just who's using AI, but how frequently and effectively.
AI adoption varies dramatically by function and seniority level. Departments like HR, Marketing, and Sales—where AI could provide the most immediate value—often have the lowest adoption rates (Worklytics). This paradox highlights the importance of measuring adoption by role to identify opportunity gaps.
Research shows that if leadership and managers embrace a new technology, their teams are far more likely to use it themselves (Worklytics). This cascading effect makes executive-level metrics particularly crucial for predicting organization-wide adoption trajectories.
| Role Category | Weekly AI Usage (Industry Average) | Primary Use Cases |
|---|---|---|
| Executives | 35% | Strategic analysis, decision support |
| Managers | 28% | Team coordination, reporting |
| Individual Contributors | 22% | Content creation, research |
| Technical Roles | 45% | Code generation, debugging |
| Creative Roles | 38% | Content ideation, design assistance |
AI adoption rates also correlate strongly with company size and geographic location. Organizations with over 10,000 employees show 31% weekly usage rates, while companies under 1,000 employees average just 16%. This disparity reflects resource availability, IT infrastructure maturity, and formal AI governance programs.
Geographically, North American companies lead with 24% weekly adoption, followed by European organizations at 19%, and Asia-Pacific at 17%. These variations underscore the importance of selecting appropriate benchmark cohorts when evaluating your organization's performance.
Just as consumer apps track Daily Active Users (DAU), Weekly Active Users (WAU), and Monthly Active Users (MAU), organizations need similar metrics for AI tool adoption. These measurements provide different insights into usage patterns and engagement depth.
Daily Active Users (DAU) represent employees who interact with AI tools during their regular workflow. This metric indicates deep integration and habit formation. Industry leaders typically see 8-12% DAU rates for generative AI tools.
Weekly Active Users (WAU) capture employees who use AI tools at least once per week. This metric balances meaningful engagement with realistic usage patterns, making it the most reliable indicator of successful AI adoption. The 19% industry average provides a solid benchmark.
Monthly Active Users (MAU) include anyone who touches AI tools within a 30-day period. While this metric captures experimentation and occasional usage, it's less predictive of productivity impact. The 40% industry average reflects this broader engagement.
The relationship between these metrics reveals adoption maturity. Organizations with high DAU/WAU ratios (above 0.4) demonstrate strong habit formation, while those with high MAU/WAU ratios (above 2.5) may have engagement challenges requiring intervention.
Worklytics provides comprehensive AI adoption tracking by analyzing collaboration, calendar, communication, and system usage data without relying on surveys (Worklytics). This approach delivers real-time intelligence on how AI tools integrate into actual work patterns.
The platform can boost AI adoption in your organization by identifying usage gaps, measuring efficiency gains, and providing visibility into how AI tools affect productivity metrics (Worklytics). By leveraging existing corporate data, organizations gain unprecedented insight into AI's impact on work patterns.
Worklytics integrates with a variety of corporate productivity tools, HRIS, and office utilization data to analyze team work and collaboration patterns (Worklytics). This comprehensive data foundation enables accurate measurement of AI tool usage across different platforms and workflows.
The most accurate AI adoption measurement combines Worklytics' collaboration analytics with native audit logs from AI platforms like Microsoft Copilot and Google Gemini. This dual-source approach provides both behavioral context and precise usage data.
Worklytics analyzes collaboration events—emails, meetings, document edits, chat messages—to understand how AI tools integrate into existing workflows. Meanwhile, Copilot and Gemini audit logs provide exact timestamps, query counts, and feature usage statistics.
This combination reveals not just who uses AI tools, but how usage correlates with productivity metrics, collaboration patterns, and business outcomes. Organizations can track whether AI adoption leads to shorter meeting times, faster document creation, or improved project completion rates.
Building an effective AI adoption measurement framework requires integrating multiple data sources:
Collaboration Platforms:
AI Tool Audit Logs:
HR and Performance Data:
Worklytics can analyze tasks and projects completed in Asana and team work in Bitbucket, providing comprehensive coverage of how AI tools affect different aspects of work (Worklytics).
AI adoption measurement must balance insight generation with privacy protection. Over 58% of the workforce now engages in remote work, increasing reliance on employee monitoring tools, but 86% of employees believe it should be a legal requirement for employers to disclose if they use monitoring tools (Worklytics).
Worklytics addresses these concerns by using data anonymization and aggregation to ensure compliance with GDPR, CCPA, and other data protection standards (Worklytics). The platform analyzes patterns without exposing individual employee activities, maintaining trust while delivering actionable insights.
Transparency in the use of data, ethical consent, and the protection of employee privacy will become imperative to maintain trust and balance the benefits and risks associated with AI in the workplace (Work Design).
Start by establishing current AI usage baselines across your organization. This involves configuring data collection from all relevant sources and ensuring proper permissions and compliance protocols.
Week 1-2: Infrastructure Setup
Week 3-4: Data Validation
Many organizations use AI dashboards and analytics tools to track tool usage and efficiency (Worklytics). The key is ensuring these dashboards provide actionable insights rather than just vanity metrics.
Develop a comprehensive KPI framework that aligns with business objectives and provides clear benchmarks for success. The framework should include leading indicators (training completion, tool access) and lagging indicators (productivity gains, efficiency improvements).
Core AI Adoption KPIs:
| Metric Category | KPI | Calculation | Target Benchmark |
|---|---|---|---|
| Usage Frequency | Weekly Active Users | Unique users with AI activity in 7 days / Total employees | 19% (Industry avg) |
| Engagement Depth | Average Sessions per WAU | Total AI sessions / Weekly active users | 3.2 sessions |
| Feature Adoption | Tool Diversity Score | Unique AI features used / Available features | 0.35 |
| Productivity Impact | Time Savings per User | (Pre-AI task time - Post-AI task time) / Pre-AI task time | 15-25% |
| Business Outcome | Revenue per AI User | Revenue attributed to AI-enabled processes / AI users | Varies by industry |
A downloadable KPI template is available to help organizations track these metrics systematically (Google Sheets). The template provides instructions on choosing start dates, entering metric names, and reviewing week-on-week analysis.
Once basic measurement is established, organizations can develop sophisticated analytics that reveal deeper insights into AI adoption patterns and business impact.
Advanced Measurement Techniques:
Cohort Analysis: Track adoption rates by hire date, department, or training completion to identify successful onboarding patterns.
Correlation Analysis: Measure relationships between AI usage and performance metrics, collaboration frequency, or project completion rates.
Predictive Modeling: Use historical data to forecast adoption trajectories and identify employees likely to become power users.
Impact Attribution: Connect AI usage to specific business outcomes like faster project delivery, improved customer satisfaction, or reduced operational costs.
Worklytics has identified four new ways to model work in the era of hybrid work, including measuring workday intensity as time spent on digital work as a percentage of overall workday span (Worklytics). These models help organizations understand how AI tools affect work patterns and productivity.
Technology companies typically lead AI adoption with 52% weekly usage rates among technical roles. Software engineers show the highest engagement, using AI for code generation, debugging, and documentation. GitHub Copilot impact measurement reveals significant productivity gains in development workflows (Worklytics).
Key metrics for tech organizations:
Financial services organizations show more conservative adoption patterns due to regulatory requirements and risk management concerns. However, leading firms demonstrate that careful implementation can achieve significant benefits while maintaining compliance.
Typical adoption patterns:
Healthcare organizations face unique challenges in AI adoption due to patient privacy requirements and regulatory oversight. However, administrative and research functions show strong adoption potential.
Benchmark ranges:
Manufacturing companies typically show lower overall AI adoption but higher impact in specific use cases like predictive maintenance, quality control, and supply chain optimization.
Adoption patterns:
Understanding where your organization sits on the AI maturity curve is crucial for setting realistic benchmarks and improvement targets. The AI maturity curve measuring AI adoption in your organization provides a structured framework for assessment (Worklytics).
Stage 1: Experimentation (0-10% weekly usage)
Stage 2: Pilot Programs (10-25% weekly usage)
Stage 3: Systematic Adoption (25-45% weekly usage)
Stage 4: AI-Native Operations (45%+ weekly usage)
Successful AI maturity progression requires tracking both quantitative metrics and qualitative indicators. Organizations should monitor not just usage rates but also skill development, process integration, and cultural adoption.
Quantitative Progression Indicators:
Qualitative Progression Indicators:
Improving AI proficiency in your organization requires focusing on both usage and uptake metrics (Worklytics). Organizations that track both dimensions can identify specific intervention points for acceleration.
Effective AI adoption dashboards balance comprehensive data with actionable insights. The best dashboards tell a story about adoption progress while highlighting areas requiring attention.
Executive Dashboard Elements:
Manager Dashboard Elements:
Individual Dashboard Elements:
Comparing internal metrics to external benchmarks requires careful consideration of organizational context, industry factors, and measurement methodologies. Simple percentage comparisons can be misleading without proper normalization.
Effective Comparison Strategies:
AI usage checker tools can track AI usage by team and role, providing granular insights for targeted improvement efforts (Worklytics). These tools enable precise benchmark comparisons at the department and role level.
Manual reporting processes cannot keep pace with the dynamic nature of AI adoption. Automated systems ensure stakeholders receive timely insights and can respond quickly to adoption challenges or opportunities.
Automated Reporting Features:
Alert Configuration Examples:
As AI technology evolves rapidly, measurement strategies must adapt to capture new usage patterns, tools, and business impacts. Future employee performance productivity measures will extend beyond current parameters to include aspects like quality, innovation, employee well-being, and ethical practices (Work Design).
Emerging Measurement Areas:
The AI landscape continues evolving with new tools, capabilities, and integration patterns. Organizations must build measurement frameworks flexible enough to accommodate future developments while maintaining historical comparability.
Future-Ready Measurement Principles:
Essential AI skills to learn to maximize your AI agents' impact include both technical proficiency and strategic thinking about AI integration (Worklytics). Organizations should track skill development alongside usage metrics.
The ultimate goal of AI adoption measurement extends beyond tracking usage to building organizational intelligence about AI's role in business success. This requires sophisticated analytics that connect AI adoption to strategic outcomes.
Advanced Intelligence Capabilities:
AI can enable a more efficient, flexible work schedule, with industry leaders like Eric Yuan predicting 32-hour workweeks could become standard "very soon" as AI streamlines workflows (Worklytics). Organizations that measure and optimize AI adoption position themselves to capture these transformative benefits.
The data is clear: AI adoption in 2025 isn't just about keeping up with trends—it's about positioning your organization for the future of work. With 19% weekly usage as the industry benchmark and 75% overall adoption across leading organizations, the question isn't whether to measure AI adoption, but how to do it effectively.
Worklytics provides the comprehensive measurement framework needed to understand, optimize, and accelerate AI adoption across your organization. By combining collaboration analytics with audit log data, organizations gain unprecedented visibility into how AI tools integrate with actual work patterns and drive business outcomes.
The measurement strategies outlined in this guide—from basic DAU/WAU/MAU tracking to sophisticated maturity curve analysis—provide a complete toolkit for AI adoption excellence. Organizations that implement these approaches will not only benchmark against industry standards but establish themselves as leaders in the AI-driven future of work.
Jamie Dimon predicts future generations will work just 3.5 days a week, with AI absorbing the brunt of repetitive tasks, while Bill Gates envisions workweeks of just two or three days (Worklytics). The organizations that measure, optimize, and accelerate AI adoption today will be the ones that capture these transformative benefits tomorrow.
Start measuring your AI adoption today. Download the KPI template, implement the measurement framework, and begin your journey toward AI-powered organizational excellence. The future of work is here—and it's measurable.
According to recent industry surveys, 19% of employees use GenAI tools on a weekly basis in 2025, while overall AI adoption has reached 75% across organizations. Gallup reports that 40% of employees use AI annually, indicating significant growth in workplace AI integration compared to previous years.
Worklytics provides comprehensive AI adoption analytics by integrating with tools like Microsoft Copilot and Google Gemini audit logs. The platform analyzes team work and collaboration patterns across various productivity tools, offering insights into AI usage frequency, user engagement levels, and productivity impact to help organizations benchmark their AI adoption against industry standards.
Essential AI adoption metrics include weekly active users, adoption rate percentage, feature utilization rates, and productivity impact measurements. Organizations should also track user engagement patterns, time-to-adoption for new users, and ROI metrics to understand the business value of AI tools implementation.
AI is transforming employee performance metrics beyond traditional productivity measures to include quality, innovation, employee well-being, and ethical practices. Future performance evaluations will leverage AI analytics for deeper efficiency insights while maintaining transparency in data use and protecting employee privacy to balance benefits and risks.
With over 58% of the workforce engaging in remote work, organizations must comply with data protection laws when monitoring AI usage. 86% of employees believe employers should legally disclose monitoring tool usage, making transparency and GDPR compliance essential for maintaining trust while tracking AI adoption metrics.
The downloadable KPI template provides a structured approach to tracking weekly and monthly AI adoption metrics. The template includes instructions for setting start dates, entering metric names and values, and reviewing week-on-week analysis to monitor your organization's AI adoption progress against 2025 benchmarks.