


Meeting room no-shows are silently draining your organization's productivity and real estate ROI. While most companies accept the industry-standard 18-25% no-show rate as inevitable, best-in-class organizations leverage data-driven tactics to achieve sub-10% rates. (Worklytics)
The cost of empty conference rooms extends far beyond wasted square footage. When teams can't find available spaces because rooms are phantom-booked, collaboration suffers, and employee frustration mounts. (Worklytics) The average executive spends 23 hours a week in meetings, nearly half of which could be cut without impacting productivity. (Worklytics)
This comprehensive guide outlines seven KPI-driven tactics that transform meeting room utilization from a cost center into a competitive advantage. Each strategy includes implementation frameworks, automation scripts, and quantifiable metrics to help you achieve industry-leading efficiency rates.
Before diving into solutions, it's crucial to understand the true impact of phantom bookings on your organization. Meeting room no-shows create a cascade of inefficiencies that compound throughout the workday.
The typical enterprise loses 15-20 seat-hours daily per conference room due to no-shows. In a 50-room facility, this translates to 750-1,000 wasted seat-hours weekly—equivalent to having 19-25 full-time employees sitting idle. (Worklytics)
Worklytics provides real-time data and analytics for meeting room usage, enabling organizations to track these metrics with precision. (Worklytics) The platform's benchmarking tools help measure team performance against industry standards, revealing opportunities for improvement that most companies miss.
When legitimate meetings can't secure rooms due to phantom bookings, teams resort to suboptimal alternatives: cramped huddle rooms, noisy open areas, or delayed decisions. This fragmentation directly impacts collaboration quality and decision-making speed. (Worklytics)
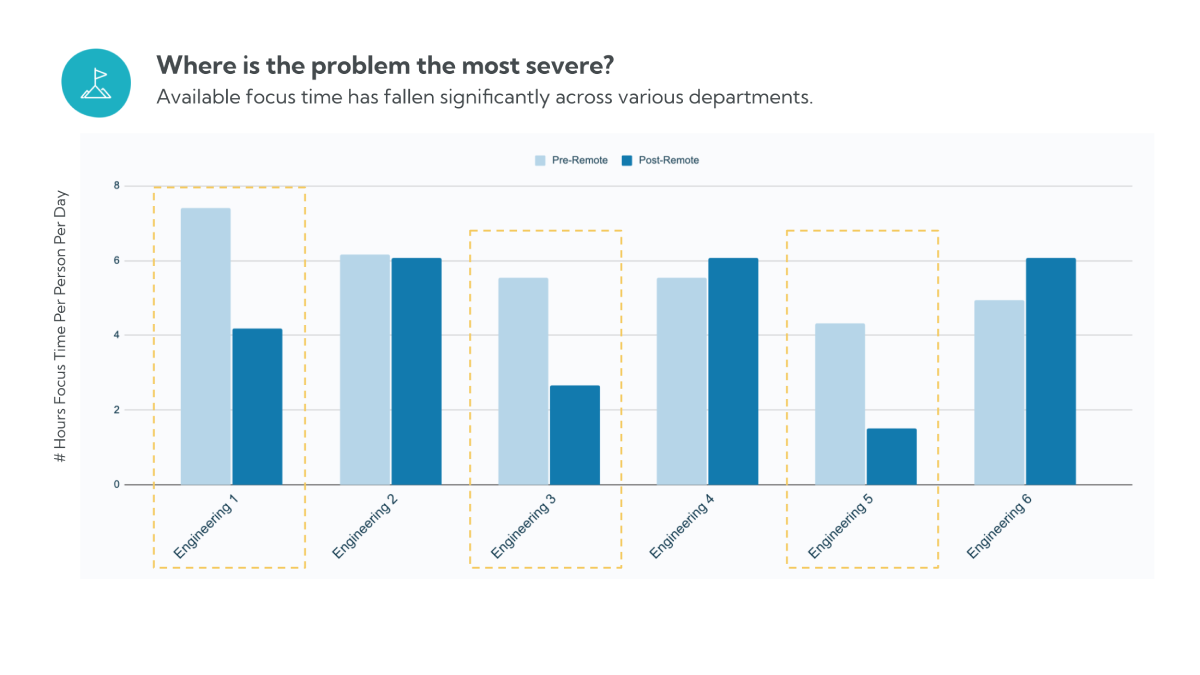
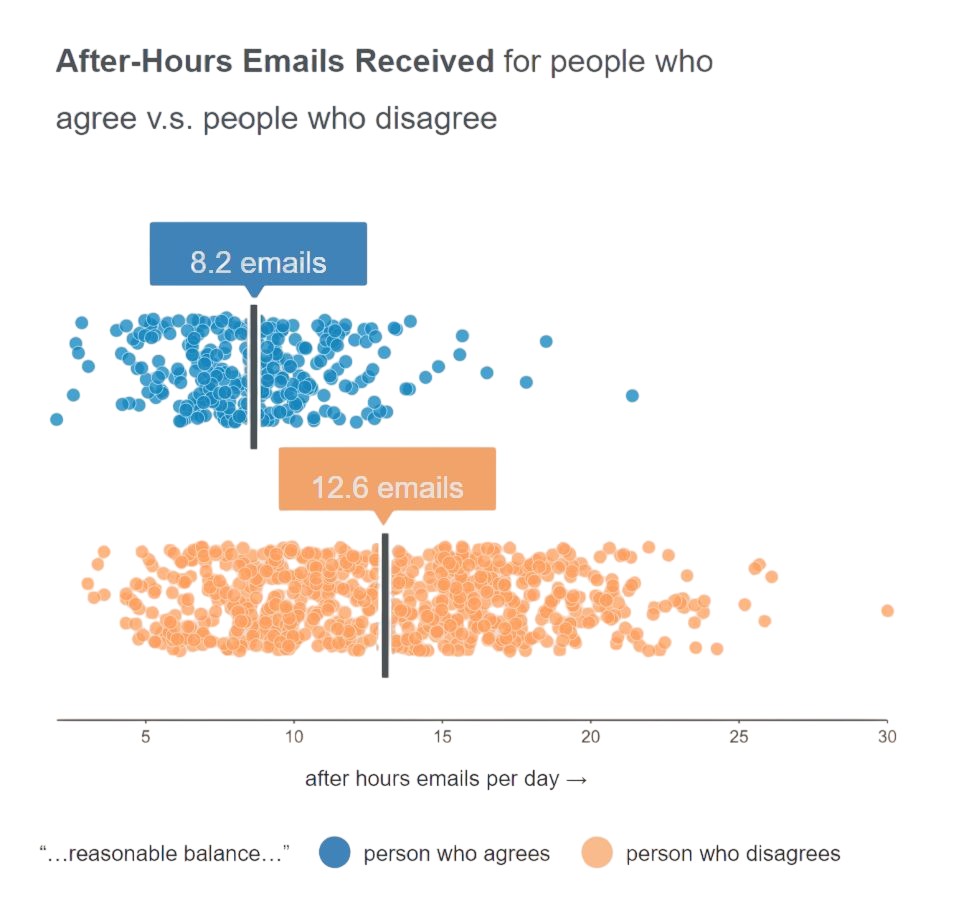
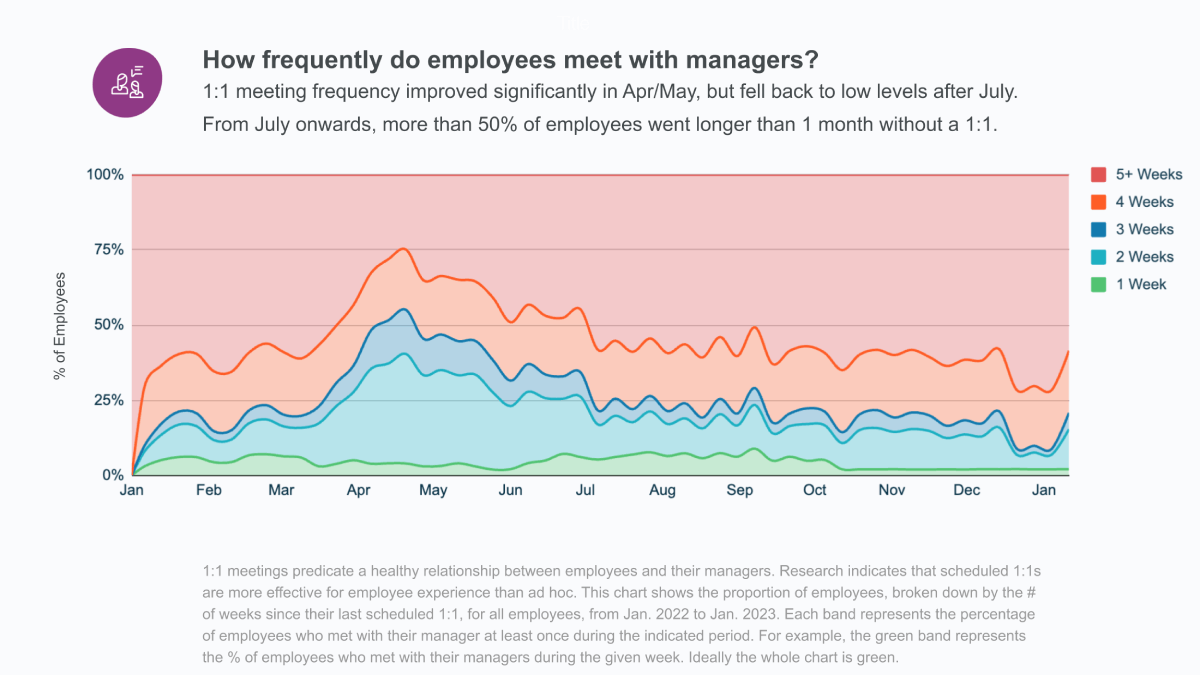
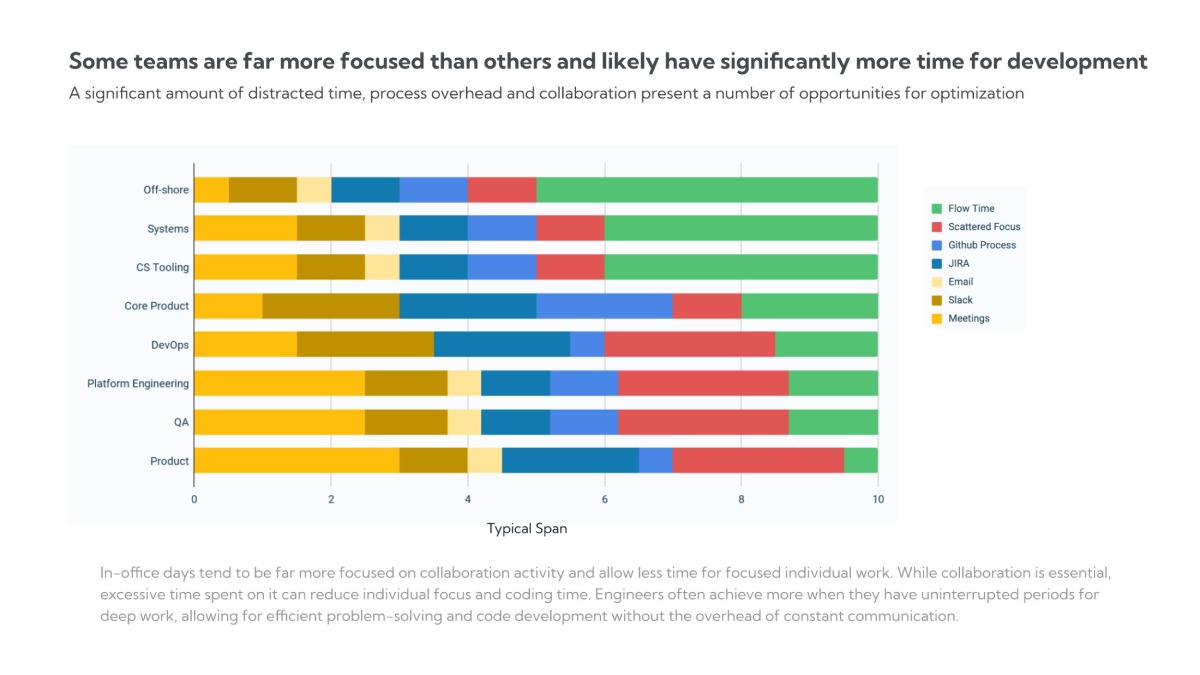
People who spend excessive time in meetings also tend to work longer workdays to compensate for lost time. (Worklytics) More than 10 hours per week in meetings for knowledge workers correlates with lower engagement scores, less focus time for deep work, and extended work days.
Automated reminder systems reduce no-shows by 35-40% when properly configured. The key lies in timing, personalization, and escalation protocols that adapt to user behavior patterns.
Timing Optimization:
• 24-hour advance notice for recurring meetings
• 2-hour reminder for ad-hoc bookings
• 15-minute "last chance" alert with one-click cancellation
Personalization Elements:
• Include meeting agenda and attendee list
• Show room location with building map link
• Display required equipment or setup notes
• Add weather alerts for off-site attendees
Microsoft Power Automate can trigger personalized reminders based on calendar events. The workflow monitors Exchange calendars, identifies room bookings, and sends targeted notifications through Teams, email, or SMS.
Key Automation Triggers:
• New room booking created
• Meeting time approaching (configurable intervals)
• No check-in detected 5 minutes post-start time
• Recurring meeting pattern identified
MetricBaselineTargetMeasurement MethodNo-show rate18-25%<12%Room sensor data + calendar analysisReminder open rate45-60%>75%Email/Teams analyticsLast-minute cancellations8-12%15-20%Calendar modification trackingUser satisfaction3.2/5>4.0/5Quarterly pulse surveys
Worklytics integrates with existing software stacks to provide real-time visibility into these metrics without requiring additional survey overhead. (Worklytics)
Financial or social penalties create immediate behavioral change when applied consistently. Organizations implementing penalty systems see 45-55% reductions in no-show rates within 30 days.
Tiered Consequence Model:
1. First Offense: Email reminder about room utilization impact
2. Second Offense: Manager notification + brief coaching conversation
3. Third Offense: Temporary booking restriction (48-72 hours)
4. Chronic Offenders: Permanent booking approval requirement
Financial Penalty Alternative:
• $25 charge per no-show (donated to company charity)
• $50 for premium rooms (executive boardrooms, video conference suites)
• Monthly departmental scorecards showing penalty totals
Before implementing financial penalties, ensure compliance with local labor laws and company policies. Some jurisdictions restrict wage deductions, requiring alternative approaches like performance review integration.
Technology Requirements:
• Automated detection system (room sensors or calendar analysis)
• Penalty tracking database
• Integration with payroll or expense systems
• Appeal process workflow
Google Apps Script can monitor calendar events and automatically apply penalties based on predefined rules. The script tracks no-show patterns, calculates penalty amounts, and generates monthly reports for department heads.
Core Functions:
• Calendar event monitoring
• No-show detection logic
• Penalty calculation and logging
• Automated report generation
• Exception handling for legitimate cancellations
A 200-person organization implementing penalty systems typically sees:
• 50% reduction in no-shows (from 20% to 10%)
• 15-20 additional seat-hours available daily
• $180,000 annual value recovery (based on $45/hour loaded employee cost)
• Implementation cost: $15,000-25,000 (sensors, software, setup)
• Net ROI: 620-1,100% in year one
Motion sensors, camera analytics, and IoT devices can detect actual room usage within 2-3 minutes of meeting start time. Automatic release systems free up unused spaces immediately, maximizing availability for spontaneous collaboration.
Motion Detection Systems:
• PIR (Passive Infrared) sensors: $50-80 per room
• Microwave sensors: $80-120 per room
• Dual-technology sensors: $100-150 per room
Camera-Based Analytics:
• People counting algorithms
• Occupancy heat mapping
• Privacy-compliant silhouette detection
• Integration with existing security systems
Environmental Sensors:
• CO2 level monitoring (indicates human presence)
• Temperature fluctuation detection
• Sound level analysis
• Air quality measurements
Sensor data flows through a central processing system that correlates physical occupancy with calendar bookings. When discrepancies are detected, the system triggers automated responses.
Data Flow Process:
1. Sensor detects room status (occupied/vacant)
2. System checks calendar for scheduled meeting
3. If vacant 5+ minutes past start time, release room
4. Send notification to original booker
5. Update room availability in booking system
6. Log event for analytics and reporting
Machine learning algorithms analyze historical patterns to predict likely no-shows before meeting start time. Rooms with 80%+ no-show probability can be pre-released with 15-minute advance notice.
When rooms are auto-released, the system can immediately offer them to teams with pending booking requests or suggest them for overflow meetings.
PhaseDurationActivitiesSuccess MetricsPilot4-6 weeksInstall sensors in 5-10 rooms90%+ detection accuracyRollout8-12 weeksDeploy across all meeting spaces<2% false positivesOptimization4-6 weeksFine-tune algorithms and thresholds95%+ user satisfactionScaleOngoingExpand to additional buildings/floorsMaintain performance metrics
Worklytics provides real-time metrics to track the drivers of employee productivity, enabling rapid testing and learning for sensor optimization. (Worklytics)
Public scorecards tap into natural competitive instincts, creating peer pressure that reduces no-shows more effectively than top-down mandates. Organizations using gamification see 30-40% improvement in room utilization metrics.
Key Performance Indicators:
• No-show rate (primary metric)
• Average booking utilization percentage
• Last-minute cancellation rate
• Room release responsiveness
• Booking accuracy (right-sized rooms for group size)
Visualization Components:
• Monthly department rankings
• Trend charts showing improvement over time
• Individual contributor leaderboards (optional)
• Achievement badges and milestones
• Cost impact calculations
Point System:
• +10 points for attended meetings
• +5 points for timely cancellations (>2 hours advance)
• +15 points for releasing rooms early
• -25 points for no-shows
• -10 points for late cancellations
Team Challenges:
• Monthly "Perfect Attendance" streaks
• Quarterly room utilization competitions
• Cross-department collaboration bonuses
• Sustainability challenges (reducing unnecessary bookings)
Recognition Programs:
• "Room Steward of the Month" awards
• Executive recognition for top-performing teams
• Preferred parking spots for winning departments
• Catered team lunches for achievement milestones
Worklytics offers dashboards and reporting for KPIs across various tools, providing a unified view of team performance. (Worklytics) The platform's real-time analytics enable course corrections before the next quarter, making scorecards more actionable.
Dashboard Features:
• Real-time metric updates
• Drill-down capabilities by team, individual, or time period
• Automated alert systems for concerning trends
• Integration with existing BI tools (Tableau, Power BI)
• Mobile-responsive design for executive visibility
Launch Communication:
• Executive sponsorship and messaging
• Clear explanation of business impact
• Training sessions on new processes
• FAQ documentation and support resources
Ongoing Engagement:
• Weekly metric updates via email or Slack
• Monthly all-hands scorecard reviews
• Quarterly celebration events for top performers
• Continuous feedback collection and system refinement
Artificial intelligence can predict meeting patterns, suggest optimal room assignments, and proactively prevent no-shows by analyzing historical data and user behavior patterns.
ML algorithms analyze factors like:
• Historical attendance patterns by individual
• Meeting type and duration correlations
• Time of day and day of week trends
• Seasonal variations and holiday impacts
• Organizer reliability scores
Smart Room Recommendations:
• Right-sizing suggestions based on actual vs. planned attendance
• Equipment matching for presentation requirements
• Location optimization for attendee convenience
• Backup room suggestions for high-risk bookings
Dynamic Pricing Models:
• Premium rates for high-demand time slots
• Discounts for off-peak bookings
• Penalty multipliers for repeat offenders
• Incentives for flexible scheduling
Data Sources:
• Calendar systems (Exchange, Google Workspace)
• Room booking platforms
• Badge access logs
• Video conferencing usage data
• Employee directory and org chart information
AI Model Training:
• Minimum 6 months historical data for baseline models
• Continuous learning from new booking patterns
• A/B testing for recommendation accuracy
• Regular model retraining and validation
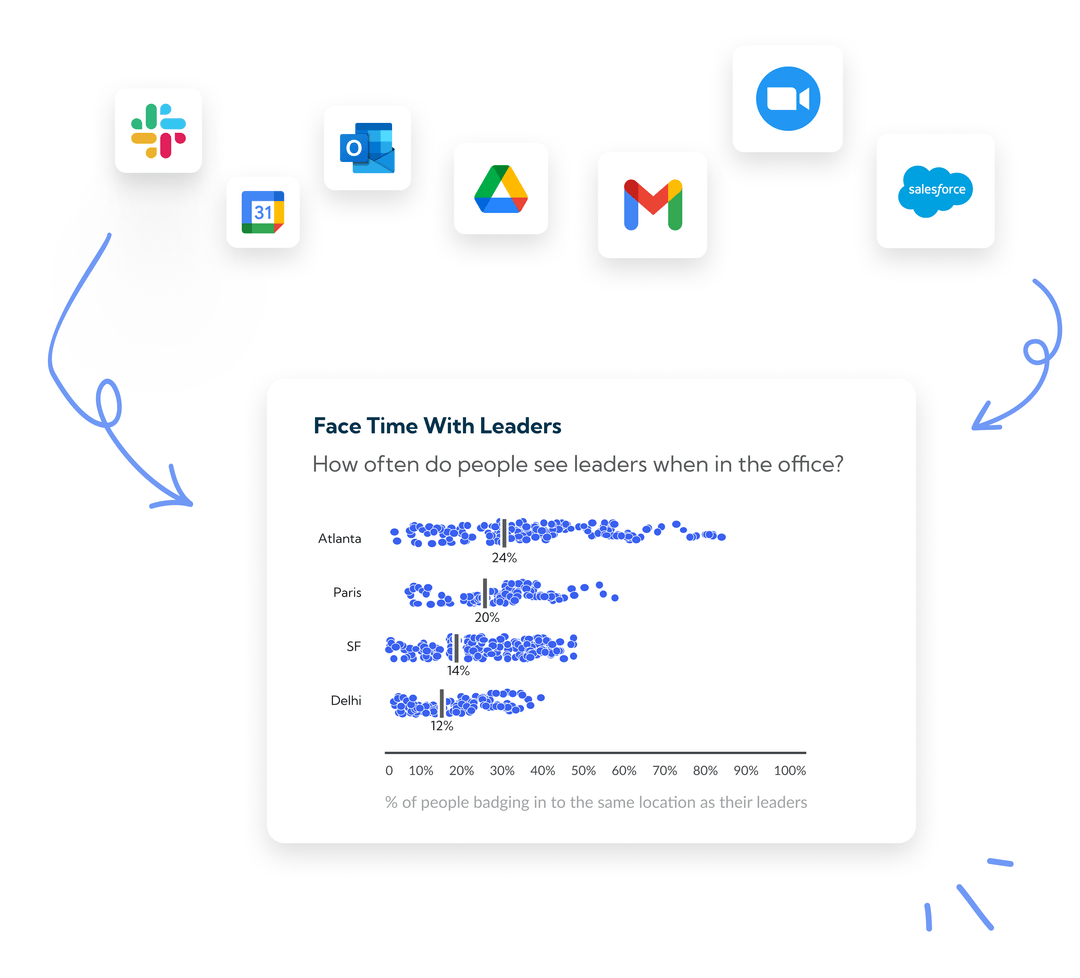
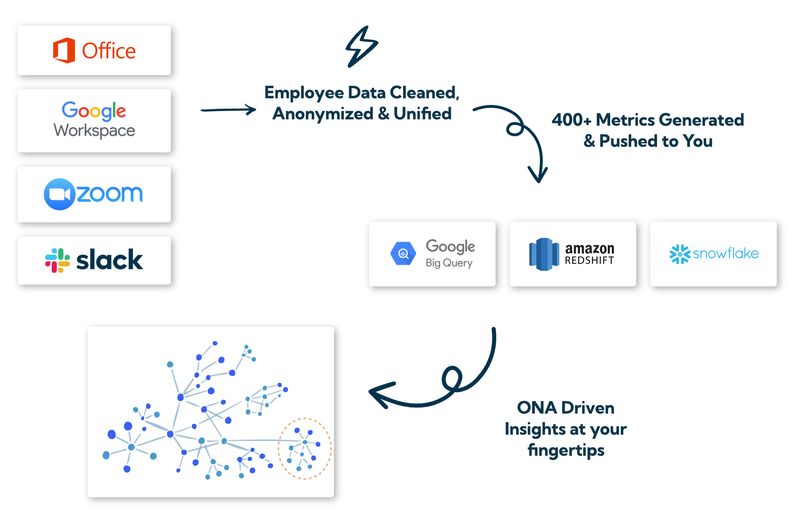
Worklytics integrates with a variety of common applications to analyze team work and collaboration in both remote and office settings. (Worklytics) This comprehensive data integration enables more accurate AI predictions and recommendations.
The platform's privacy-first approach ensures that AI models can learn from aggregated patterns without compromising individual privacy or violating data protection standards.
Investment AreaCost RangeExpected ReturnPayback PeriodAI platform licensing$50,000-150,000/year25-35% no-show reduction8-12 monthsData integration setup$25,000-75,000Improved booking accuracy6-9 monthsModel development$75,000-200,000Predictive optimization12-18 monthsOngoing maintenance$20,000-50,000/yearSustained performanceContinuous
Mobile check-in systems make it effortless for attendees to confirm their presence, cancel last-minute, or modify bookings. Organizations with mobile-first approaches see 25-30% higher engagement rates with room management processes.
One-Tap Actions:
• "I'm here" check-in buttons
• "Running 5 minutes late" notifications
• "Cancel and release room" options
• "Extend meeting by 15 minutes" requests
Location-Based Features:
• Automatic check-in when entering building
• Proximity-based room suggestions
• Navigation assistance to booked rooms
• Parking availability integration
Notification Management:
• Customizable reminder preferences
• Do-not-disturb scheduling
• Emergency override capabilities
• Multi-channel delivery (SMS, push, email)
Platform Considerations:
• Native iOS and Android apps vs. progressive web apps
• Integration with existing corporate mobile device management
• Offline functionality for connectivity issues
• Accessibility compliance (WCAG 2.1 AA)
Backend Requirements:
• Real-time synchronization with calendar systems
• Scalable push notification infrastructure
• Analytics and reporting capabilities
• Security and authentication frameworks
Data Protection:
• End-to-end encryption for all communications
• Minimal data collection principles
• GDPR and CCPA compliance frameworks
• Regular security audits and penetration testing
Access Controls:
• Role-based permissions for different user types
• Multi-factor authentication options
• Device registration and management
• Remote wipe capabilities for lost devices
Pilot Program:
• Start with 50-100 power users
• Gather feedback and iterate quickly
• Document common use cases and pain points
• Build internal champions and advocates
Rollout Phases:
1. Executive team (establish leadership buy-in)
2. IT and facilities teams (ensure technical readiness)
3. Department by department (manageable change management)
4. Company-wide launch (with full support infrastructure)
Integrating room management with existing collaboration platforms (Slack, Teams, Google Workspace) reduces context switching and increases adoption rates by 40-50%.
Bot Commands:
• /book-room 2pm-3pm Conference A for quick reservations
• /room-status to check current availability
• /cancel-booking for last-minute changes
• /find-room 10 people video for smart suggestions
Channel Notifications:
• Automated reminders in team channels
• Room availability updates
• No-show alerts to relevant stakeholders
• Weekly utilization summaries
Workflow Automation:
• Automatic room booking when calendar events are created
• Cross-platform synchronization
• Approval workflows for premium spaces
• Integration with expense reporting systems
Worklytics integrates with Google Calendar data analytics, providing insights that can enhance Teams-based room management. (Worklytics) This integration enables seamless workflow between calendar management and collaboration tools.
Adaptive Cards:
• Rich interactive booking interfaces
• Real-time status updates
• One-click action buttons
• Embedded room photos and amenity lists
Power Platform Connections:
• Power Automate workflows for complex business logic
• Power BI dashboards for executive reporting
• Power Apps for custom booking interfaces
• SharePoint integration for room documentation
Calendar Enhancement:
• Smart room suggestions based on attendee locations
• Automatic equipment booking (projectors, whiteboards)
• Conflict resolution and alternative suggestions
• Integration with Google Meet for hybrid meetings
Apps Script Automation:
• Custom booking rules and validation
• Automated reporting and analytics
• Integration with third-party systems
• Bulk operations and administrative tasks
API Management:
• Rate limiting and throttling controls
• Error handling and retry logic
• Monitoring and alerting systems
• Version control and backward compatibility
User Training:
• Interactive tutorials within collaboration platforms
• Video demonstrations of key features
• Regular "tip of the week" communications
• Peer-to-peer knowledge sharing sessions
Worklytics provides benchmarking tools to measure team performance against industry standards. (Worklytics) These metrics help organizations track progress toward best-in-class utilization rates.
Core KPIs:
MetricIndustry AverageBest-in-ClassMeasurement FrequencyNo-show rate18-25%<10%DailyRoom utilization45-60%>75%WeeklyBooking accuracy70-80%>90%MonthlyUser satisfaction3.2/5>4.2/5QuarterlyCost per seat-hour$12-18<$10Monthly
Secondary Metrics:
• Average booking lead time
• Peak hour availability rates
• Equipment utilization percentages
• Energy consumption per occupied hour
• Maintenance request frequency
Predictive Indicators:
• No-show probability scores
• Demand forecasting accuracy
• Seasonal trend analysis
• Department-specific patterns
• Individual behavior predictions
Operational Efficiency:
• Time to resolve booking conflicts
• System uptime and reliability
• User support ticket volume
• Integration error rates
• Data synchronization delays
Worklytics offers dashboards and reporting for KPIs across various tools, providing a unified view of meeting effectiveness. (Worklytics) The platform's real-time analytics enable rapid course corrections and continuous improvement.
Executive Dashboards:
• High-level trend summaries
• Cost impact calculations
• Comparative benchmarking
• ROI tracking and projections
• Strategic recommendation summaries
Operational Reports:
• Daily utilization summaries
• Exception alerts and notifications
• Maintenance scheduling optimization
• Capacity planning recommendations
• User behavior analysis
Assessment and Planning:
• Current state analysis of room utilization
• Technology audit and integration requirements
• Stakeholder alignment and change management planning
• Budget approval and resource allocation
• Vendor selection and contract negotiation
Quick Wins:
• Implement basic reminder systems
• Deploy simple penalty structures
• Launch departmental scorecards
• Begin user education campaigns
Infrastructure Setup:
• Sensor installation and calibration
• Software integration and testing
• Mobile app development and deployment
• AI model training and validation
• Security and compliance verification
Pilot Testing:
• Limited rollout to select departments
• User feedback collection and analysis
• System performance monitoring
• Bug fixes and optimization
• Training material refinement
Company-Wide Deployment:
• Phased rollout by department or building
• Comprehensive user training programs
• Support system establishment
• Performance monitoring and optimization
• Continuous improvement processes
Success Measurement:
• KPI tracking and reporting
• ROI calculation and validation
• User satisfaction surveys
• Benchmark comparison analysis
• Strategic planning for next phase
Advanced Features:
• AI-powered predictive analytics
• Cross-building optimization
• Integration with additional systems
• Advanced reporting and visualization
• Continuous learning and adaptation
Expansion Opportunities:
• Hot-desking and flexible workspace management
• Visitor management integration
• Sustainability and energy optimization
• Workplace experience enhancement
• Strategic space planning support
Most organizations struggle with connecting disparate systems (calendar platforms, room booking software, sensor networks, collaboration tools). Success requires dedicated technical resources and careful API management.
Inconsistent room naming conventions, outdated equipment lists, and incomplete user profiles can undermine automation efforts. Establish data governance standards before deploying advanced features.
Solutions that work for 50 rooms may fail at 500 rooms. Design architecture with growth in mind.
Most companies experience an industry-standard meeting room no-show rate of 18-25%, which they often accept as inevitable. However, best-in-class organizations use data-driven tactics to achieve sub-10% rates, demonstrating that significant improvement is possible with the right strategies.
Meeting room no-shows drain organizational productivity and real estate ROI far beyond just wasted square footage. They create scheduling conflicts, reduce available meeting spaces for other teams, and represent a significant hidden cost in terms of underutilized office real estate investments.
Key performance indicators for meeting room optimization include no-show rates, actual vs. booked meeting duration, room occupancy percentages, and booking-to-usage ratios. According to Worklytics' meeting effectiveness research, tracking these metrics provides real-time visibility into how meeting spaces are utilized across an organization.
Meeting analytics platforms like Worklytics provide real-time metrics to identify patterns in meeting behavior and room usage. These tools enable rapid testing and learning, allowing organizations to implement course corrections and optimize meeting habits before problems compound over quarters.
Taking attendance at meetings, even when not required, creates accountability and awareness around meeting participation. This practice helps identify chronic no-show patterns and enables managers to address attendance issues proactively, ultimately improving overall meeting culture and room utilization.
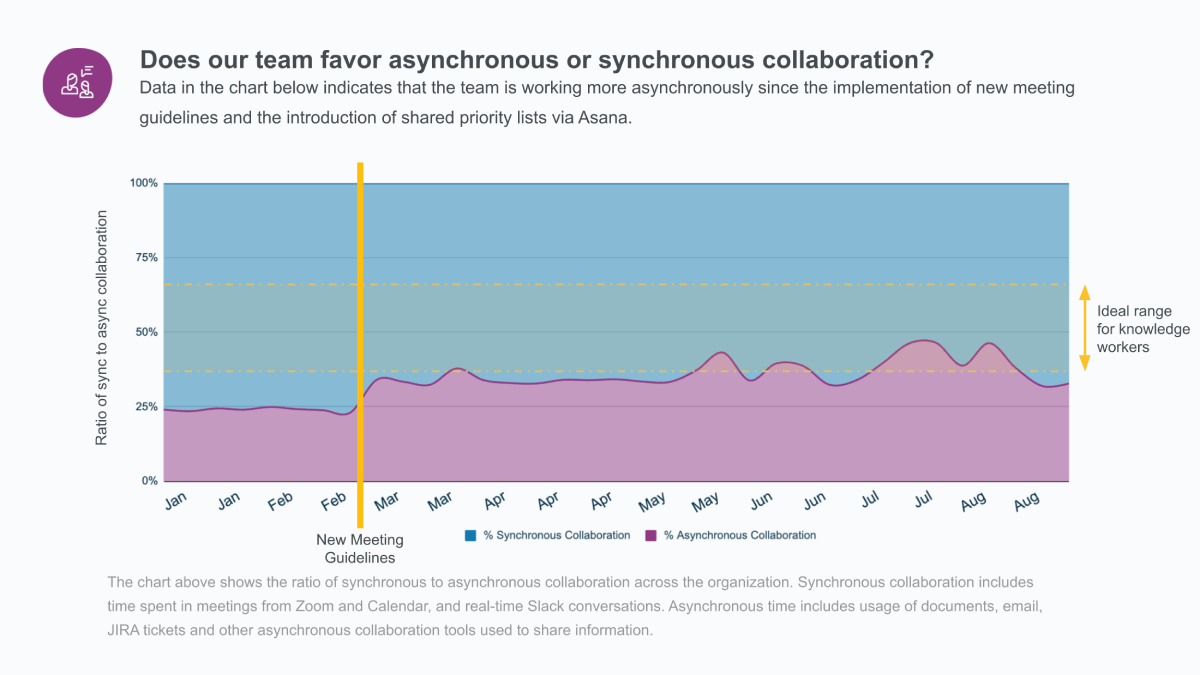
Hybrid work environments have made meeting room management more complex, as calendars become "battlegrounds where collaboration clashes with focus time." This leads to overbooked teams and increased no-show rates as employees struggle to balance in-person and remote meeting commitments effectively.
1. https://www.worklytics.co/blog/5-simple-ways-to-make-meetings-more-productive
3. https://www.worklytics.co/blog/too-many-meetings-will-kill-your-company
4. https://www.worklytics.co/integrations
5. https://www.worklytics.co/integrations/google-calendar-data-analytics
6. https://www.worklytics.co/meeting-effectiveness


