Quick answer: In the U.S., 52% of employees use AI at work at least a few times a year, 30% use it a few times a week or more and 15% use it daily, according to Gallup's May 2026 data. The AI tool adoption rate by industry is highest in technology (77% any use, late 2025) and lowest in retail (33%). Surveys disagree because they count different things, so compare your number only with a benchmark that counts the same way.
Sooner or later someone asks whether your company's AI use is normal. This page collects the best public AI adoption statistics by industry, role and company size, explains why they disagree, and shows how to measure your own organization so the comparison is fair. It is written for HR, IT and people analytics leaders who need a number they can defend in a meeting.
Every figure names its source, date and who was surveyed. Where public data does not exist, such as AI use for each department, the page says so instead of filling the gap. Most of these AI in the workplace statistics come from Gallup's quarterly survey of U.S. employees, with figures from the Census Bureau, the Federal Reserve and Pew Research Center alongside. We refresh this page each year at the same address.
These are the main public measures of workplace AI use. They are not directly comparable, and the next section explains why.
| What was measured | Result | Source and date |
|---|---|---|
| U.S. employees who use AI at work a few times a year or more | 52% | Gallup, May 2026 |
| U.S. employees who use AI a few times a week or more | 30% | Gallup, May 2026 |
| U.S. employees who use AI every day | 15% | Gallup, May 2026 |
| Employees who say their organization has integrated AI tools | 47% | Gallup, May 2026 |
| Employees who say their organization has communicated a clear plan for using AI | 25% | Gallup, May 2026 |
| Workers who say at least some of their work is done with AI | 21%, up from 16% about a year earlier | Pew Research Center survey, September 2025 |
| Workers who used generative AI for work: any use, at least once last week, daily last week | 40.7%, 35.2%, 12% | Real-Time Population Survey, November 2025, reported in a Federal Reserve note |
| U.S. businesses that used AI in any business function in the past two weeks | 23.8% (up from 19.5% in the two weeks ending May 3) | Census Bureau Business Trends and Outlook Survey, two weeks ending September 20, 2026 |
The Federal Reserve lined up three public surveys in an April 2026 note and got 18%, 41% and 78%. None of them is wrong. They answer different questions.
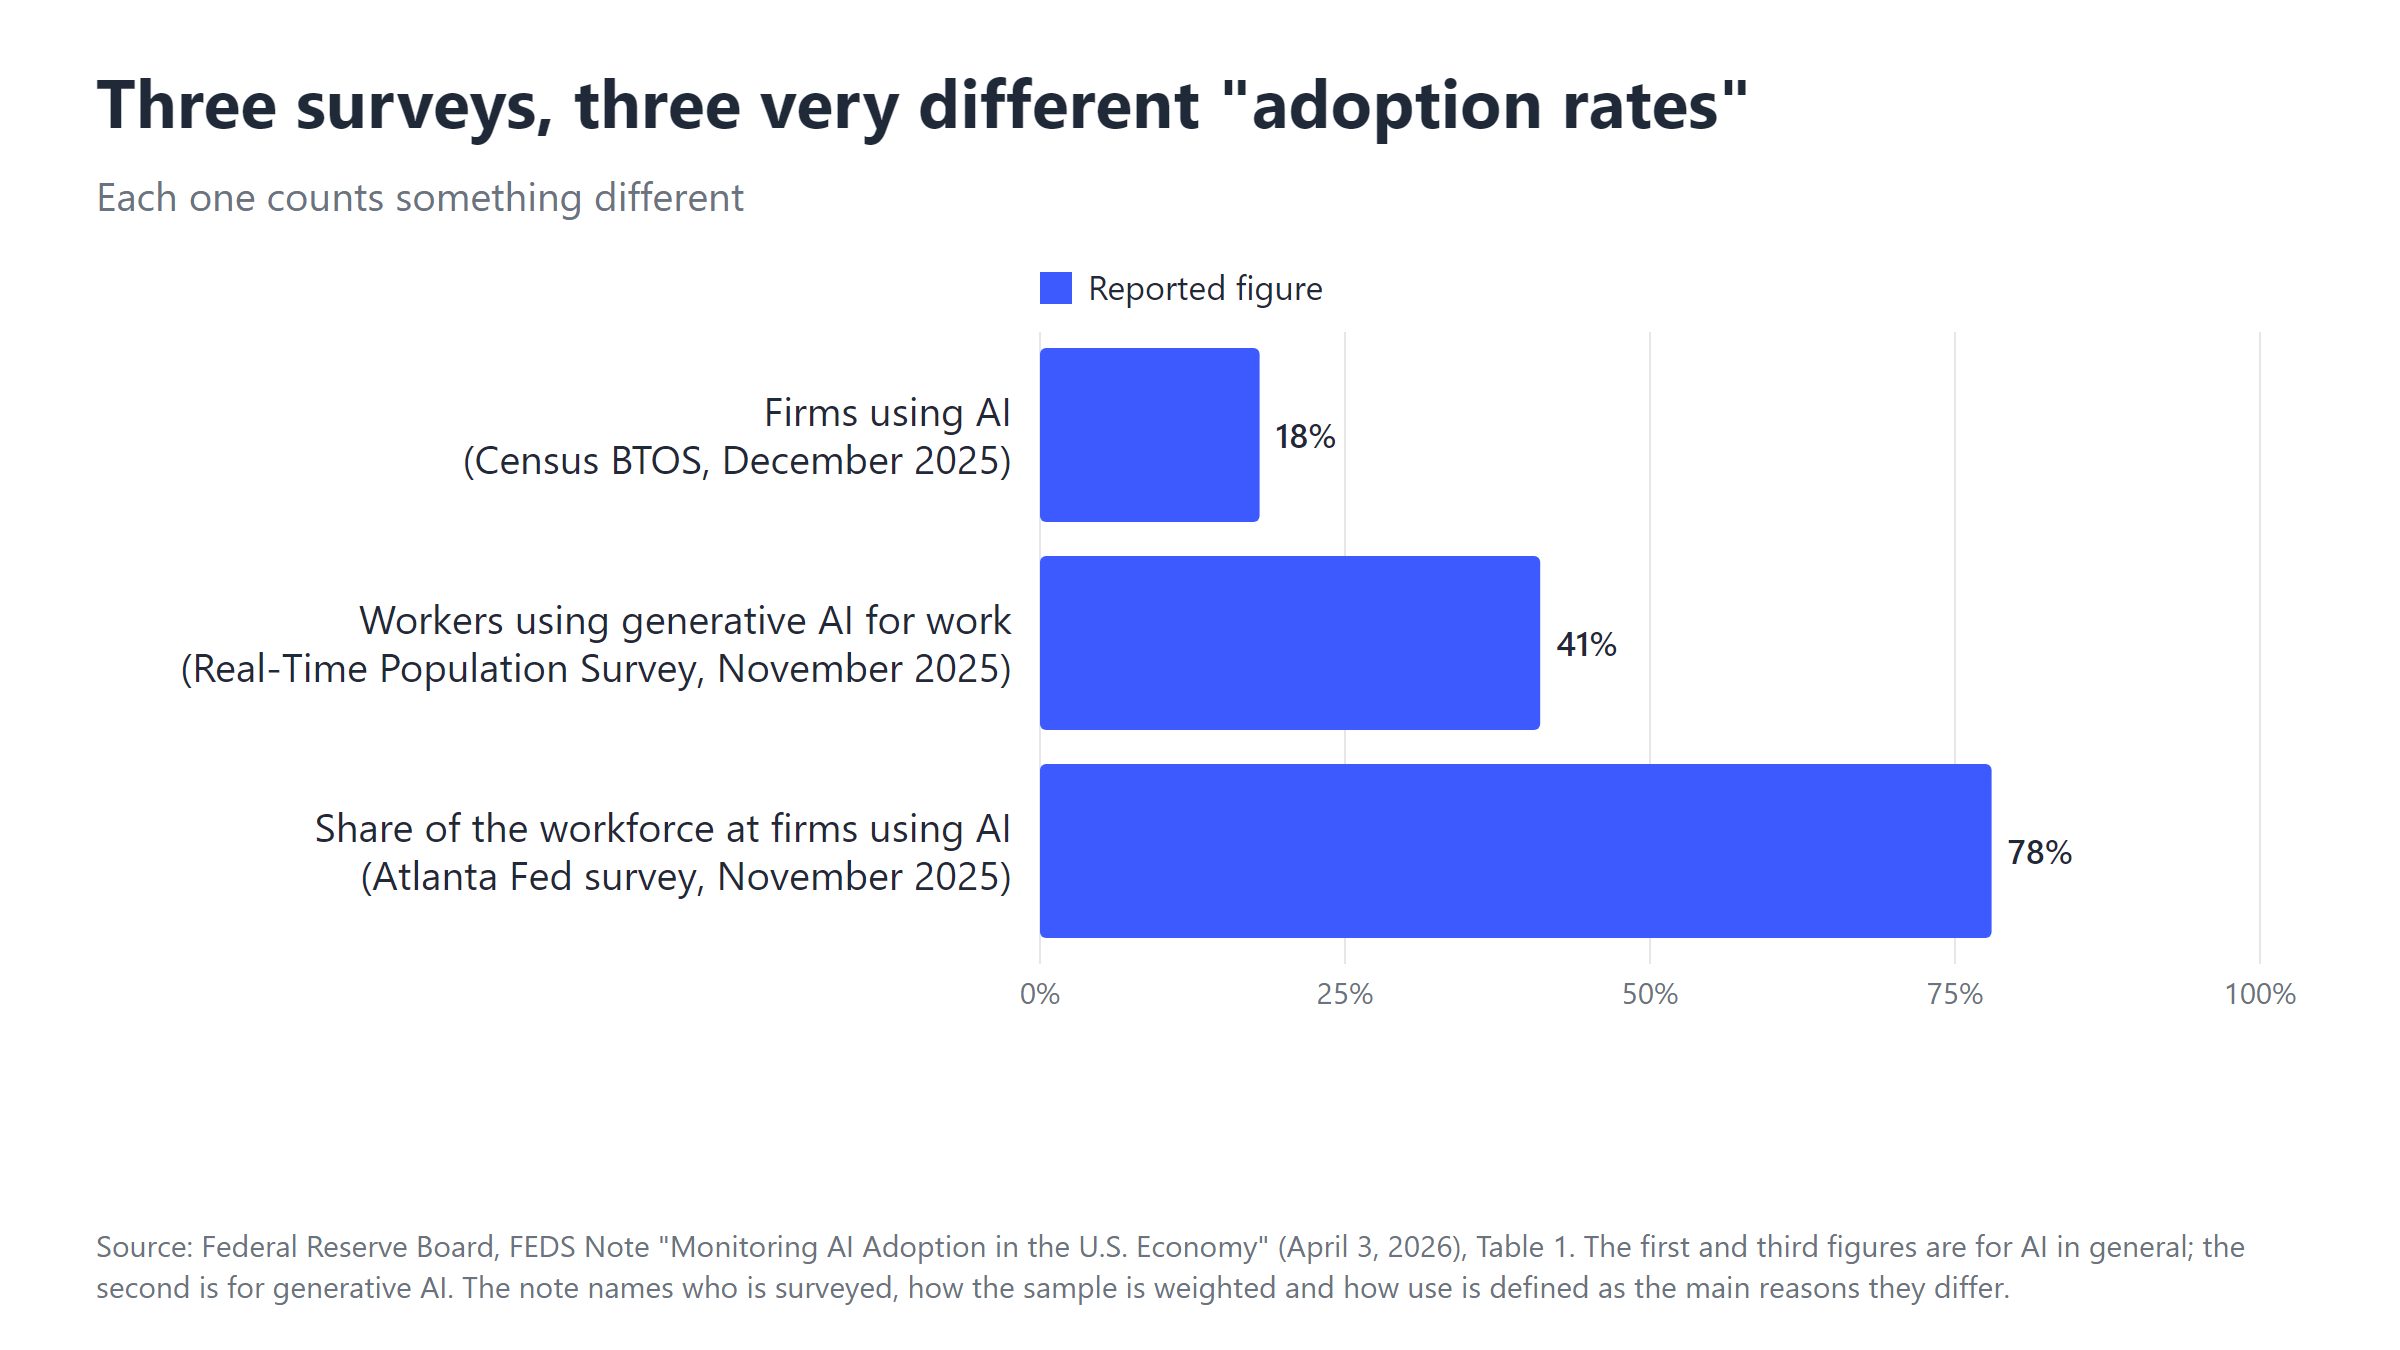
The Federal Reserve note says the biggest driver is likely who is surveyed and how the sample is built. It names three other factors that may also play a part.
One more detail from the note: on generative AI alone, the Atlanta Fed survey (54% of the workforce at firms that use large language models, the technology behind chat assistants) and the worker survey (41%) are closer than the headline figures suggest. The widest gap is between both of them and the Census count of firms.
A rule for any benchmark: before you compare your number with one, check that both count the same people, over the same period, at the same level of use. Gallup, for example, counts an employee as a user at a few times a year, while its frequent measure starts at a few times a week.

Gallup tracks this in a quarterly survey of employed U.S. adults, with public figures back to May 2023. Between May 2023 and May 2026, the share using AI at least a few times a year rose from 21% to 52%. The share using it a few times a week or more went from 11% to 30%, and daily use went from 4% to 15%.
Growth has not been even. Total use was flat in the fourth quarter of 2025, in Gallup's words (45% in the third quarter, 46% in the fourth), while use a few times a week or more kept rising from 23% to 26%. Gallup described it as use deepening in some groups even as overall adoption slowed. By May 2026, total use had reached 52%.
The line you draw changes the answer. 52% use AI a few times a year, but only 15% use it every day. When a report says "adoption rate," ask which line it uses.
Owning a tool is not the same as using it. In May 2026, 47% of employees said their organization has integrated AI tools, but 30% used AI a few times a week or more. Gallup calls this the integration-adoption lag and says implementation does not guarantee use. Only 25% said their organization had communicated a clear plan for using AI.
Industry shows some of the widest gaps in AI use. The clearest public view of the AI adoption rate by industry comes from Gallup's survey of employees. It measures people, not companies.

| Industry | Any use, Q4 2025 | A few times a week or more, Q4 2025 | Daily, Q4 2025 | Daily, May 2026 |
|---|---|---|---|---|
| Technology | 77% | 57% | 31% | 42% |
| Finance | 64% | not given | not given | 27% |
| Professional services | 62% | 36% | 16% | 22% |
| College or university | 63% | not given | not given | 9% to 15% |
| K-12 education | 56% | not given | not given | 9% to 15% |
| Community services, government, healthcare and manufacturing | 41% to 43% (one range for all four) | not given | not given | 9% to 15% |
| Retail | 33% | 19% | 10% | 9% to 15% |
Source: Gallup's fourth quarter 2025 survey (22,368 employed U.S. adults, October 30 to November 14, 2025) and the Gallup AI indicator for May 2026. "Not given" means Gallup did not publish that figure in the text of its release. For May 2026, Gallup names only the top three industries for daily use and gives one 9% to 15% range for the other seven.
Technology leads on every Gallup measure shown here. In the fourth quarter of 2025, 77% of technology employees used AI at least a few times a year and 57% used it a few times a week or more. By May 2026, 42% used it daily. Gallup noted that growth in total users in technology is leveling off (76% to 77% in the fourth quarter) while frequent use rose from 50% to 57%, so the gains came mostly from people who already used AI.
Both sit well above Gallup's 46% overall average for the fourth quarter of 2025, and both gained quickly in the fourth quarter of 2025: finance rose six points and professional services five. In May 2026, 27% of finance employees and 22% of professional services employees used AI daily.
The measure matters here. In the Federal Reserve note, about 33% of professional services firms used AI in the Census survey at the end of 2025, while 62% of professional services workers said they used generative AI for work in the Real-Time Population Survey. The same sector looks like a third or nearly two thirds depending on whether you count firms or people, and the two surveys also define use differently.
Gallup groups community services, government, healthcare and manufacturing in one range of 41% to 43% for any use in the fourth quarter of 2025, and publishes no separate figure for each, so this page does not invent one. Manufacturing rose three points that quarter. In the Real-Time Population Survey, manufacturing had the strongest year-on-year growth in work-related generative AI use among the five industries the Fed note charts, about 58% (14.5 percentage points).
Retail is the lowest in Gallup's list: 33% any use, 19% a few times a week or more and 10% daily in late 2025, with no increase in the fourth quarter. The Census Bureau found 16.8% of retail trade businesses using AI in the two weeks ending September 20, 2026, against 23.8% of all businesses.
Many readers ask how their sales, HR or engineering teams compare. We did not find a public survey that reports AI use for each department, and widely shared tables that give a number for every team rarely name a source, so this page does not repeat them. Your own data is the better benchmark, and these steps show how to build it.
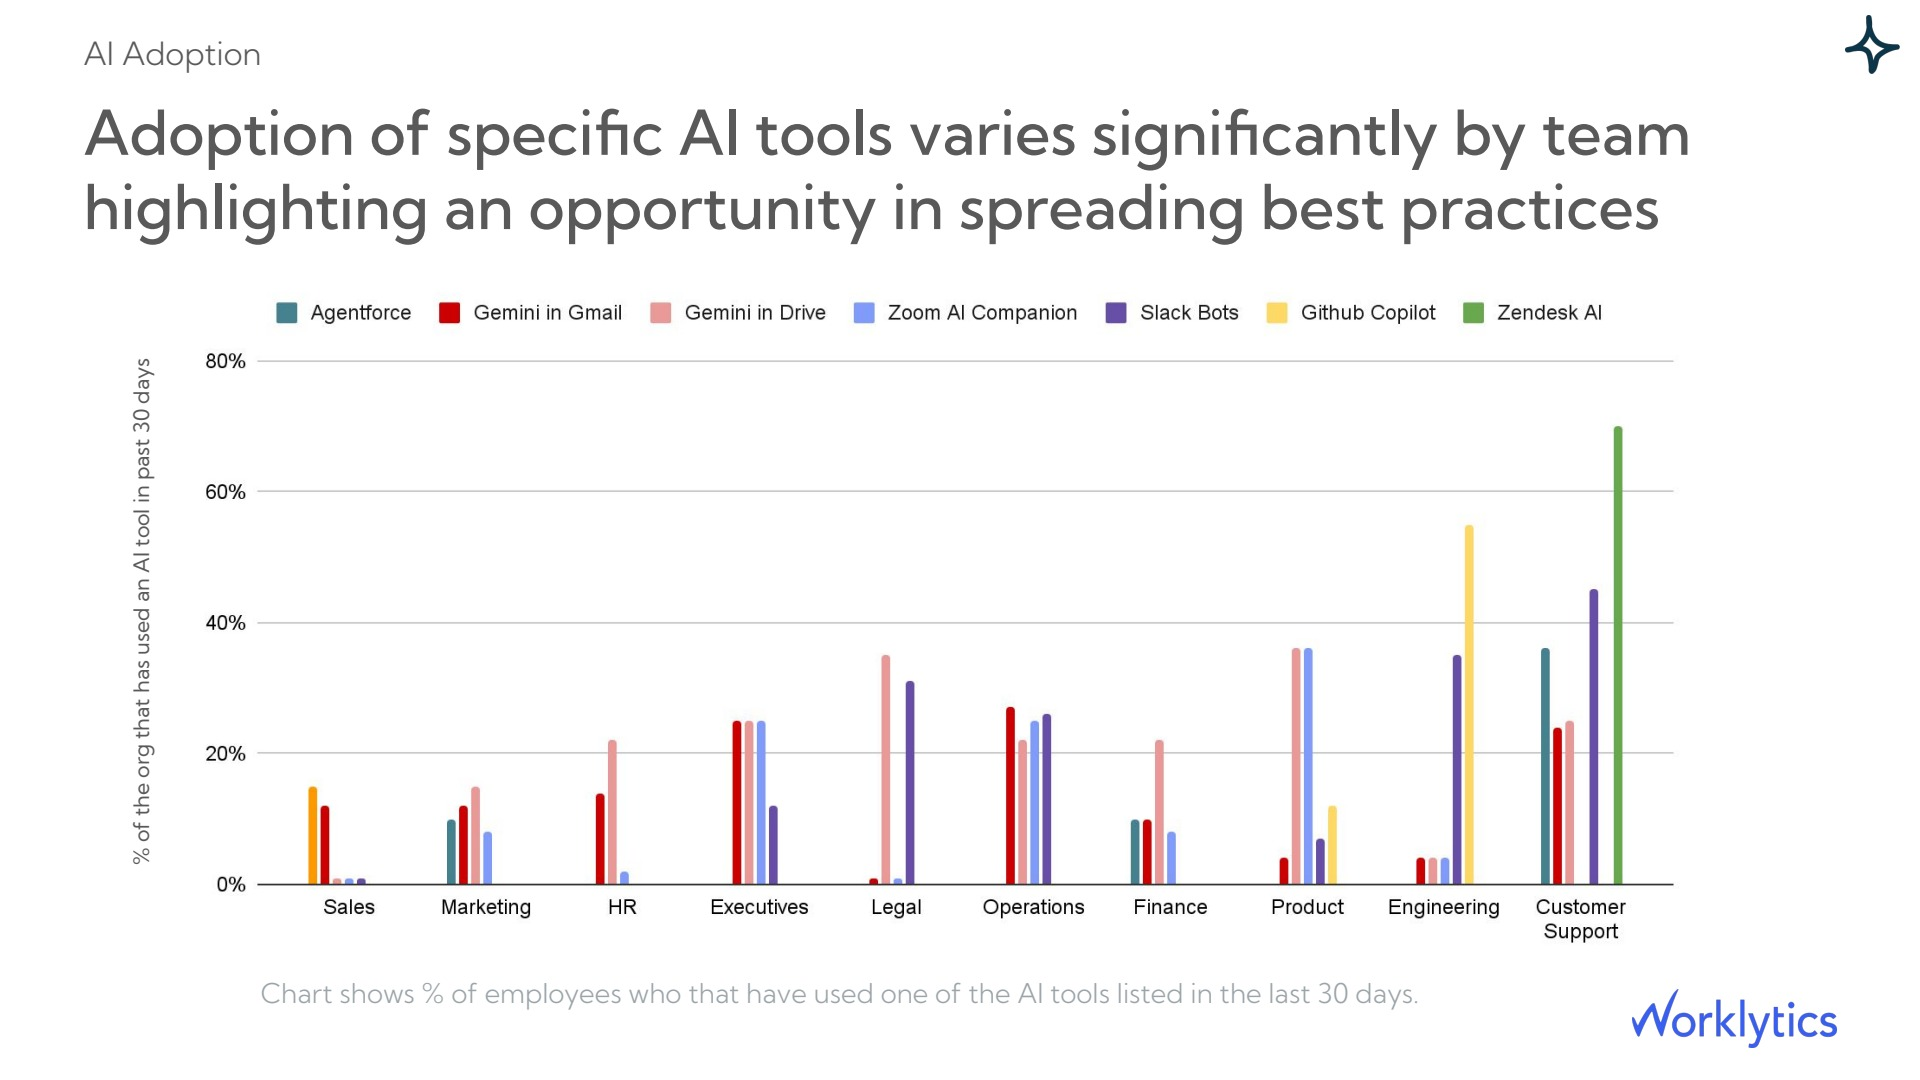
To split usage by team and role, see this guide to tracking AI adoption by team and role.

Use rises with seniority. In Gallup's fourth quarter 2025 survey, 69% of leaders used AI at least a few times a year, compared with 55% of managers and 40% of individual contributors. Frequent use, a few times a week or more, was 44%, 30% and 23%. Gallup says part of the gap reflects role type, because leaders more often hold office-based, remote-capable jobs where AI tools are easier to apply.
Job type matters on its own. In the same Gallup article, 66% of employees in remote-capable roles (roles that could reasonably be done remotely) used AI, compared with 32% in roles that are not. Use a few times a week or more was 40% against 17%, and daily use 19% against 7%.
Pew Research Center's September 2025 survey found a similar split by education. Among workers with at least a bachelor's degree, 28% said at least some of their work is done with AI, up from 20% about a year earlier. Among workers with some college or less, it was 16%, up from 13%.
Gallup's AI indicator reports that employees whose managers actively support AI use are nearly twice as likely to use it frequently. Yet only 36% of employees in organizations that are integrating AI strongly agree that their manager supports their team's use of AI.
Larger firms report higher use. In the Business Trends and Outlook Survey, 37% of firms with at least 250 employees used AI, according to the Census Bureau's May 2026 analysis. For firms with 100 to 249 employees, the share was 32% in the period ending May 3, 2026. Fewer than 20% of firms with four or fewer employees used AI. Between December 2025 and May 2026, use rose among firms with at least 20 employees but did not change significantly among smaller ones. These are the latest firm-size figures in the Census Bureau's published analysis. They count firms, not employees, and the all-business rate has since risen from 19.5% to 23.8%.
A benchmark is only useful if you measure the same way. Start with a definition: AI adoption rate = employees who used an AI tool in a set period, divided by employees who have access to an AI tool, times 100. Choose the period first. A common choice is 28 days for adoption and 7 days for weekly use, but any period works if you keep it the same.
A company gives 500 employees access to an AI assistant. In the last 28 days, 275 used it at least once, so the adoption rate is 55%. On three or more days in the last 7, 130 used it, so frequent use is 26%. On every workday last week, 45 used it, so near-daily use is 9%.
Compare the 26% with Gallup's 30% for "a few times a week or more." It looks slightly lower, but the two are not exactly alike. Gallup does not turn "a few times a week" into a number of days, and it divides by all employees, including people with no AI tools, while the company divides only by people with access. Because the company's base is the narrower, more AI-ready group, its real position against a like-for-like benchmark is probably weaker than the 4-point gap suggests.
Worklytics's public data dictionary lists the AI usage measures it produces from the logs of connected tools: the days AI was used, the number of uses, results by type of tool (chat, coding, AI built into other software, sales and search tools) and the share of workday blocks in a week with AI use. The days and uses counts also come in 28-day versions.
The company states that it does not store or analyze work content, only log data, and it aggregates results to the group level. That means it can show that people used an AI tool, but not what they asked it or whether the answer helped. It also sees only the tools you connect, so personal accounts stay out of view.
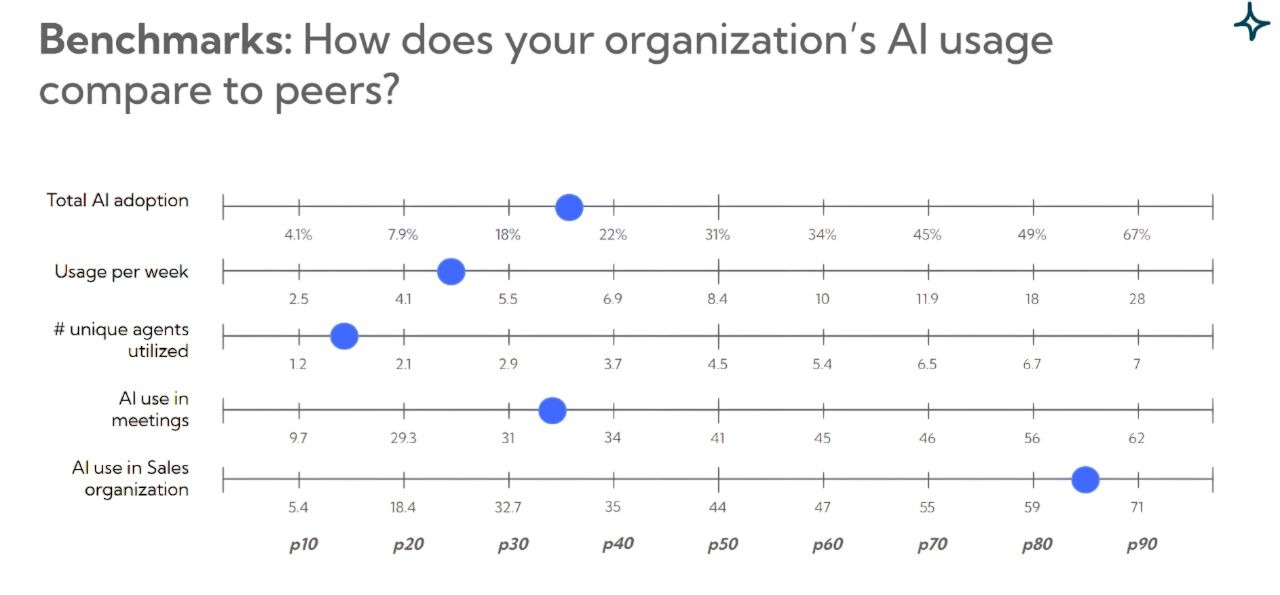
For the full list of AI adoption KPIs and how to read them, see AI adoption KPIs: which metrics actually matter.
Set targets from your own baseline, then check them against outside reference points. This table collects Gallup's frequent-use figures, the share using AI a few times a week or more.
| Reference point | Uses AI a few times a week or more | Date |
|---|---|---|
| All U.S. employees | 30% | May 2026 |
| Technology | 57% | Q4 2025 |
| Professional services | 36% | Q4 2025 |
| Retail | 19% | Q4 2025 |
| Leaders | 44% | Q4 2025 |
| Managers | 30% | Q4 2025 |
| Individual contributors | 23% | Q4 2025 |
Source: Gallup, May 2026 (all employees) and the fourth quarter of 2025 (industries and job levels). These rules are Worklytics planning suggestions, not measured benchmarks:
Here is an example objective. Replace the numbers with your own. Objective: more of the people who have AI tools use them every week. Key result 1: weekly use among employees with access rises from 26% to 40% in six months. Key result 2: no team sits more than 15 points below the company average. Key result 3: at least half of managers use AI weekly. Check the numbers monthly and reset the targets after six months.
High use does not prove AI is helping. In Gallup's May 2026 data, 65% of employees in organizations that have implemented AI said it has had a positive effect on their productivity and efficiency, including 17% who said extremely positive. But only 14% strongly agreed that AI has transformed how work gets done in their organization. Gallup reads that as AI improving work inside existing workflows, not changing it. Both figures are self-reported.
To connect adoption to results you can measure, see is AI actually saving time in your company.
Worklytics for AI adoption measures AI use by team and role from the logs of corporate tools such as Slack, Microsoft Copilot, Gemini and Zoom, and says it can compare adoption across teams, over time and against industry benchmarks. It does not analyze work content, and it covers only the tools you connect.
Gallup's AI indicator (data through May 2026) and its January 2026 article on the fourth quarter of 2025. The U.S. Census Bureau's Business Trends and Outlook Survey (national and sector figures from the data release published October 8, 2026, covering the two weeks ending September 20, 2026; firm-size figures from the Census analysis published May 26, 2026, covering data through May 3, 2026). The Federal Reserve Board note "Monitoring AI Adoption in the US Economy" (April 3, 2026). Pew Research Center, "About 1 in 5 U.S. workers now use AI in their job" (survey September 2 to 8, 2025, 5,010 workers).
In the United States, 52% of employees use AI at work at least a few times a year, 30% use it a few times a week or more, and 15% use it daily, according to Gallup's May 2026 data. Other surveys report different numbers because they count different things. Pew Research Center found that 21% of workers said at least some of their work is done with AI in September 2025.
There is no single good rate, because it depends on who has AI tools and how you define use. A useful starting point is the U.S. average of 30% of employees using AI a few times a week or more (Gallup, May 2026), then the figure for your industry: 57% in technology, 36% in professional services and 19% in retail in late 2025. Match the definition before you compare.
Technology leads. In Gallup's late 2025 survey, 77% of technology employees used AI at least a few times a year, followed by finance (64%), college and university staff (63%) and professional services (62%). Retail was lowest at 33%. In the Census Bureau's survey of businesses, the information sector (50.2%) led, followed by professional, scientific and technical services (42.7%) and finance and insurance (40.1%), in the two weeks ending September 20, 2026.
The main public ones are Gallup's quarterly survey of U.S. employees, which reports AI use by industry, and the Census Bureau's Business Trends and Outlook Survey, which reports business AI use by sector and firm size. They measure different things: Gallup counts employees and the Census Bureau counts firms, so do not mix their figures in one comparison.
Count only employees who have access to an AI tool, use one definition of use for every team, and compare each team with your company average before you look at outside numbers. We did not find a public survey that reports AI use for each department, so your own monthly trend is the most reliable benchmark.
No public survey describes what leading companies do, so this page does not claim a standard practice. A workable approach has two layers. Adoption shows who uses AI and how often, and usage logs can measure it. Performance shows what changed in results, and it needs outcome data you already track, such as time to finish work or quality checks. Start with adoption, then compare it with those results.
They measure different things. A Federal Reserve note found 18% of firms using AI in one survey, 41% of workers using generative AI for work in another and 78% of the workforce at firms using AI in a third, all in late 2025. The note says who is surveyed and how the sample is weighted is likely the biggest driver, and names question wording, who answers and what people want to report as other possible factors.
Count usage signals instead of content: whether someone used an AI tool, on how many days and in which tools. Worklytics does this from usage logs and states that it does not analyze work content. Tell employees what is measured and report by team, not by person.