


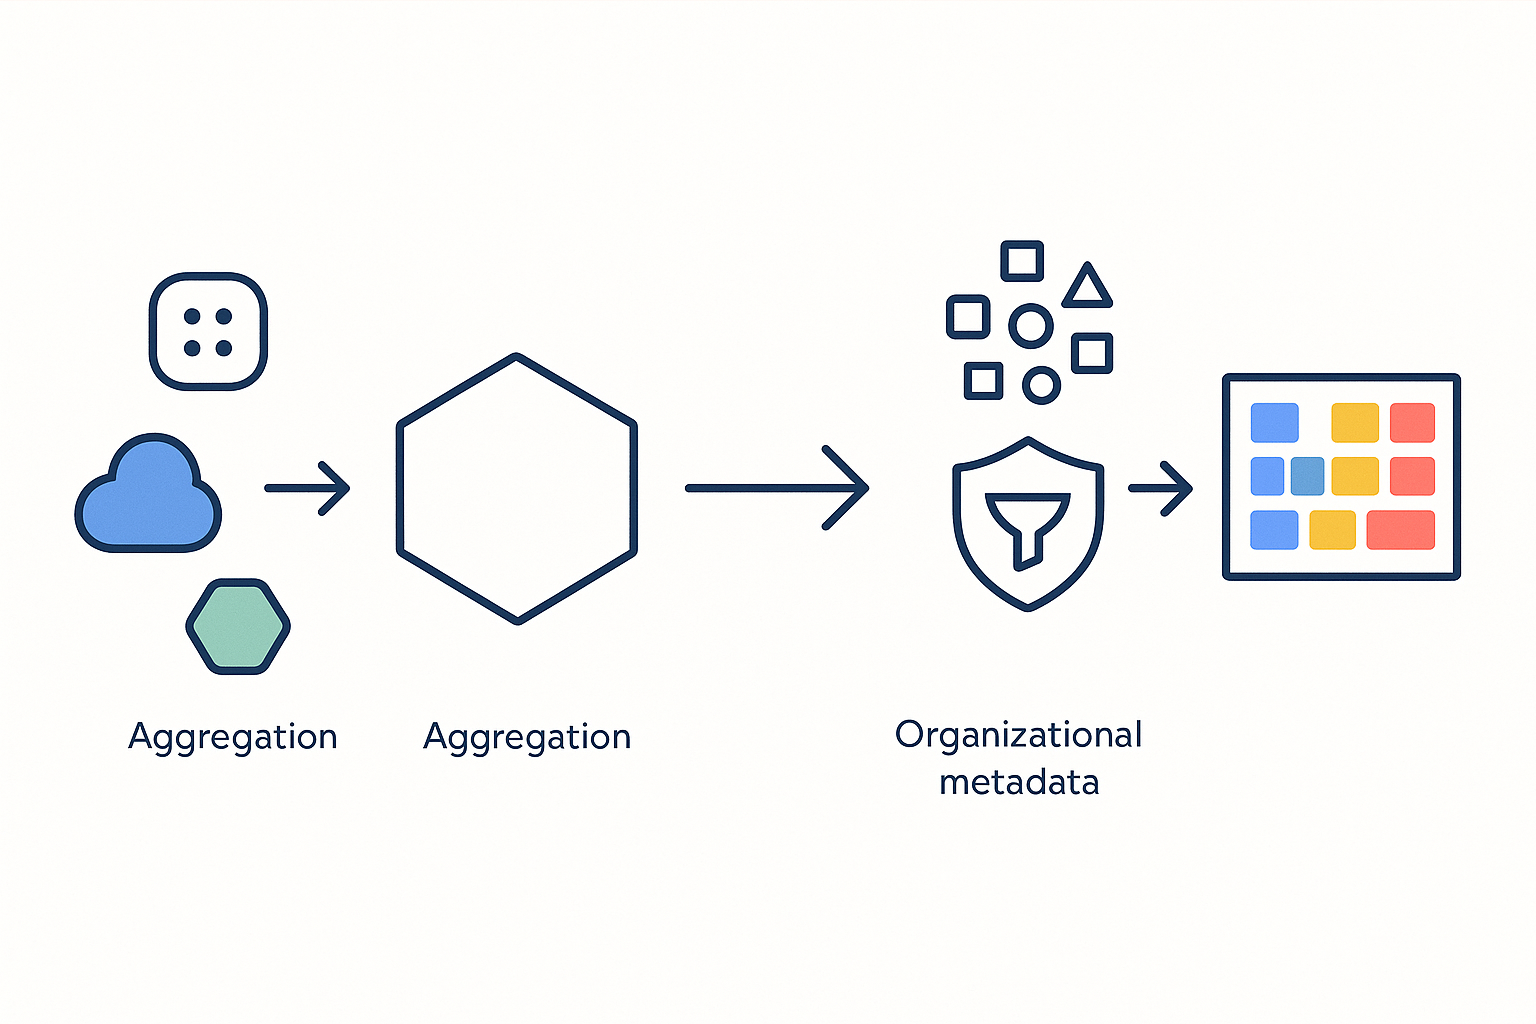
Worklytics creates department-level GenAI adoption heatmaps by aggregating usage telemetry from 25+ collaboration tools including Microsoft 365 Copilot, GitHub Copilot, and Slack AI, then mapping this data to organizational structures. The platform transforms scattered usage logs into visual intelligence through color-coded grids that instantly reveal adoption patterns, helping executives identify which departments lead AI transformation and which need targeted intervention.
• While 80% of companies leverage generative AI, only 14% have adequate visibility into actual usage patterns across departments
• GenAI adoption heatmaps layer usage telemetry over organizational metadata to reveal adoption intensity through color gradients and time-series overlays
• Worklytics integrates with Microsoft 365, GitHub, Slack, and Google Workspace to create unified dashboards that update in real-time
• Privacy-preserving techniques including differential privacy and aggregation thresholds ensure GDPR and EU AI Act compliance
• A Fortune 500 company achieved 28% adoption lift within one quarter after deploying Worklytics heatmaps to identify and address departmental gaps
• Native vendor dashboards like Microsoft Viva Insights only show single-platform usage, missing cross-functional AI adoption patterns
Leaders finally have the tools to turn raw GenAI telemetry into clear GenAI adoption heatmaps - and that new visibility is reshaping rollout playbooks.
The generative AI revolution has arrived in the workplace with unprecedented speed. According to recent surveys, 80 % of companies are leveraging generative AI, transforming how teams collaborate, create, and deliver results. Yet this widespread adoption comes with a critical blind spot that threatens to derail AI initiatives before they deliver promised value.
A GenAI adoption heatmap transforms scattered usage data into visual intelligence. These heatmaps layer telemetry from tools like Microsoft 365 Copilot, GitHub Copilot, and Slack AI over organizational metadata - department, role, location - creating a grid that instantly reveals which teams are scaling AI adoption and which are falling behind. Unlike generic dashboards that show simple usage counts, heatmaps reveal the nuanced patterns of innovation across your organization.
The stakes for getting this visibility right have never been higher. As one LeanIX survey revealed: "90 % of IT experts say they need a clear view of AI use in their organizations." Yet the reality falls far short of this need. Use of generative AI has nearly doubled in just six months, with 75% of global knowledge workers now using these tools regularly. Organizations that can't see how AI spreads through their departments risk creating digital divides between teams, duplicating efforts across silos, and missing the chance to scale successful AI use cases enterprise-wide.
The visibility gap in AI adoption represents one of the most striking disconnects in modern enterprise technology. While 80 % of companies are leveraging generative AI, a mere 14 % say they actually have the overview of AI that they need. This isn't just a technical problem - it's an organizational crisis hiding in plain sight.
The roots of this blindness run deep. Only 44% of CIOs are deemed by their CEOs to be "AI-savvy," revealing that even technology leaders struggle to grasp the full scope of AI deployment across their organizations. This knowledge gap cascades down through the organization, creating pockets of shadow AI usage that operate outside of governance frameworks and best practices.
The consequences of poor visibility compound quickly. 85% of organizations increased their investment in AI in the past 12 months, yet most struggle to demonstrate ROI because they can't connect usage patterns to business outcomes. Without department-level visibility, leaders can't identify which teams are achieving productivity gains, which are struggling with adoption, or where targeted training could unlock dormant potential. The result is a massive investment in AI infrastructure and licenses that delivers fragmented value because no one can see the complete picture of how AI tools are actually being used across the enterprise.
A GenAI adoption heatmap functions as a multi-layered visualization system that aggregates usage signals from across your AI tool ecosystem. At its foundation, the heatmap pulls telemetry data from platforms like Microsoft 365 Copilot adoption report, which tracks usage across Word, Excel, Teams, and PowerPoint, providing granular metrics on feature adoption and user engagement patterns.
The technical architecture combines three critical data streams. First, API connectors pull usage metrics directly from AI platforms - Microsoft Graph API for Copilot data, GitHub's metrics API for developer AI adoption, and Slack's analytics endpoints for collaboration AI. Second, these raw signals get enriched with organizational context from HRIS systems, mapping usage to departments, roles, and reporting structures. Third, the aggregation layer applies privacy-preserving transformations, ensuring individual activities remain anonymous while departmental patterns become visible.
The visual output transforms complexity into clarity. Color gradients reveal adoption intensity - deep reds flag departments with minimal engagement while vibrant greens highlight AI champions. Time-series overlays show adoption velocity, distinguishing between teams that adopted early and plateaued versus those showing accelerating growth. Monitor engaged users over time becomes intuitive when department-level data flows into interactive Power BI dashboards that executives can explore without technical expertise. This combination of data depth and visual simplicity enables leaders to spot patterns invisible in spreadsheets - like how engineering teams might show high GitHub Copilot adoption while their product management counterparts lag in Microsoft 365 Copilot usage, revealing opportunities for cross-functional knowledge transfer.
Worklytics transforms the complex challenge of AI adoption tracking into a streamlined implementation that typically deploys within days, not months. The platform integrates with 25+ collaboration tools, including Microsoft 365, GitHub, Slack, Google Workspace, and Zoom, creating a unified view of AI adoption that captures how different departments leverage various AI capabilities across their entire digital workspace.
The implementation process follows a proven four-step framework. First, connect your AI platforms through secure OAuth integrations - Worklytics' connectors automatically pull Microsoft 365 Copilot metrics including prompt usage, feature adoption, and time saved estimates. Second, map your organizational structure by importing department hierarchies and role definitions from your HRIS, enabling the system to aggregate individual usage into meaningful departmental views. Third, configure your privacy settings to determine aggregation thresholds - typically requiring minimum group sizes of five to protect individual privacy. Fourth, customize your dashboard views in Power BI using Worklytics' pre-built templates that automatically generate heatmaps, trend analyses, and adoption curves.
The resulting heatmaps deliver immediate actionable insights. Color-coded grids show AI adoption intensity across departments, with drill-down capabilities revealing which specific tools drive usage in each area. Time-series views track adoption velocity, helping identify whether engineering's 90% of developers found they were more fulfilled with GitHub Copilot translates into productivity gains or if sales teams need additional training on Slack AI features. Benchmark overlays compare your departmental adoption rates against industry standards, highlighting where you lead and where you lag. These visualizations update in real-time through Worklytics' DataStream service, ensuring executives always see current adoption patterns rather than stale monthly reports.
Worklytics prioritizes privacy-first analytics through its sophisticated data anonymization architecture. The platform uses data anonymization and aggregation to ensure compliance with GDPR, CCPA, and other data protection standards, never exposing individual employee activities while still providing rich departmental insights.
The technical implementation employs multiple privacy-preserving techniques. Privacy-Enhancing Technologies (PETs) including differential privacy and secure multi-party computation ensure that raw usage data gets transformed before analysis. Hash functions irreversibly encode user identifiers while preserving the ability to track patterns over time. Aggregation thresholds automatically suppress data for groups smaller than five employees, preventing re-identification through inference.
The connector architecture maintains zero-knowledge principles throughout the data pipeline. Worklytics uses anonymization and aggregation at the point of collection - before data ever leaves your environment. OAuth tokens grant read-only access to metadata rather than content, meaning the system sees that someone used Copilot to summarize a document but never accesses the document itself. Audit logs track every data access, providing transparency into what information flows through the system while maintaining employee privacy. This approach enables organizations to gain comprehensive AI adoption insights while exceeding the strictest privacy regulations globally.
The Microsoft 365 Copilot adoption report delivers rich telemetry for Microsoft's ecosystem, tracking usage across Teams, Word, Excel, and PowerPoint with impressive granularity. Yet this single-vendor view creates dangerous blind spots. Organizations using GitHub Copilot for development, Slack AI for communications, and Google's Gemini for analytics see only fragments of their AI adoption story. Microsoft's Viva Insights requires analyst-level expertise to configure custom queries and merge data sources, leaving most leaders dependent on IT teams for basic visibility.
The visualization limitations compound these data silos. Native dashboards typically present usage as flat metrics - licenses consumed, features accessed, queries processed. They lack the organizational context that transforms data into decisions. A Fortune 500 company discovered their engineering teams showed 90% GitHub Copilot adoption while marketing lagged at 15% on any AI tool - a pattern invisible when viewing platform-specific reports in isolation. Without department-level heatmaps, leaders miss critical disparities: one team might be transforming their workflows with AI while another struggles with basic adoption, yet both appear as aggregate statistics in vendor dashboards.
Celonis and similar process mining platforms focus on workflow automation rather than human-AI collaboration patterns. While Celonis Process Intelligence Platform uses AI to analyze business operations, it doesn't capture how employees actually adopt and use generative AI tools in their daily work. The result leaves organizations rich in process data but poor in adoption intelligence, unable to answer fundamental questions about which departments are AI-ready and which need intervention.

The regulatory landscape for AI monitoring creates a complex compliance matrix that organizations must navigate carefully. Germany's proposed Employee Data Act introduces strict conditions for using employee data in performance evaluations, while explicitly granting employees the right to be informed about AI and profiling systems. These requirements fundamentally reshape how organizations can implement AI adoption tracking.
The EU AI Act adds another layer of complexity. Most HR Tech systems using AI are classified as high-risk under Chapter 3 Article 6(3), particularly those supporting recruitment and career planning, with violations potentially triggering fines up to 7% of global revenue. This classification extends to AI adoption monitoring systems that could influence performance reviews or resource allocation decisions. Organizations must implement rigorous safeguards: transparency mechanisms that explain how adoption metrics are calculated, human oversight protocols ensuring automated insights don't drive decisions, and regular audits verifying that monitoring doesn't create discriminatory impacts.
The privacy-preserving approach becomes essential, not optional. Adoption of privacy-enhancing technologies is surging, with the global PET market expected to grow from $2.4 billion to $25.8 billion by 2033. Organizations must employ differential privacy to add statistical noise that prevents individual identification, implement secure multi-party computation to analyze data without exposing raw records, and establish aggregation thresholds that suppress small-group data. These techniques enable compliant visualization where heatmaps show departmental patterns without revealing individual behaviors, maintaining both regulatory compliance and employee trust.
A Fortune 500 company with 15,000 employees faced a crisis of fragmented AI adoption. Despite investing millions in AI licenses across Microsoft Copilot, GitHub Copilot, and Slack AI, leadership had no unified view of actual usage patterns. Different departments operated in silos, with IT tracking GitHub metrics, HR monitoring Microsoft 365 adoption, and no one seeing the complete picture.
The transformation began with deploying Worklytics' unified dashboard in Q3 2024. Within two weeks, the heatmaps revealed striking patterns: engineering showed 90% GitHub Copilot adoption but only 20% Microsoft 365 Copilot usage, while marketing exhibited the inverse pattern. The risk and compliance department, surprisingly, emerged as power users of Slack AI for contract analysis. These insights drove targeted interventions - engineering received Microsoft 365 Copilot training focused on documentation workflows, marketing got GitHub Copilot sessions for analytical scripting, and the risk team's success patterns were packaged into playbooks for other departments.
The results exceeded projections. Within one quarter, the company achieved a 28% increase in overall AI adoption across all departments. More importantly, cross-functional AI usage jumped 45% as teams began adopting tools that had previously been siloed in other departments. The visualization also revealed that developers saw increases in pull requests of 8.69% after targeted training on advanced Copilot features. The heatmaps didn't just measure adoption - they catalyzed it by showing leaders exactly where to focus their enablement efforts. This targeted approach proved far more effective than blanket training programs, demonstrating that visibility into departmental patterns drives strategic adoption rather than hoping for organic growth.
The path from AI experimentation to scaled adoption requires deliberate strategy, not wishful thinking. Organizations that successfully drive adoption understand that strong use cases beat abstract features - employees adopt AI when they see specific workflows transformed, not when they hear about theoretical capabilities. Start by identifying your organization's "hero use cases" - the workflows where AI delivers immediate, measurable value that others can replicate.
Leadership visibility drives adoption velocity. When executives can see department-level heatmaps showing AI adoption patterns, they make better resource allocation decisions. 80% of organizational leaders regularly use AI tools, yet many remain unaware of adoption gaps in their organizations. Regular AI adoption reviews using heatmap data should become as routine as financial reviews, with department heads accountable for their team's AI maturity metrics.
Target your training investments surgically. The data reveals that preparing your workforce for AI has the biggest impact on value delivery - companies that effectively prepare employees improve AI success rates by 18 percentage points. Use heatmap data to identify departments ready for advanced training versus those needing foundational support. Engineering teams with high GitHub Copilot adoption might be ready for prompt engineering workshops, while HR teams showing low adoption need basic AI literacy programs first.
Create cross-pollination opportunities between high and low adoption departments. When heatmaps reveal that your finance team has mastered Excel Copilot while sales struggles, facilitate knowledge transfer sessions. Document and share the specific prompts, workflows, and techniques that drive success in high-adoption areas.
Measure beyond simple usage metrics. Track how AI adoption correlates with business outcomes - do departments with higher AI adoption show improved productivity metrics, faster project delivery, or better employee satisfaction scores? This connection between adoption and impact justifies continued investment and identifies which AI use cases deliver real value versus those that merely generate activity.
The organizations that will thrive in the AI era are those that can see clearly how artificial intelligence transforms work across every department and role. GenAI adoption heatmaps represent more than visualization tools - they are the navigation systems that guide enterprises through the most significant technological transformation since the internet. Without this visibility, even the most ambitious AI initiatives risk becoming expensive experiments that never achieve scale.
The window for establishing AI leadership is narrowing rapidly. While competitors struggle with fragmented dashboards and siloed metrics, organizations with unified heatmap visibility can identify and scale successful AI patterns at unprecedented speed. The 28% adoption lift achieved through targeted interventions demonstrates that optimizing for AI proficiency is one of the most worthwhile investments your organization can make in this age of intelligent technology.
Worklytics enables this transformation by turning invisible AI adoption patterns into actionable intelligence. Track adoption across all your AI tools, benchmark against industry leaders, identify and scale successful use cases, and ensure privacy-compliant monitoring that maintains employee trust. The journey from AI experimentation to enterprise-wide transformation begins with seeing the complete picture of how your organization actually uses these powerful tools.
Take the first step toward AI adoption clarity. Discover how Worklytics can illuminate your organization's AI adoption patterns and accelerate your journey to becoming an AI-powered enterprise.
A GenAI adoption heatmap is a visualization tool that transforms raw AI usage data into visual intelligence, showing how different departments and roles within an organization are adopting generative AI tools. It provides insights into which teams are effectively using AI and which are lagging, helping to guide strategic AI deployment.
Visibility into AI adoption is crucial because it helps organizations identify which departments are successfully integrating AI tools and which are not. This insight allows leaders to allocate resources effectively, provide targeted training, and ensure that AI investments deliver tangible business outcomes.
Worklytics uses privacy-preserving technologies such as data anonymization and aggregation to ensure compliance with privacy regulations like GDPR and CCPA. This approach protects individual employee data while providing comprehensive insights into departmental AI adoption patterns.
Worklytics' heatmaps offer a unified view of AI adoption across multiple platforms, unlike built-in dashboards that often provide fragmented data. This comprehensive visibility helps organizations identify cross-departmental adoption patterns and address disparities in AI usage effectively.
Organizations can use AI adoption heatmaps to identify successful AI use cases, allocate resources for targeted training, and facilitate knowledge transfer between departments. This strategic approach helps maximize the return on AI investments and accelerates enterprise-wide AI adoption.
2. https://leanix.net/en/use-cases/ai-governance-ai-adoption
7. https://marketplace.microsoft.com/en-ie/product/power-bi/github.github-copilot-metrics?tab=Overview
10. https://www.worklytics.co/resources/track-employee-chatgpt-usage-gdpr-compliant-framework-2025
11. https://datasociety.net/wp-content/uploads/2025/10/The-Privacy-Trap.pdf
13. https://www.worklytics.co/blog/top-ai-adoption-challenges-and-how-to-overcome-them
15. https://www.eprivacy.eu/en/privacy-seals/eprivacyseal-ai
17. https://www.bcg.com/publications/2024/five-must-haves-for-ai-upskilling
18. https://infosys.com/iki/research/ai-business-value-radar2025.html
19. https://www.worklytics.co/blog/insights-on-your-ai-usage-optimizing-for-ai-proficiency


