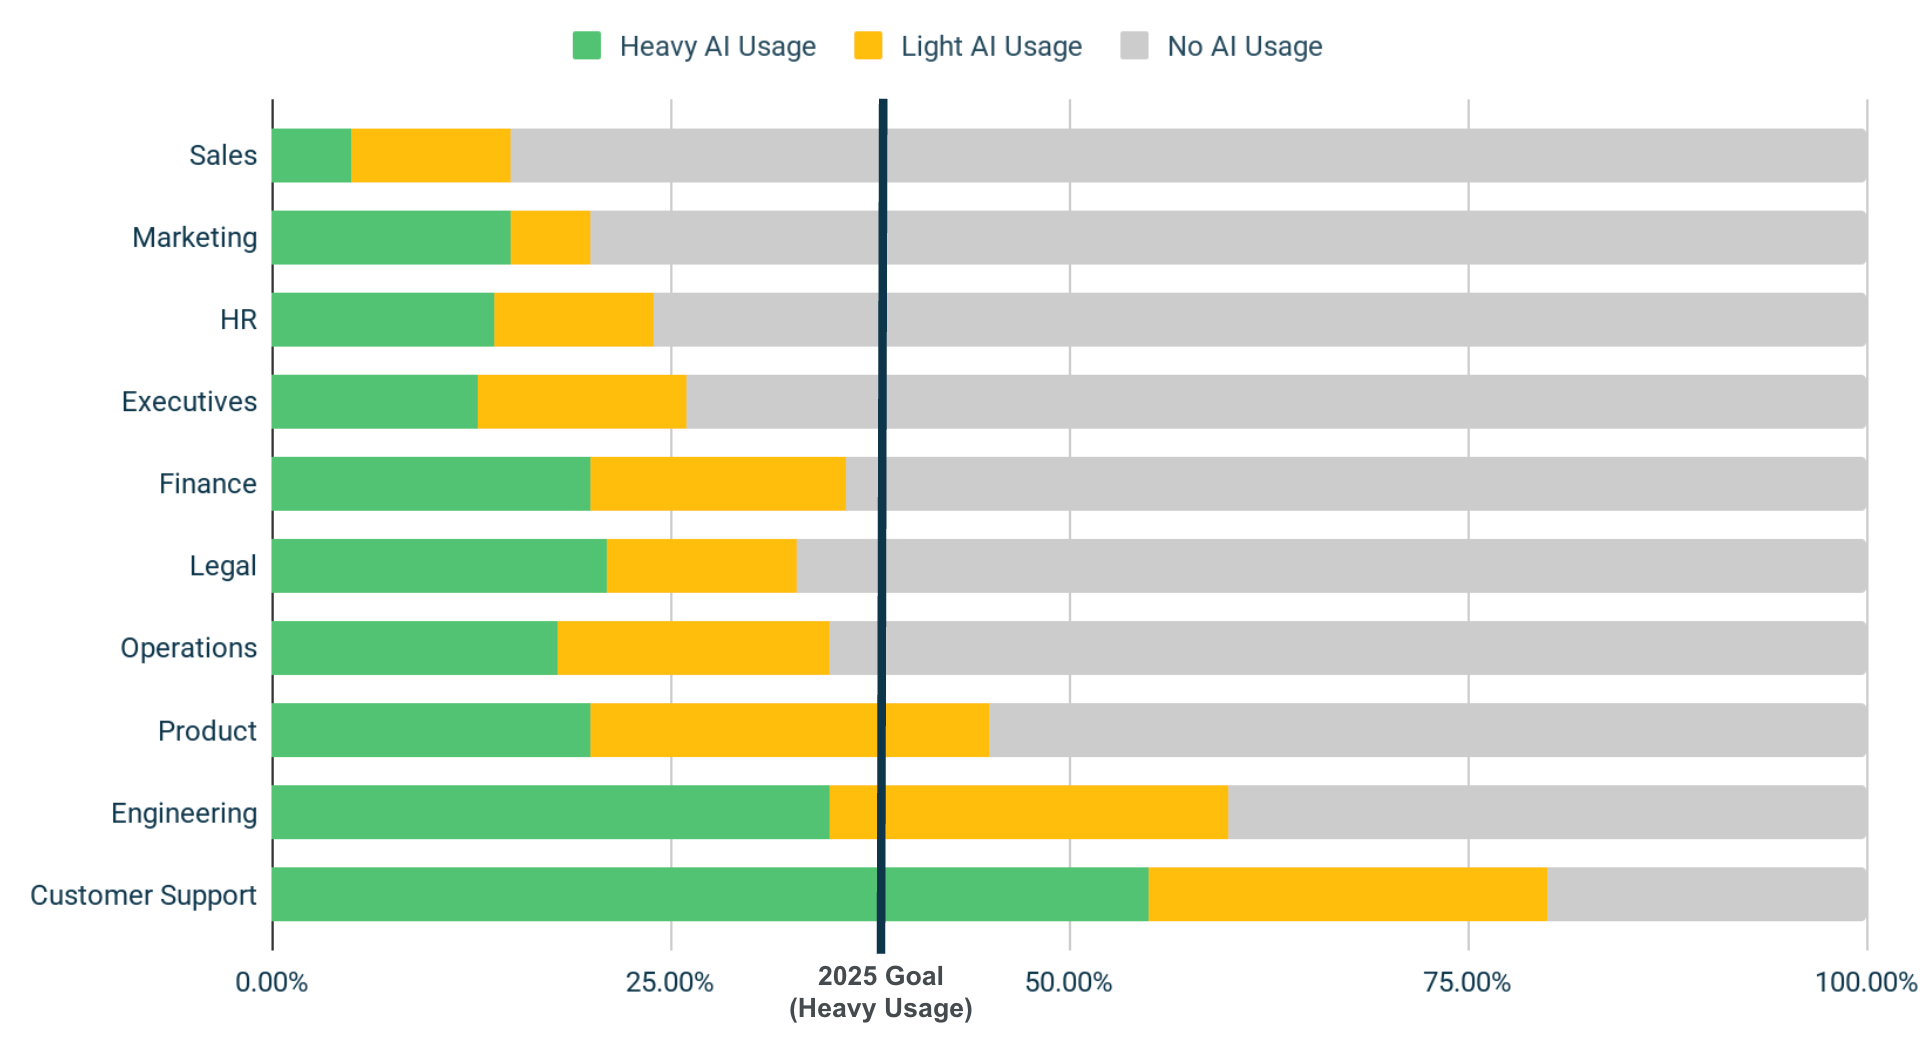
Microsoft Copilot has transformed from an experimental tool to a mission-critical productivity platform, but measuring its impact across departments remains a challenge for most organizations. While 79% of leaders agree that AI is crucial for business, 59% struggle with quantifying the productivity gains of AI tools like Copilot (Microsoft WorkLab). The key to unlocking Copilot's full potential lies in building comprehensive usage dashboards that track adoption patterns, identify high-performing teams, and pinpoint areas needing additional support.
This comprehensive guide will walk IT analytics teams through a structured 4-week sprint to create a live Power BI dashboard that tracks Microsoft Copilot adoption by department. Drawing on proven methodologies and real-world implementation strategies, we'll cover everything from data ingestion to ROI measurement. High adoption metrics are necessary for achieving downstream benefits of AI tools, making this dashboard essential for organizations looking to maximize their Copilot investment (Worklytics).
By the end of this 30-day journey, you'll have a fully functional dashboard that provides real-time insights into which departments are embracing Copilot, how frequently they're using it, and what tasks they're automating. This visibility is crucial because many organizations segment usage by team, department, or role to uncover adoption gaps and identify areas that may require additional support or training (Worklytics).
Departmental tracking reveals critical insights that organization-wide metrics often miss. Different teams have varying comfort levels with AI tools, distinct use cases, and unique barriers to adoption. Microsoft's research shows that after about one business quarter (11 weeks) of using Microsoft Copilot, it becomes a significant factor for early-in-career employees in choosing their workplace (Microsoft WorkLab).
Workplace analytics platforms like Worklytics provide data from more than 25 of the most common collaboration tools, using machine learning to clean, de-duplicate, and standardize datasets (Worklytics). This comprehensive approach ensures your Copilot usage data integrates seamlessly with broader productivity metrics.
Prerequisites Checklist:
Initial Setup Tasks:
Primary Data Sources:
| Data Source | Information Available | Update Frequency | Access Method |
|---|---|---|---|
| Microsoft 365 Usage Analytics | Copilot interactions, feature usage | Daily | Graph API |
| Azure AD Audit Logs | User authentication, license assignments | Real-time | Graph API |
| Microsoft Viva Insights | Collaboration patterns, meeting data | Daily | Viva Insights API |
| SharePoint Usage Reports | Document collaboration with Copilot | Daily | SharePoint API |
Microsoft has developed a new metric called Copilot Assisted Hours to help leaders understand how Copilot improves work for employees (Microsoft WorkLab). This composite score reflects key data from telemetry, including meeting hours summarized by Copilot, chat searches, email summaries, and document creation activities.
Active Directory Integration:
Most organizations store department information in Active Directory user attributes. The key fields to extract include:
Sample PowerShell Script for AD Data Extraction:
# Note: This is a conceptual example - actual implementation may vary
Get-ADUser -Filter * -Properties Department,Title,Manager,Office |
Select-Object Name,UserPrincipalName,Department,Title,Manager,Office |
Export-Csv "ADUserData.csv" -NoTypeInformation
Setting Up Graph API Access:
Key Graph API Endpoints:
/reports/getM365AppUserDetail - Application usage by user/reports/getOffice365ActivationsUserDetail - License activation data/users/{id}/insights/used - Individual user activity insightsCore Transformation Requirements:
Worklytics uses machine learning to clean, de-duplicate, and standardize datasets, which is crucial for accurate analytics (Worklytics). Your pipeline should include similar data quality checks.
Recommended Storage Pattern:
| Layer | Technology | Purpose | Retention |
|---|---|---|---|
| Raw Data | Azure Data Lake | Unprocessed API responses | 2 years |
| Processed Data | Azure SQL Database | Cleaned, transformed data | 1 year |
| Aggregated Data | Power BI Dataset | Dashboard-ready metrics | 6 months |
Essential Visualizations:
Department Adoption Overview
Feature Usage Breakdown
User Engagement Metrics
Worklytics focuses on understanding and improving how work gets done, with particular attention to workday intensity and manager effectiveness (Worklytics). Your dashboard should incorporate similar productivity context.
Advanced Metrics to Include:
Interactive Elements:
Testing Scenarios:
Performance Optimization:
Rollout Strategy:
Many organizations segment usage by team, department, or role to uncover adoption gaps, making proper training essential for dashboard success (Worklytics).
Productivity ROI Calculations:
Based on industry research, organizations can expect significant returns from AI tool adoption. GitHub Copilot, for example, has seen rapid adoption with over 1.3 million developers on paid plans and over 50,000 organizations issuing licenses within two years (Worklytics).
ROI Metrics Table:
| Metric | Calculation Method | Expected Range | Data Source |
|---|---|---|---|
| Time Savings per User | (Tasks automated × Time per task) × Usage frequency | 2-5 hours/week | Usage logs + surveys |
| Document Creation Efficiency | Before/after comparison of document completion times | 20-40% improvement | Collaboration data |
| Meeting Productivity | Summary generation time savings | 15-30 minutes/meeting | Calendar integration |
| Email Response Efficiency | Draft generation and editing time reduction | 10-25% faster | Email analytics |
-- Map users to departments with manager hierarchy
SELECT
    u.UserPrincipalName,
    u.DisplayName,
    u.Department,
    u.JobTitle,
    m.DisplayName as ManagerName,
    u.OfficeLocation,
    u.CompanyName
FROM Users u
LEFT JOIN Users m ON u.ManagerId = m.Id
WHERE u.AccountEnabled = 1
    AND u.Department IS NOT NULL
-- Daily usage metrics by department
SELECT
    DATE(ActivityDate) as UsageDate,
    Department,
    COUNT(DISTINCT UserPrincipalName) as ActiveUsers,
    SUM(CopilotInteractions) as TotalInteractions,
    AVG(SessionDuration) as AvgSessionDuration,
    SUM(DocumentsCreated) as DocumentsCreated,
    SUM(EmailsDrafted) as EmailsDrafted
FROM CopilotUsageData c
JOIN UserDepartments d ON c.UserPrincipalName = d.UserPrincipalName
WHERE ActivityDate >= DATEADD(day, -30, GETDATE())
GROUP BY DATE(ActivityDate), Department
ORDER BY UsageDate DESC, Department
// Transform raw usage data with department lookup
let
    Source = Json.Document(Web.Contents("https://graph.microsoft.com/v1.0/reports/getM365AppUserDetail")),
    ConvertedToTable = Table.FromRecords(Source[value]),
    AddedDepartment = Table.NestedJoin(ConvertedToTable, {"userPrincipalName"}, DepartmentLookup, {"UserPrincipalName"}, "Department", JoinKind.LeftOuter),
    ExpandedDepartment = Table.ExpandTableColumn(AddedDepartment, "Department", {"Department", "Manager"}, {"Department", "Manager"}),
    FilteredRows = Table.SelectRows(ExpandedDepartment, each [Department] <> null)
in
    FilteredRows
Fact Tables:
FactCopilotUsage: Daily usage metrics per userFactProductivityMetrics: Calculated productivity improvementsFactLicenseUtilization: License assignment and usage trackingDimension Tables:
DimUsers: User profiles with department mappingDimDepartments: Department hierarchy and metadataDimDate: Date dimension for time-based analysisDimCopilotFeatures: Feature catalog and descriptionsDimUsers (1) -----> (*) FactCopilotUsage
DimDepartments (1) -> (*) DimUsers
DimDate (1) --------> (*) FactCopilotUsage
DimCopilotFeatures (1) -> (*) FactCopilotUsage
| Department Type | Expected Adoption Rate | Power User Percentage | Average Sessions/Week |
|---|---|---|---|
| IT/Engineering | 75-85% | 25-35% | 8-12 |
| Marketing | 60-70% | 15-25% | 5-8 |
| Sales | 65-75% | 20-30% | 6-10 |
| HR | 50-60% | 10-20% | 3-6 |
| Finance | 55-65% | 15-25% | 4-7 |
| Operations | 45-55% | 10-20% | 3-5 |
Worklytics research shows that AI adoption can significantly impact productivity metrics (Worklytics). Organizations should track these key indicators:
| Productivity Metric | Baseline | 3-Month Target | 6-Month Target |
|---|---|---|---|
| Document Creation Speed | 100% | 120-130% | 140-160% |
| Email Response Time | 100% | 110-120% | 125-140% |
| Meeting Preparation Efficiency | 100% | 115-125% | 130-150% |
| Research Task Completion | 100% | 125-140% | 150-180% |
Worklytics uses machine learning to clean, de-duplicate, and standardize datasets, providing a foundation for predictive analytics (Worklytics). Your dashboard can incorporate similar ML capabilities:
Predictive Models to Implement:
Usage Pattern Anomalies:
Worklytics is built with privacy at its core, using data anonymization and aggregation to ensure compliance with GDPR, CCPA, and other data protection standards (Worklytics). Your dashboard should implement similar privacy protections:
Privacy Controls:
Challenge: Inconsistent department mapping across systems
Solution: Implement fuzzy matching algorithms and manual review processes for edge cases
Challenge: Missing or incomplete usage data
Solution: Set up data quality monitoring with automated alerts for missing data
Challenge: User identity resolution across multiple systems
Solution: Create a master user registry with multiple identifier mappings
Challenge: Slow dashboard refresh times
Solution: Implement incremental data refresh and optimize DAX calculations
Challenge: Large dataset handling
Solution: Use data partitioning and implement archival strategies for historical data
Challenge: Low engagement from department managers
Solution: Provide targeted training and demonstrate specific value propositions for each role
High adoption metrics are necessary for achieving downstream benefits, and this applies to your analytics dashboard as well (Worklytics).
Microsoft's Copilot Assisted Hours metric provides a composite score that reflects key productivity improvements (Microsoft WorkLab). Your dashboard should track similar comprehensive metrics:
Primary ROI Indicators:
| Metric Category | Specific Measurements | Expected Impact |
|---|---|---|
| Time Savings | Hours saved per user per week | 2-5 hours |
| Quality Improvements | Error reduction in documents/emails | 15-25% |
| Innovation Metrics | Time spent on creative vs. routine tasks | 20-30% shift |
| Employee Satisfaction | AI tool satisfaction scores | 4.2-4.6/5.0 |
After about one business quarter (11 weeks) of using Microsoft Copilot, it becomes a significant factor for early-in-career employees in choosing their workplace (Microsoft WorkLab). This suggests that Copilot adoption has strategic HR implications beyond immediate productivity gains.
Strategic Value Metrics:
Month 2-3: Enhanced Analytics
Month 4-6: Advanced Integration
Worklytics provides data from more than 25 of the most common collaboration tools, demonstrating the value of comprehensive workplace analytics (Worklytics). Consider expanding your dashboard to include:
Building a comprehensive AI usage dashboard for Microsoft Copilot adoption tracking is both a technical and strategic initiative that can drive significant organizational value. Over the 30-day implementation timeline outlined in this guide, you'll create a powerful analytics platform that provides unprecedented visibility into how your organization adopts and benefits from AI tools.
The key to success lies in combining robust data engineering with thoughtful user experience design. High adoption metrics are necessary for achieving downstream benefits, making your dashboard an essential tool for maximizing Copilot ROI (Worklytics). By tracking departmental usage patterns, identifying adoption gaps, and measuring productivity outcomes, you'll be equipped to make data-driven decisions about AI tool investments and training programs.
Remember that dashboard creation is just the beginning. The real value comes from acting on the insights you uncover, supporting departments that need additional help, and scaling successful adoption patterns across the organization. With Microsoft Copilot becoming a significant factor in workplace satisfaction and retention (Microsoft WorkLab), your analytics dashboard becomes a strategic asset for both IT operations and human resources.
As you implement this solution, consider partnering with workplace analytics specialists who can provide additional context and benchmarking data. Worklytics offers comprehensive workplace insights that complement Copilot usage analytics, helping organizations understand the broader context of how work gets done (Worklytics). The combination of AI adoption tracking and broader productivity analytics creates a powerful foundation for data-driven workplace optimization.
Key metrics include Copilot Assisted Hours (Microsoft's composite score), usage segmentation by department and role, meeting hours summarized by Copilot, chat searches, email and document summaries, and creation activities. High adoption metrics are necessary for achieving downstream benefits, so tracking these consistently helps identify gaps and areas needing additional support.
Microsoft research shows an "11-week insight" where after about one business quarter with Copilot, it becomes a significant factor for early-in-career employees in workplace decisions. This suggests that meaningful adoption patterns emerge around the 3-month mark, making quarterly tracking essential for measuring success.
According to Microsoft's 2024 Work Trend Index, while 79% of leaders agree AI is crucial for business, 59% worry about quantifying productivity gains because traditional metrics don't capture AI's impact. This is why Microsoft developed Copilot Assisted Hours as a new composite metric to help leaders understand how Copilot improves employee work.
You'll need data from Microsoft 365 usage analytics, Azure Active Directory logs, Power BI service logs, and potentially third-party tools like Worklytics that provide data from 25+ collaboration tools. The dashboard should connect to existing data warehouses and use machine learning to clean and standardize datasets for accurate reporting.
Segment usage by team, department, and role to uncover adoption gaps effectively. Many organizations following Worklytics' methodology find that departmental segmentation reveals which areas need additional support or training. This approach helps identify high-performing departments that can serve as adoption champions for others.
Focus on time-saving metrics, productivity improvements, and employee satisfaction scores. Track before-and-after comparisons of task completion times, document creation efficiency, and meeting productivity. Combine quantitative metrics like Copilot Assisted Hours with qualitative feedback to build a comprehensive ROI picture that demonstrates clear business value.