


Knowledge worker productivity has become the holy grail of modern business optimization. With hybrid work reshaping how we collaborate, communicate, and create value, organizations are scrambling to understand what "good" performance actually looks like in 2025. The challenge? Most teams are flying blind, lacking concrete benchmarks to gauge whether their productivity metrics signal success or sound the alarm for intervention.
The pandemic didn't just change where we work—it fundamentally transformed how we get work done (Worklytics). Workday spans have elongated, collaboration patterns have shifted, and AI tools are reshaping the productivity landscape faster than most organizations can measure their impact. Without reliable benchmarks, managers are left guessing whether their team's 2.8 hours of daily focus time represents peak efficiency or a productivity crisis waiting to happen.
This comprehensive analysis aggregates the latest 2025 benchmark data from leading workplace analytics platforms to establish realistic performance ranges across four critical dimensions: focus time, collaboration load, workday span, and AI tool adoption. By the end of this post, you'll have downloadable percentile tables and practical frameworks to assess whether your teams are operating above or below industry standards—and actionable strategies to close any gaps you discover.
Knowledge workers today navigate a fundamentally different work environment than their pre-2020 counterparts. Hybrid work has changed the shape of the workday, elongating the span of the day and changing the intensity of work (Worklytics). This shift has created new challenges in measuring and optimizing productivity across distributed teams.
Workforce analytics has emerged as a critical tool for understanding these new work patterns. Workforce analytics refers to the collection, analysis, and utilization of employee data to optimize decision making in support of an organization's goals (ActivTrak). These tools provide insights into how employees spend their time, who's at risk for burnout, and other performance insights that were previously invisible to management.
The complexity of modern work requires sophisticated measurement approaches. True productivity is about efficiency, effectiveness, and sustainability (Worklytics). This holistic view recognizes that sustainable high performance requires balancing focused work time with necessary collaboration while preventing burnout and maintaining work quality.
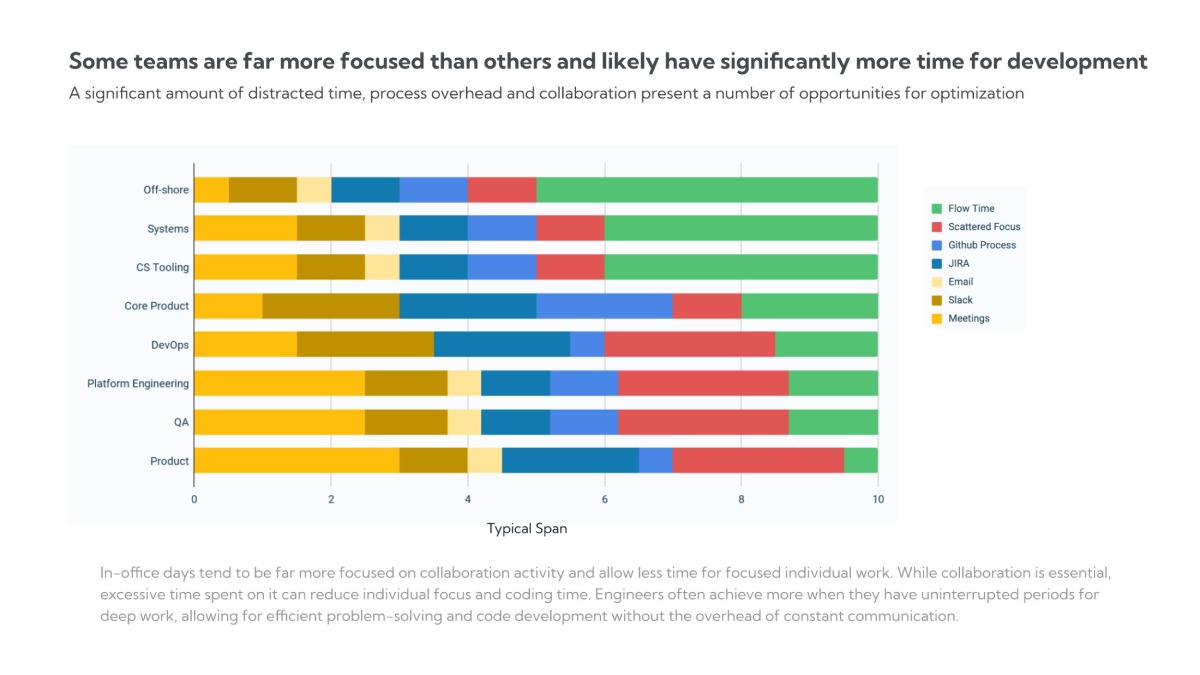
Focus time represents uninterrupted blocks where knowledge workers can engage in deep, cognitively demanding tasks. Research consistently shows that knowledge workers with at least 3.5 hours of daily focus time tend to report being more productive than those with less focus time (Worklytics).
2025 Focus Time Benchmarks:
PercentileDaily Focus TimeWeekly Focus TimePerformance Level90th4.5+ hours22.5+ hoursExceptional75th3.8 hours19 hoursAbove Average50th (Median)3.2 hours16 hoursAverage25th2.6 hours13 hoursBelow Average10th2.0 hours10 hoursConcerning
The data reveals significant variation across roles and industries. Software engineers typically achieve higher focus time percentiles, while managers and client-facing roles often struggle to maintain extended uninterrupted periods. Organizations implementing structured focus time policies report 15-25% improvements in project completion rates and code quality metrics.
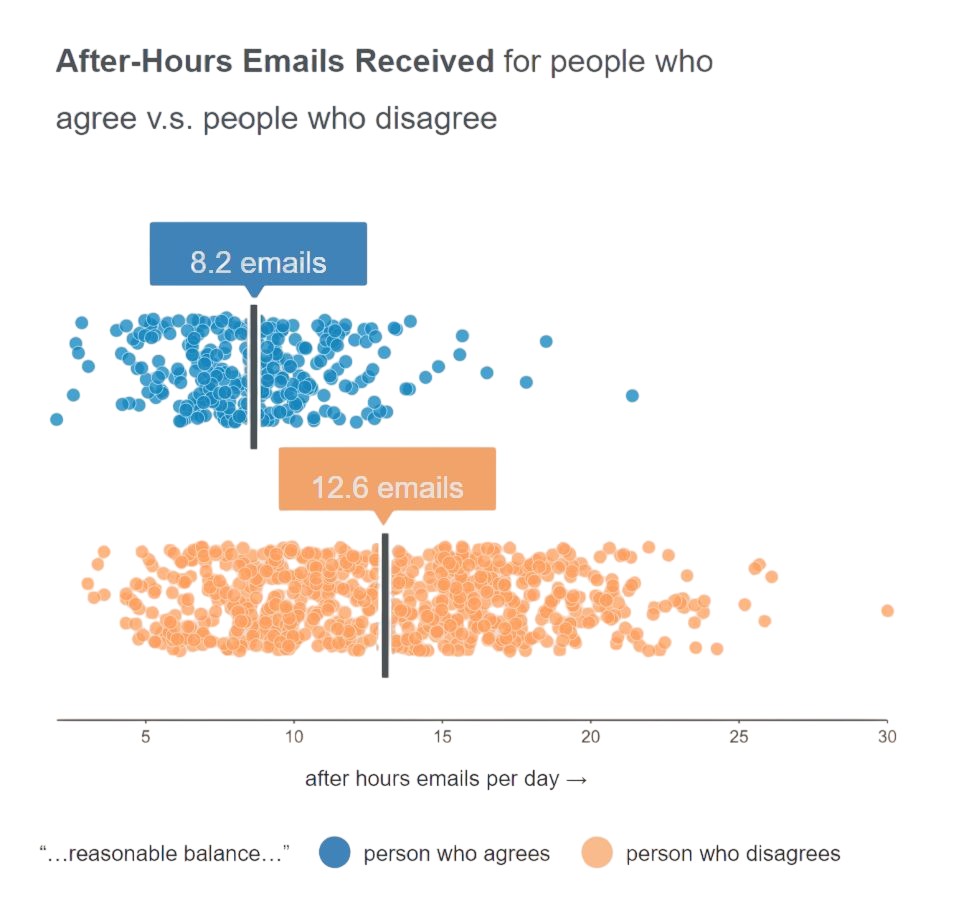
Collaboration is essential for knowledge work, but excessive interaction can severely impact productivity. Research on “collaboration overload” shows that time spent in meetings, email, and other collaborative activities has ballooned by 50% or more over the past two decades, with many employees now spending up to 80–85% of their time on these activities—leaving little room for deep, value‑creating work (HBR collaboration overload; WEF summary). The key is finding the optimal balance between necessary coordination and productivity‑killing over‑collaboration.
2025 Collaboration Load Benchmarks:
Metric10th Percentile25th Percentile50th Percentile75th Percentile90th PercentileDaily Meetings1.2 hours2.1 hours3.2 hours4.5 hours6.1 hoursWeekly Messages Sent85142218312445Collaboration Time %22%35%48%62%78%
The normal range included in benchmark reports shows the range of values for the middle 50% of people (Worklytics). For collaboration metrics, this middle range (25th-75th percentile) represents the healthy zone where teams maintain necessary coordination without falling into collaboration overload.
Workday span measures the total time from first to last work activity, reflecting how hybrid work has stretched the traditional 9-to-5 boundaries. Workday intensity is measured as time spent on digital work as a percentage of the overall workday span (Worklytics). This metric helps organizations understand whether extended workdays represent flexibility or unsustainable work patterns.
2025 Workday Span Benchmarks:
Role TypeAverage SpanIntensity %Optimal RangeIndividual Contributors9.2 hours68%8.5-10 hoursLine Managers10.1 hours72%9.5-11 hoursSenior Managers10.8 hours75%10-12 hoursExecutives11.4 hours78%10.5-12.5 hours
The data shows that managers consistently work longer spans than individual contributors, with intensity percentages increasing at higher organizational levels. However, spans exceeding 12 hours consistently correlate with decreased performance and increased burnout risk across all role types.
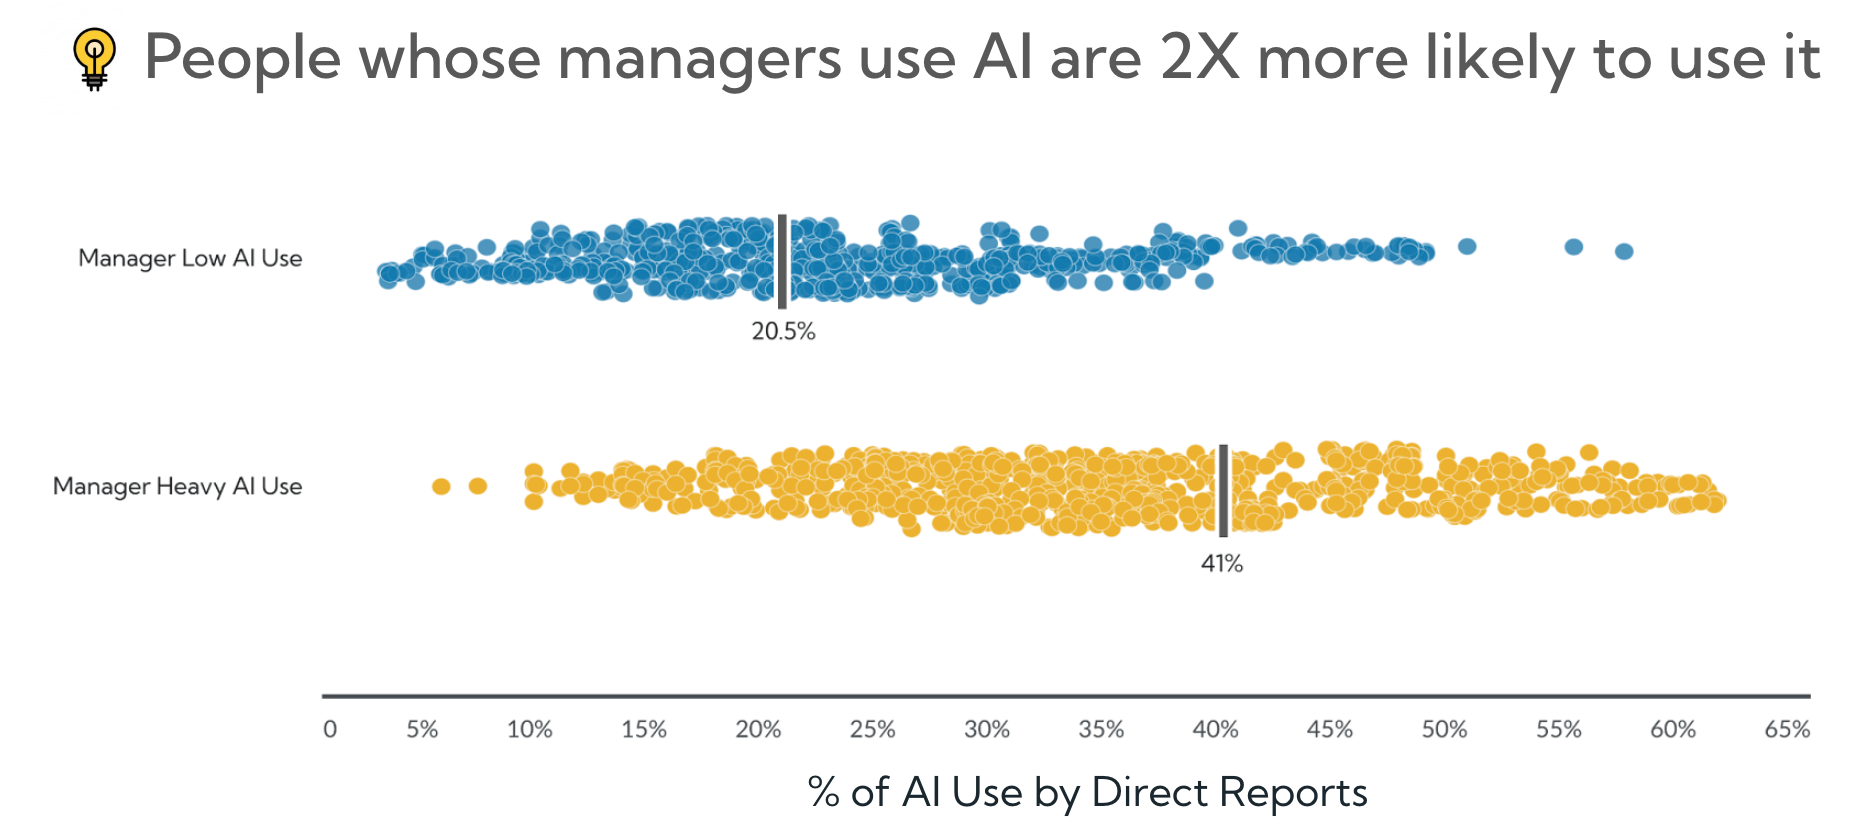
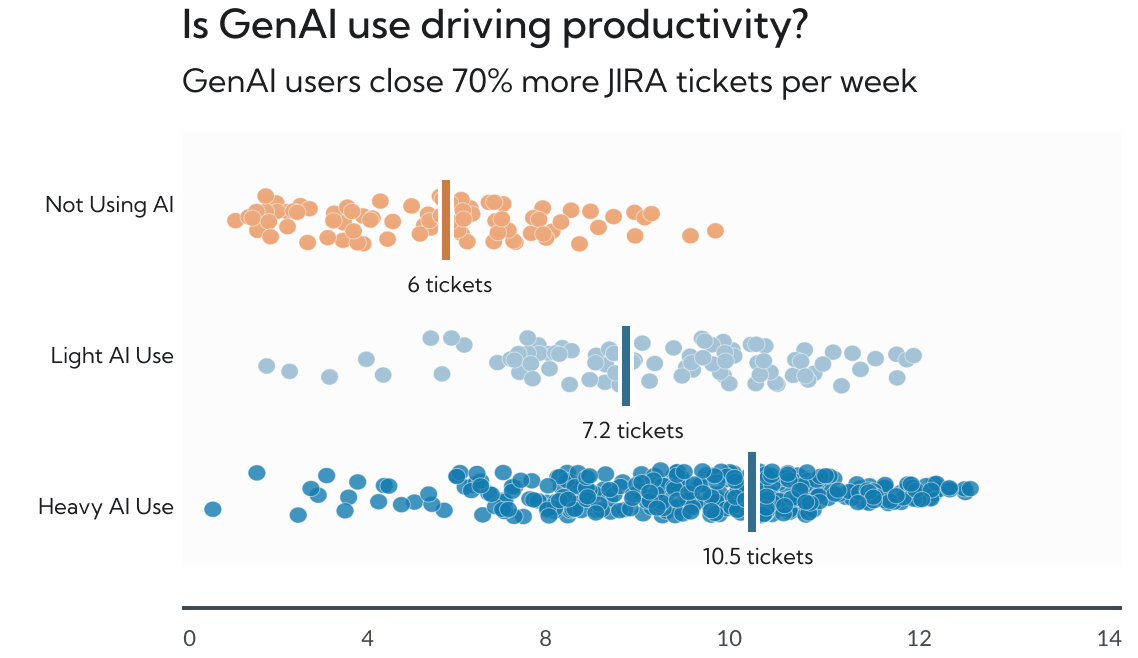
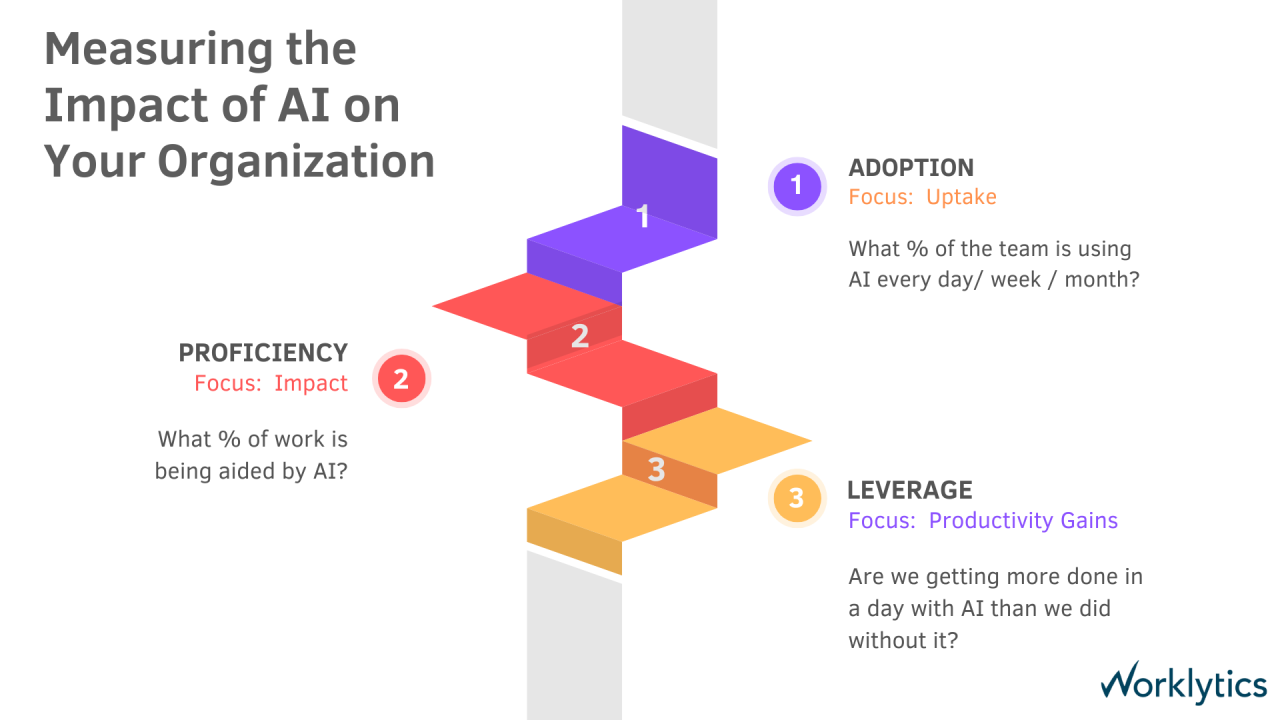
AI tool adoption has emerged as a critical productivity differentiator in 2025. GitHub Copilot has seen rapid adoption, with over 20 million developers having tried the tool and 90% of Fortune 100 companies using it, while an estimated 1.3 million paid subscribers across 50,000+ organizations indicate that usage has moved well beyond pilot stages (Copilot statistics; TechCrunch report). Organizations that systematically track AI adoption and outcomes increasingly report measurable gains in developer productivity and code quality, as well as time-savings in knowledge work such as document drafting and analysis (McKinsey AI survey; NBER digest).
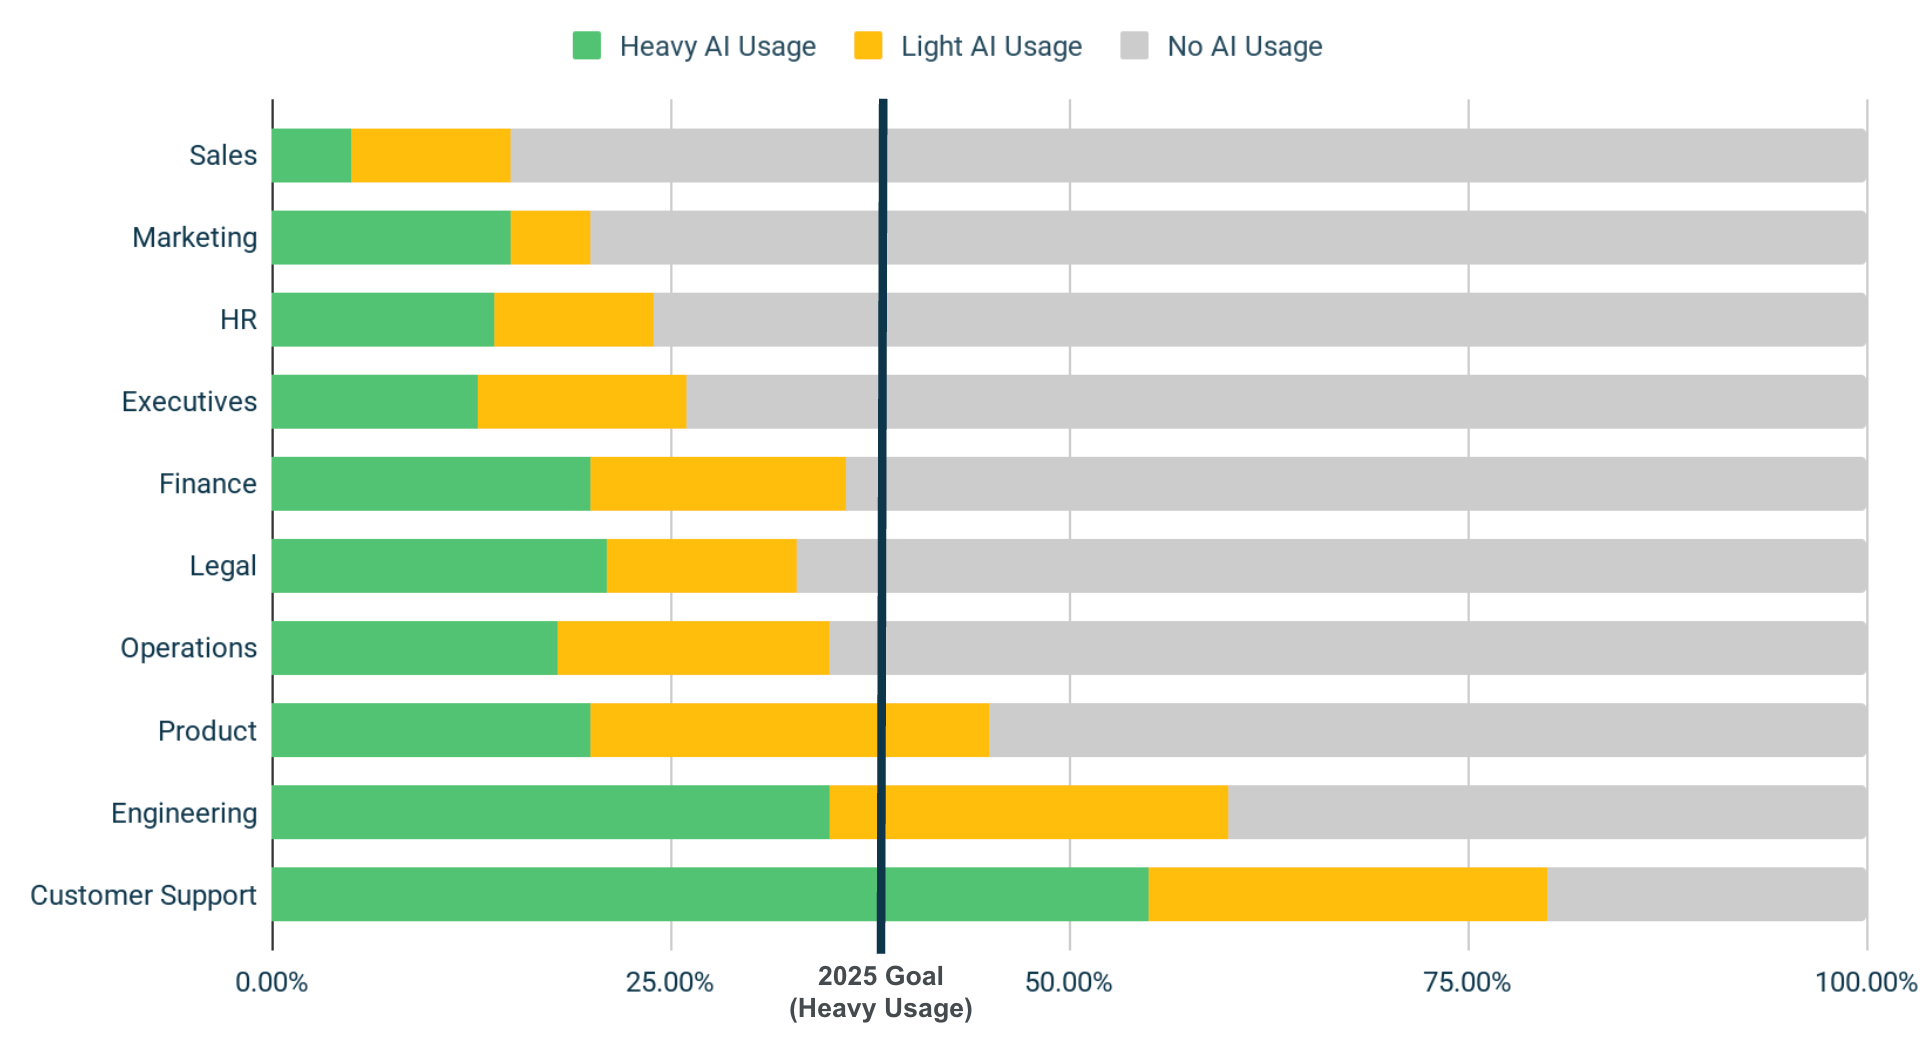
2025 AI Tool Adoption Benchmarks:
Rather than a single universal adoption rate, recent large-scale surveys show rapid but uneven genAI uptake across functions and industries:
AreaAdoption Indicator (2024–2025)Source TypeOrganization-wide71% of organizations regularly use genAI in at least one business functionMcKinsey AI surveyMarketing & SalesGenAI is most commonly deployed in marketing and sales use cases; >70% of marketing orgs report some GenAI use in campaignsMcKinsey AI survey; Gartner marketing studyIT / SoftwareAI is used in 69% of IT infrastructure management teams among SAP customers; Copilot adoption is particularly strong in tech and financial servicesSAP AI survey; Copilot statisticsOperationsAround half of enterprises use AI in operations and service functions, especially for analytics and automationMcKinsey AI surveyHRAI adoption is growing but still lagging, with fewer than one‑third of surveyed organizations using AI in HR processes end‑to‑endSAP AI survey
While reported productivity gains and ROI timelines vary by use case, multiple studies now document double‑digit efficiency improvements for well‑scoped implementations (for example, faster document drafting, higher developer throughput, and reduced time spent on repetitive support tasks) rather than a single generic percentage (Gartner genAI survey; Deloitte genAI report).
High adoption metrics are still necessary for achieving downstream benefits. Many organizations segment usage by team, department, or role to uncover adoption gaps and to distinguish casual experimentation from habitual, workflow‑embedded use (Worklytics benchmarks). The most successful implementations focus on training, change management, and measuring both adoption rates and concrete efficiency outcomes such as cycle time reduction, incident resolution speed, or revenue per employee.
Technology companies consistently show the highest focus time and AI adoption rates. Software engineers average 4.1 hours of daily focus time, significantly above the cross-industry median of 3.2 hours. This sector also leads in AI tool integration, with 78% adoption rates for coding assistants and 65% for general productivity tools.
The technology sector's benchmark data reveals interesting patterns around collaboration. While tech workers maintain high focus time, they also engage in more asynchronous collaboration through tools like Slack and GitHub, resulting in higher message volumes but lower meeting time compared to other industries.
Financial services organizations show more traditional collaboration patterns, with higher meeting attendance but lower message volumes. Focus time averages 2.9 hours daily, slightly below the median, reflecting the industry's emphasis on client interaction and regulatory compliance activities.
AI adoption in financial services lags other sectors at 42%, primarily due to regulatory constraints and data security requirements. However, organizations that have successfully implemented AI tools report 20-25% productivity gains in areas like document review and compliance monitoring.
Healthcare knowledge workers face unique productivity challenges, balancing administrative tasks with patient care responsibilities. Focus time averages just 2.4 hours daily, the lowest among major industries, while collaboration loads remain high due to care coordination requirements.
The healthcare sector shows the widest variation in productivity metrics, with administrative roles achieving higher focus time (3.1 hours) compared to clinical support roles (1.8 hours). AI adoption remains limited at 28%, but early adopters report significant gains in documentation efficiency and clinical decision support.
Professional services firms demonstrate high collaboration loads with average daily meeting time of 4.2 hours, reflecting client-facing work requirements. Focus time averages 3.0 hours, with significant variation based on role seniority and client engagement models.
This sector shows strong AI adoption potential, with 52% current adoption rates and rapid growth in areas like document analysis, research automation, and client communication. Tracking trends over time, such as increases in billable hour efficiency or reductions in research time, can confirm compounding efficiency gains from AI implementation (Worklytics).
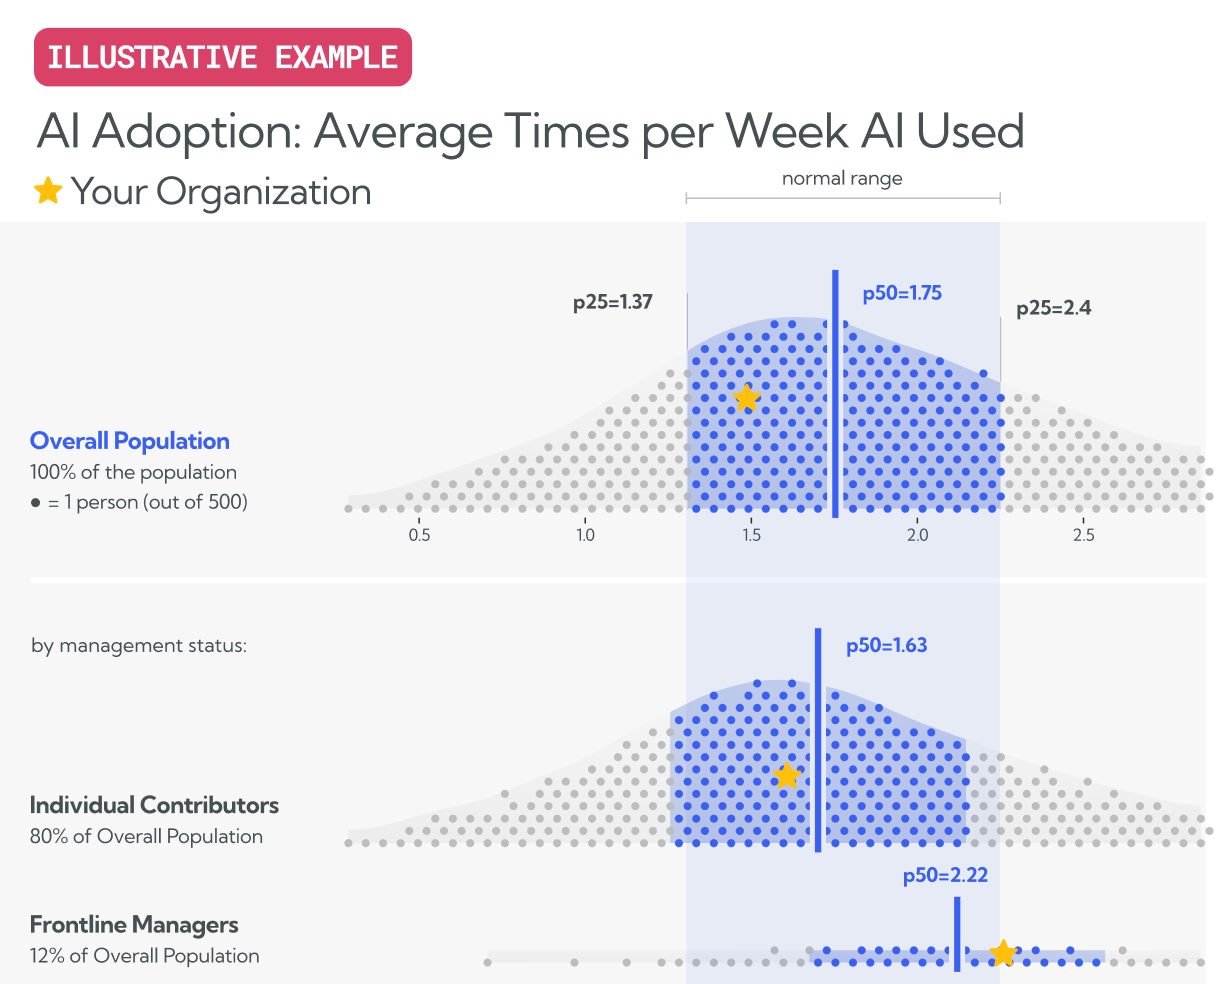
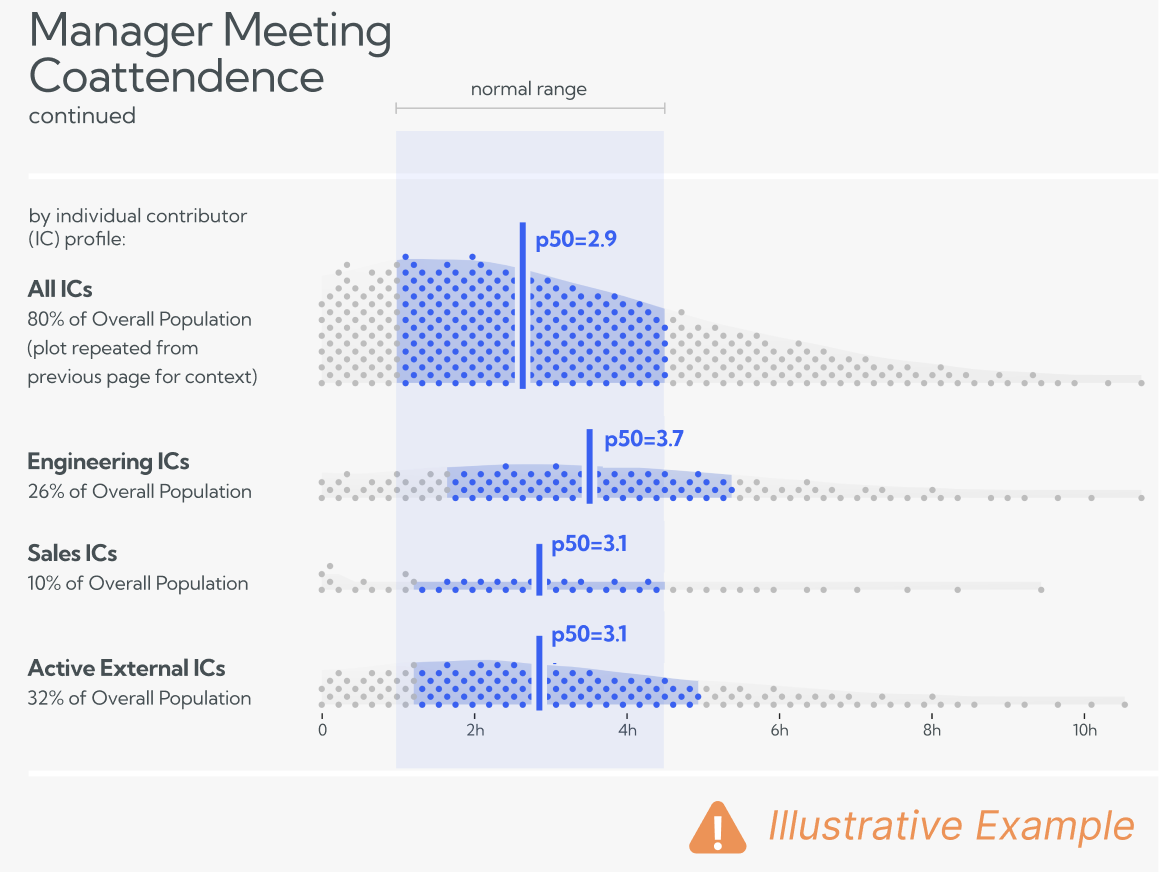
One of the most significant findings in 2025 productivity benchmarks is the persistent gap between managers and individual contributors across all key metrics. The data in benchmarking reports is shown in aggregate and also cut so you can see how managers compare to individual contributors (Worklytics).
Manager vs. IC Productivity Comparison:
MetricIndividual ContributorsManagersGapDaily Focus Time3.6 hours2.8 hours-22%Daily Meeting Time2.4 hours4.1 hours+71%Workday Span9.2 hours10.1 hours+10%AI Tool Usage58%45%-22%
This divide reflects the fundamental difference in role responsibilities, but it also highlights opportunities for optimization. Managers who achieve above-median focus time (3.0+ hours) consistently report better team performance and lower stress levels. The key is implementing structured management practices that protect focus time while maintaining necessary team coordination.
As organizations implement productivity monitoring and benchmarking, privacy considerations become paramount. The European Union's General Data Protection Regulation (GDPR) imposes strict requirements on how personal data, including employee assessment data, is processed (LinkedIn).
Worklytics addresses these concerns by building privacy protection into its core architecture. Built with privacy at its core, Worklytics uses data anonymization and aggregation to ensure compliance with GDPR, CCPA, and other data protection standards (Worklytics). This approach allows organizations to gain valuable productivity insights while maintaining employee trust and regulatory compliance.
Microsoft Viva demonstrates another privacy-first approach, where Viva Insights allows only the individual user to view personal data and insights based on their work patterns in emails, meetings, calls, and chats (Microsoft Viva). Differential privacy is employed to ensure individuals cannot be identified from metrics presented to managers and leaders.
The ongoing debate around return-to-office mandates has significant implications for productivity benchmarks. Research suggests that individual productivity may slow during the months immediately following a return-to-office due to a spike in collaboration leading to more meetings and messages (Worklytics).
Recent flex‑work indices show that structured hybrid models have become the dominant flexible arrangement, with roughly 38–43% of U.S. firms now using structured hybrid policies that specify required in‑office days, often implemented as Anchor Days when whole teams are expected onsite (Flex Index data; Flex Report Q2 2025; Worklytics anchor‑day analysis). The productivity impact of these policies varies significantly based on implementation approach and team composition.
Anchor Day Productivity Impact:
MetricPre-Anchor DaysPost-Implementation6-Month TrendFocus Time3.4 hours2.9 hours3.2 hoursMeeting Time3.1 hours4.2 hours3.6 hoursMessage Volume195/week245/week215/week
The data suggests that while anchor days initially disrupt productivity patterns, organizations that provide clear guidelines and focus time protection see metrics stabilize within 3-6 months at levels comparable to pre-implementation baselines.
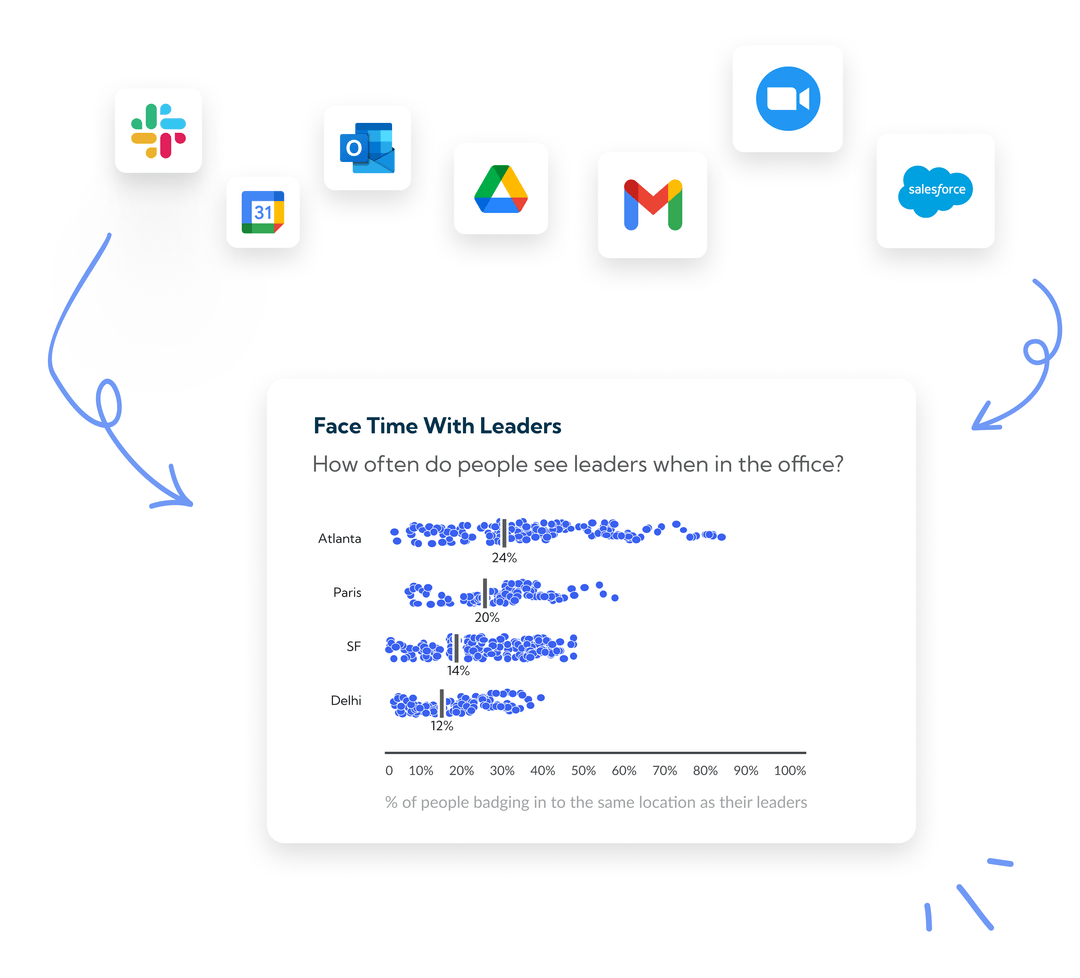
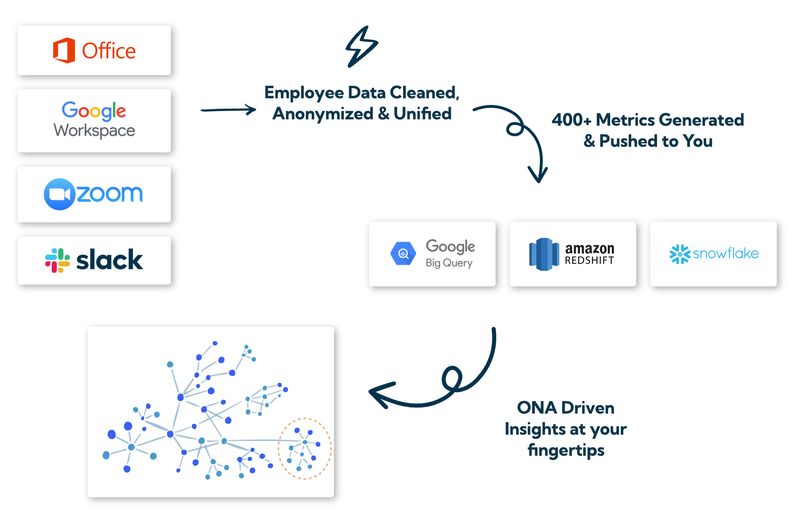
Before comparing against industry benchmarks, organizations need accurate baseline measurements of their current productivity metrics. Worklytics uses metadata from around 25 different work tools to analyze organizational work patterns (Worklytics). This comprehensive approach provides a holistic view of how work actually gets done across digital platforms.
The initial benchmarking report includes 19 most widely-cited metrics such as Workday Span, Focus Time, Time Spent Collaborating, Meetings Attended, and Slack Messages Sent (Worklytics). These metrics provide a comprehensive foundation for understanding current performance levels.
Effective benchmarking requires segmentation to account for role-specific requirements and expectations. With Benchmarks, companies can see how they compare to peers across all of the metrics that Worklytics tracks (Worklytics). This peer comparison capability enables organizations to identify specific areas where performance gaps exist.
Segmentation should consider:
• Role type (IC vs. Manager vs. Executive)
• Department function (Engineering, Sales, Marketing, etc.)
• Team size and structure
• Client-facing vs. internal-facing responsibilities
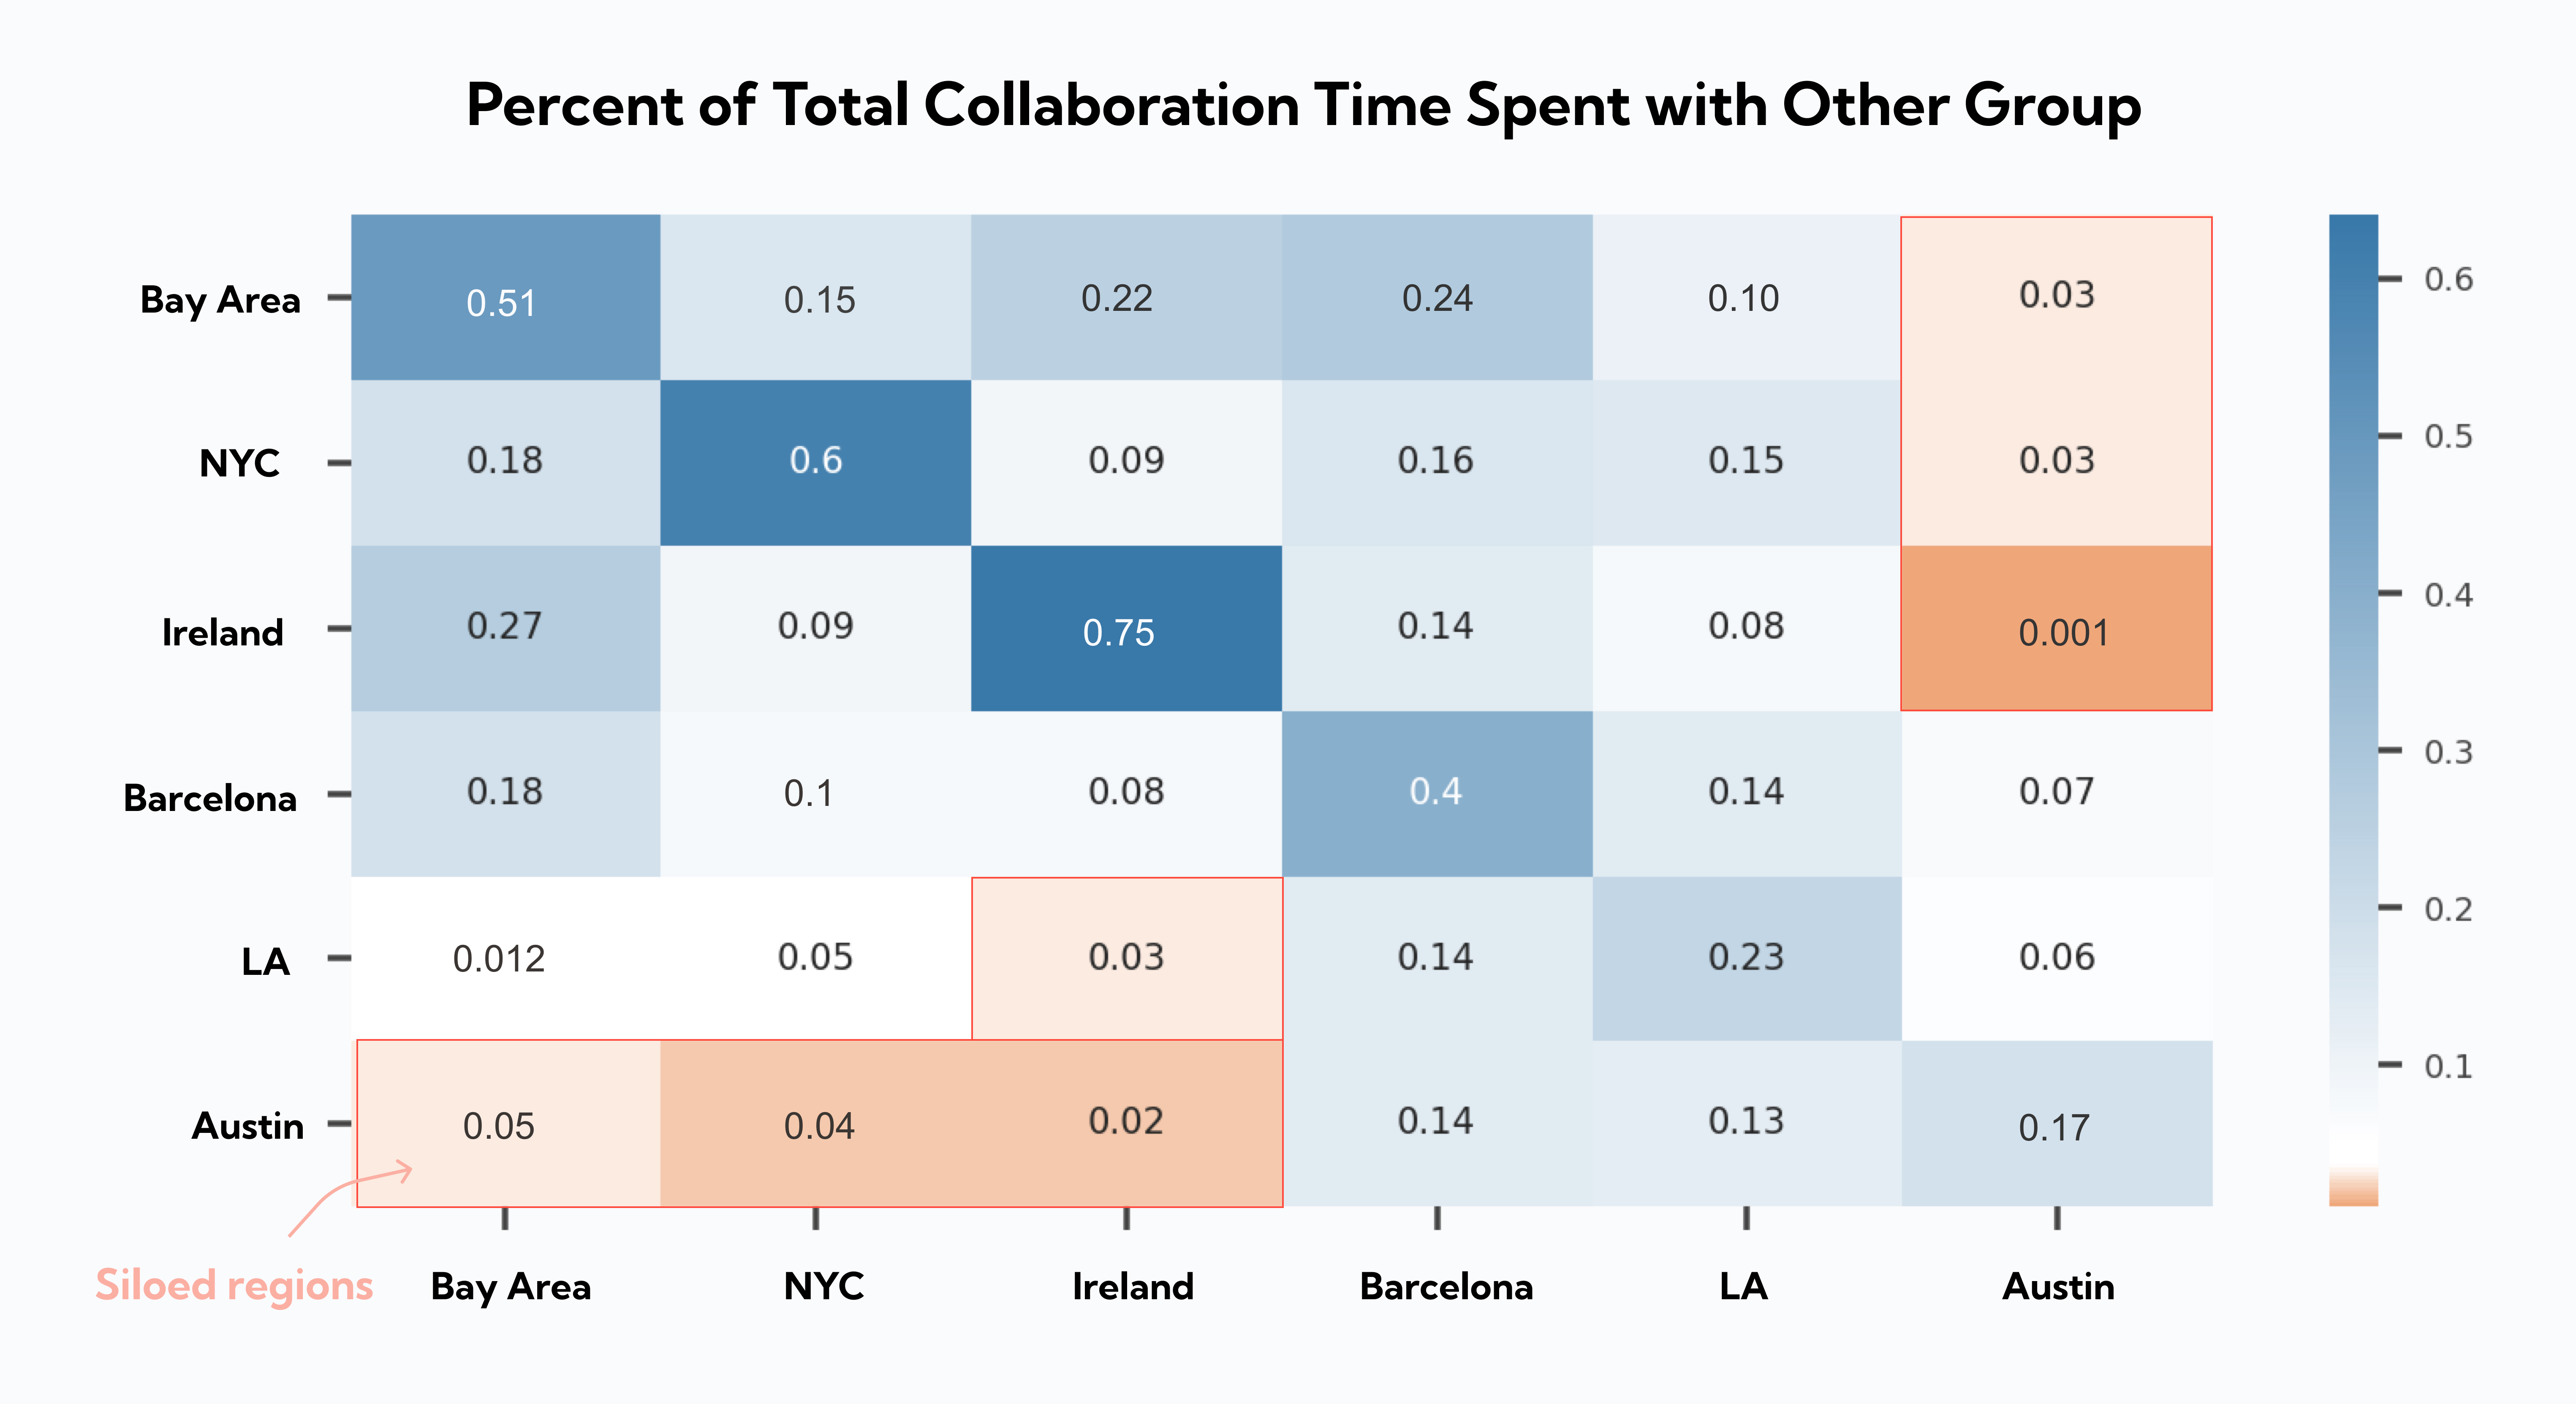
• Geographic distribution and time zone challenges
Once baseline measurements are established and properly segmented, organizations can identify specific areas where performance falls below industry benchmarks. The most common gap areas include:
Focus Time Deficits: Teams averaging less than 2.5 hours of daily focus time typically struggle with project completion and quality metrics. Solutions include implementing focus time blocks, reducing meeting frequency, and establishing communication protocols that minimize interruptions.
Collaboration Overload: Teams exceeding 5 hours of daily meeting time or 350 weekly messages often experience productivity degradation. Addressing this requires meeting hygiene training, asynchronous communication adoption, and clear escalation protocols.
Workday Span Expansion: Spans consistently exceeding 11 hours correlate with burnout risk and decreased long-term performance. Mitigation strategies include boundary setting, workload redistribution, and manager training on sustainable work practices.
Successful productivity improvement requires targeted interventions based on specific gap analysis. Organizations achieving above-benchmark performance typically implement:
Structured Focus Time Programs: Dedicated blocks of interruption-free time, often 2-4 hours daily, with team agreements on communication protocols during these periods.
Meeting Optimization Initiatives: Regular meeting audits, default meeting length reductions, and mandatory agenda requirements for all scheduled meetings.
AI Tool Adoption Programs: Systematic rollout of productivity-enhancing AI tools with proper training, change management, and adoption tracking.
Manager Effectiveness Training: Specific programs to help managers balance their own productivity needs with team coordination requirements.
As we move deeper into 2025, productivity benchmarking is evolving beyond simple metric tracking toward predictive analytics and personalized optimization. AI-powered workplace analytics platforms are beginning to provide real-time recommendations based on individual work patterns and team dynamics.
The integration of AI tools into productivity measurement creates new opportunities for optimization. Organizations can now track not just adoption rates but actual efficiency gains from AI implementation. This includes measuring code completion rates for developers using GitHub Copilot, content creation speed for marketers using AI writing tools, and research efficiency for analysts using AI-powered data tools.
Space utilization and occupancy planning are also becoming integrated with productivity metrics (Worklytics). Organizations are discovering correlations between physical workspace usage and digital productivity patterns, enabling more informed decisions about office design and hybrid work policies.
The 2025 productivity landscape demands a sophisticated understanding of what high performance actually looks like in the modern workplace. Organizations that leverage comprehensive benchmarking data gain significant advantages in talent retention, operational efficiency, and competitive positioning.
The key insight from this analysis is that productivity optimization requires a nuanced, data-driven approach that accounts for role differences, industry variations, and individual work styles. Teams performing above the 75th percentile in focus time, maintaining collaboration loads within the healthy middle range, and successfully adopting AI tools consistently outperform their peers across multiple business metrics.
Worklytics provides the comprehensive analytics platform needed to implement this level of sophisticated productivity measurement and optimization (Worklytics). By combining privacy-first data collection with industry-leading benchmark comparisons, organizations can make informed decisions about work practices, tool adoption, and team structure that drive measurable business results.
The goal isn't to achieve perfect scores across all metrics, but rather to understand where your teams stand relative to industry standards and implement targeted improvements that drive sustainable performance gains. In an increasingly competitive business environment, this data-driven approach to productivity optimization represents a critical competitive advantage that forward-thinking organizations cannot afford to ignore.
The four critical productivity metrics for knowledge workers in 2025 are focus time (uninterrupted work periods), collaboration load (meetings and messages), workday span (total hours from first to last activity), and AI tool adoption rates. These metrics provide a comprehensive view of how teams balance deep work with collaboration while leveraging new technologies to enhance productivity.
Hybrid work has fundamentally reshaped productivity patterns, with workday spans elongating and intensity changing significantly. Research shows that anchor days and structured hybrid environments can initially slow productivity due to increased collaboration spikes. Organizations now need to measure workday intensity as time spent on digital work as a percentage of overall workday span, rather than traditional 9-5 metrics.
Worklytics offers comprehensive benchmark data across various roles including sales professionals, software engineers, line managers, and executives. Their benchmarks cover workplace metrics like collaboration patterns, focus time distribution, and meeting loads, allowing organizations to compare their teams against industry standards and identify performance gaps or opportunities for optimization.
While adoption metrics like GitHub Copilot's 1.3 million developers on paid plans are important, organizations should focus on efficiency outcomes. Success measurement should include tracking trends over time such as increases in code output, reductions in cycle time, and compounding efficiency gains. Many organizations segment usage by team or department to identify adoption gaps and ensure high adoption rates lead to downstream productivity benefits.
Organizations must navigate strict privacy regulations like GDPR when collecting employee productivity data. Best practices include using differential privacy techniques (like Microsoft Viva Insights), ensuring individuals cannot be identified from aggregated metrics, and providing employees control over their data sharing. Companies should establish lawful bases for data processing and maintain transparency about how productivity analytics are used for decision-making.
Teams can assess their performance by comparing their metrics against industry percentile tables for focus time, collaboration load, and workday patterns. Organizations should look for trends and outliers in their data, segment analysis by role and department, and use workforce analytics tools that aggregate data from multiple work platforms. The key is establishing baseline measurements and tracking improvements over time rather than focusing on absolute numbers.
1. https://www.activtrak.com/product/workforce-analytics/
3. https://www.microsoft.com/en-us/microsoft-viva/privacy
4. https://www.worklytics.co/benchmarks
5. https://www.worklytics.co/blog/4-new-ways-to-model-work
6. https://www.worklytics.co/blog/adoption-to-efficiency-measuring-copilot-success
7. https://www.worklytics.co/blog/are-anchor-days-sinking-your-productivity
8. https://www.worklytics.co/blog/measuring-productivity-what-actually-works
9. https://www.worklytics.co/blog/worklytics-benchmarks-see-how-you-compare
10. https://www.secondtalent.com/resources/github-copilot-statistics/
11. https://techcrunch.com/2025/07/30/github-copilot-crosses-20-million-all-time-users/
12. https://www.mckinsey.com/capabilities/quantumblack/our-insights/the-state-of-ai-2024
13. https://www.nber.org/digest/202412/workplace-adoption-generative-ai
15. https://www.sap.com/blogs/ai-adoption-in-2024-sap-survey-insights
18. https://www.weforum.org/stories/2022/01/author-talks-beyond-collaboration-overload/
19. https://www.flexos.work/learn/hybrid-remote-work-statistics-trends-2023
20. https://www.facilitatemagazine.com/content/news/2025/06/02/flexible-working-norm-us-firms


