AI-powered copilots are rapidly becoming co-workers in today’s enterprises. From software development to customer service, intelligent assistants like Microsoft 365 Copilot are being embedded into daily workflows to boost productivity. To achieve and sustain such benefits, organizations need to actively measure how AI is being used and the impact it’s having. Simply deploying an AI tool isn’t enough – tracking adoption and outcomes is key to ensuring return on investment (ROI) and guiding successful usage.
Implementing AI solutions enterprise-wide represents a significant investment in licenses, training, and change management. Business leaders and IT teams increasingly recognize that you “can’t improve what you don’t measure.” Monitoring how widely and effectively AI tools are used is not just an IT task – it’s a strategic imperative to ensure these tools deliver real value.
Measuring adoption reveals who is (and isn’t) utilizing the AI tools. Usage metrics help identify pockets of high adoption as well as teams that might be lagging or encountering barriers.
Additionally, illustrate how tracking AI engagement alongside key performance indicators (KPIs) can reveal the technology’s true business value, ranging from sales growth to enhanced employee engagement.
By measuring adoption and impact, organizations can:
In summary, measuring adoption and impact turns anecdotal benefits into actionable insights. It provides the data foundation for scaling AI successfully. As one AI leader noted, we’ve reached a point where AI delivers “real, tangible value,” but a robust data foundation is the cornerstone of capturing that value.
Before choosing a dashboard, know which metrics to track. These are the core KPIs every Copilot adoption dashboard should surface:
Track these consistently and you'll have a defensible answer when leadership asks: "Is Copilot worth it?"
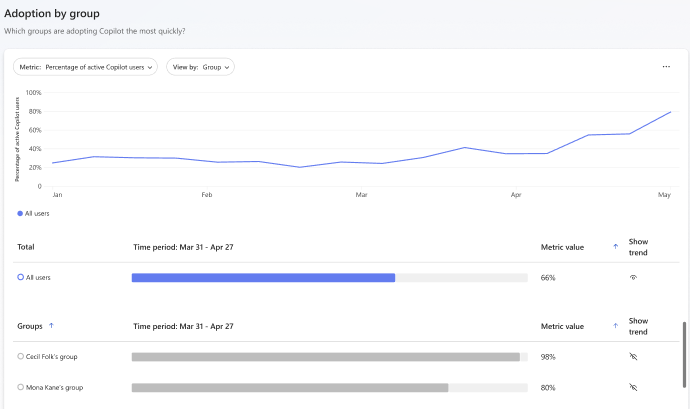
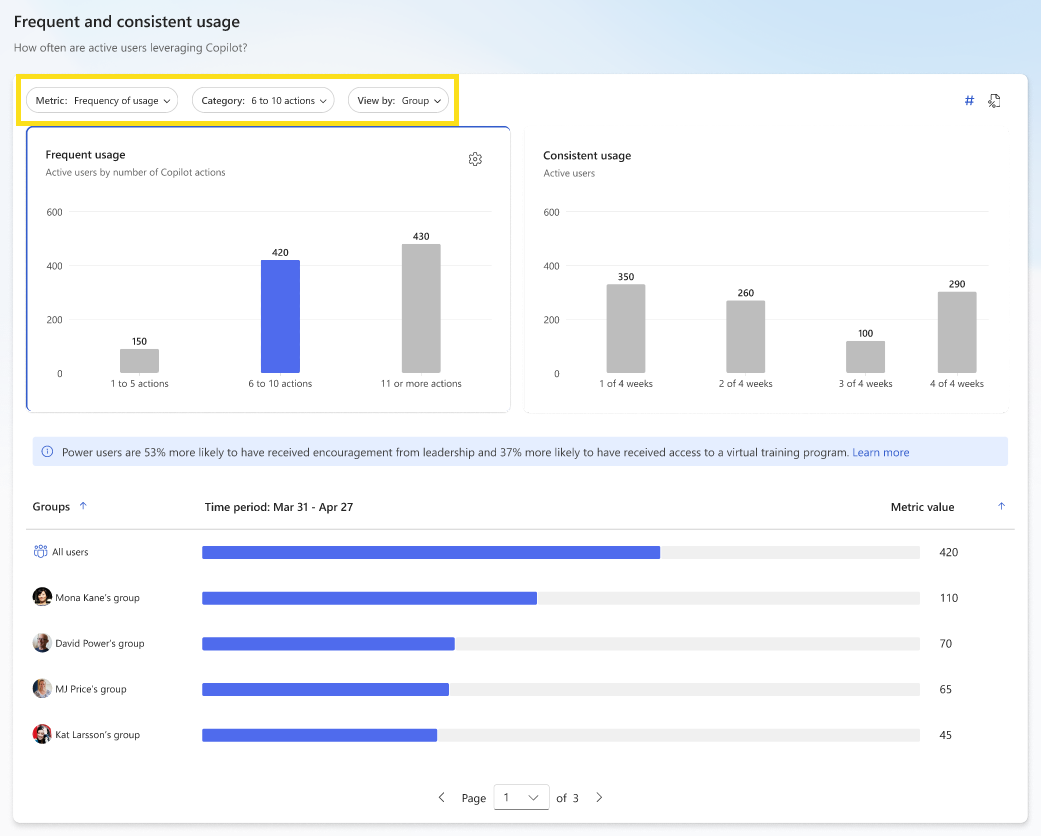
Recognizing the importance of usage insights, Microsoft introduced the Copilot Dashboard as part of Viva Insights for Microsoft 365 Copilot customers. This dashboard is an out-of-the-box analytics tool that provides IT administrators, business leaders, and other stakeholders with a comprehensive view of Copilot adoption within their organization.
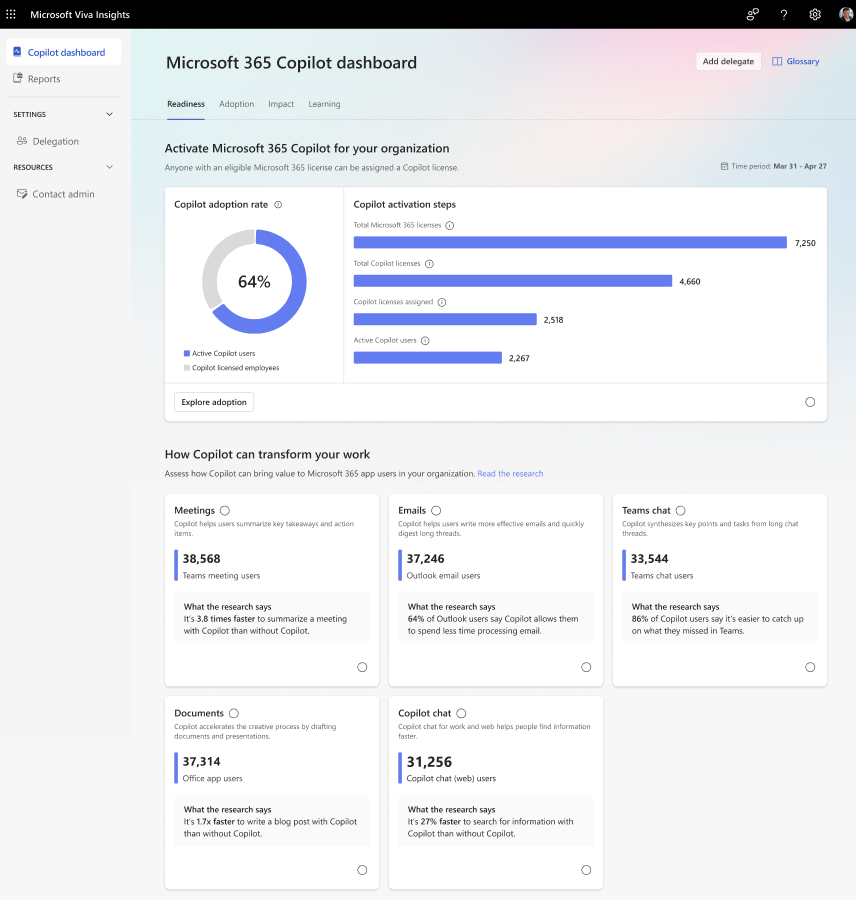
Image from Microsoft
Key features of the Copilot Dashboard include:
While Microsoft’s built-in dashboard is powerful for what it covers, many organizations will find they need to go beyond the basics to get a truly complete picture of AI adoption and its business impact. This is where more advanced analytics solutions enter the fray, adding depth and breadth to the insights.
While Microsoft’s Copilot Dashboard gives a solid snapshot of usage within the Microsoft 365 environment, many organizations require a more holistic and customizable approach to measure AI adoption and impact. Enter Worklytics – a people analytics platform designed to help companies measure, optimize, and accelerate AI adoption across their workforce. Worklytics serves as a unified AI adoption dashboard, aggregating data from multiple tools and delivering advanced analysis that extends beyond basic usage reports.
What sets Worklytics apart? Here are some key capabilities and benefits:
Modern enterprises often have a suite of AI-powered tools: Microsoft 365 Copilot for documents and emails, GitHub Copilot or other coding assistants for developers, Slack or Teams with AI bots, Zoom with AI meeting transcripts, CRM assistants like Salesforce Einstein or Google’s Duet AI (formerly “Gemini” in Workspace), and standalone services like ChatGPT.
Worklytics can connect data from all these corporate AI tools into one consolidated view. This means you’re not limited to Microsoft’s telemetry. If your sales team uses an AI in Salesforce and your dev team uses GitHub Copilot, Worklytics will pull in both alongside Office 365 metrics.
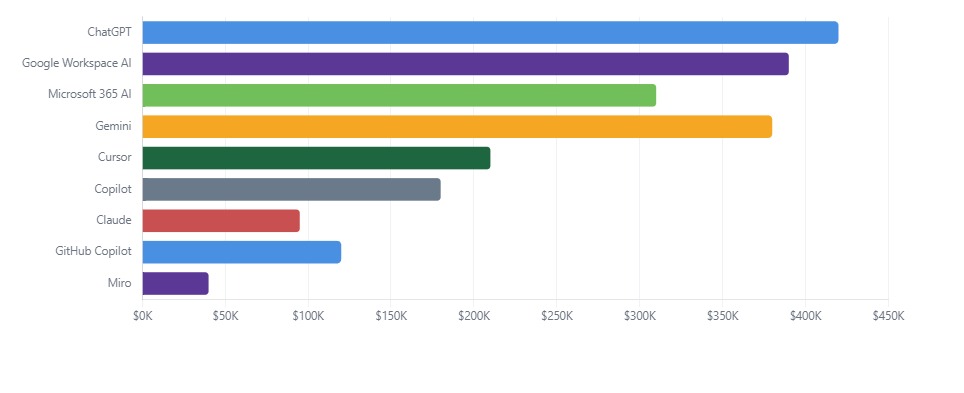
Estimated productivity value and time saved per tool, across the org
Why does this matter? Adoption breadth and value generated don't always move together. A tool used by many people for a few minutes saves less than a specialist tool used deeply by a smaller group. Value per tool tells you where the real return on your AI portfolio is coming from.
Take action: Cursor generates $210K from a fraction of users — the highest value-per-user in the portfolio. If coding teams aren't all using it, that's an easy win. Gmail AI and Gmeet generate value through sheer volume of use across the org.
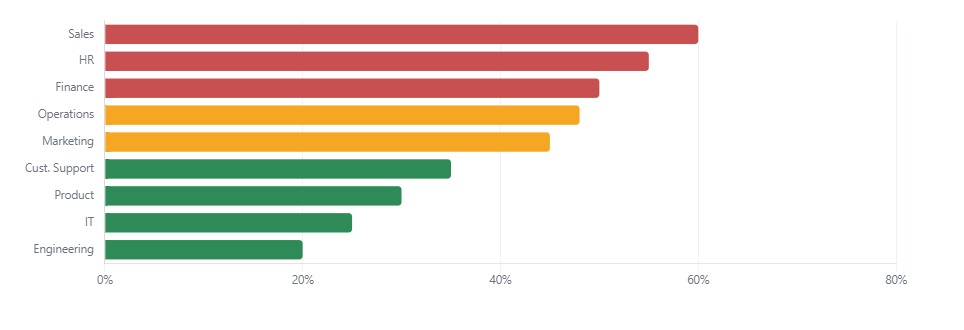
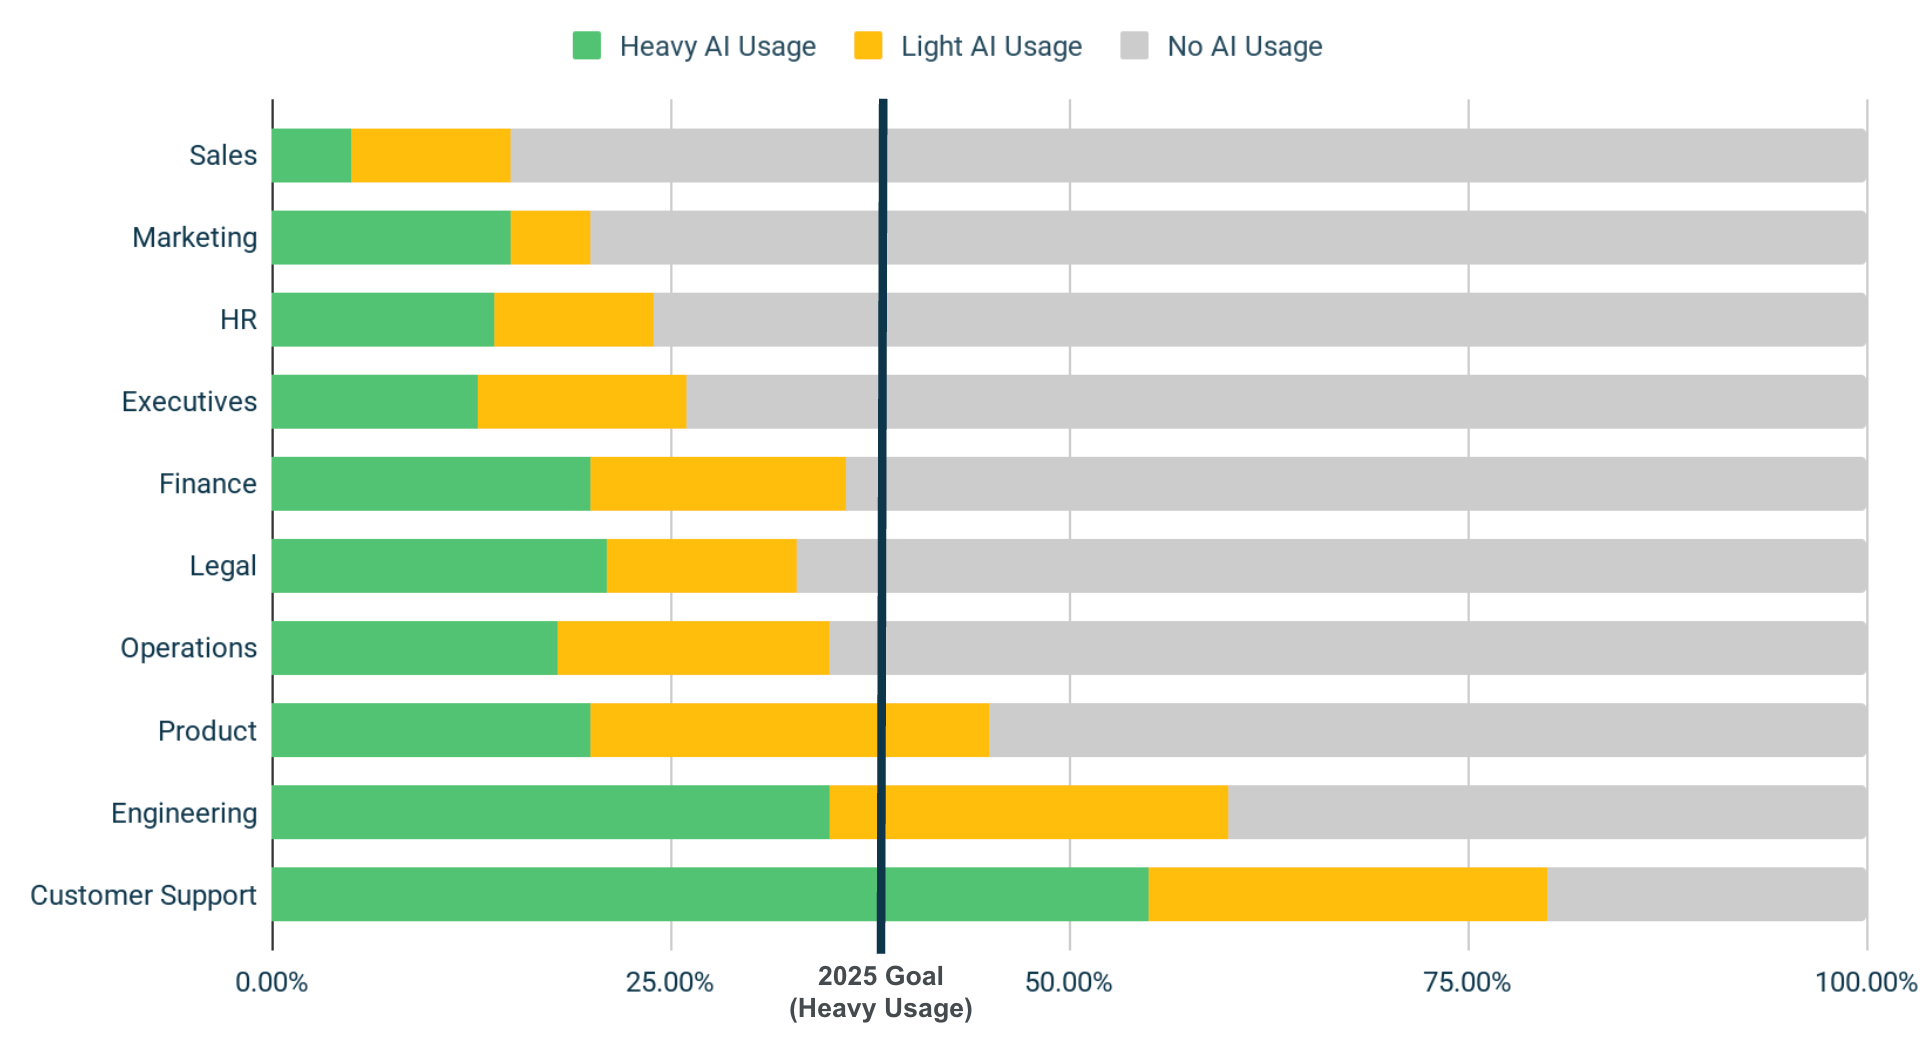
% of employees with zero AI use, ranked worst to best
Why does this matter? Sorting by non-active rate immediately surfaces where to focus enablement investment. Groups at the top of this chart have the most employees who have never opened an AI tool — the lowest-hanging fruit for lifting org-wide adoption.
Take action: Sales (60%), HR (55%), and Finance (50%) each have role-specific AI use cases with high ROI and low setup friction — email personalization for Sales, job description and policy drafting for HR, formula and analysis assistance for Finance.
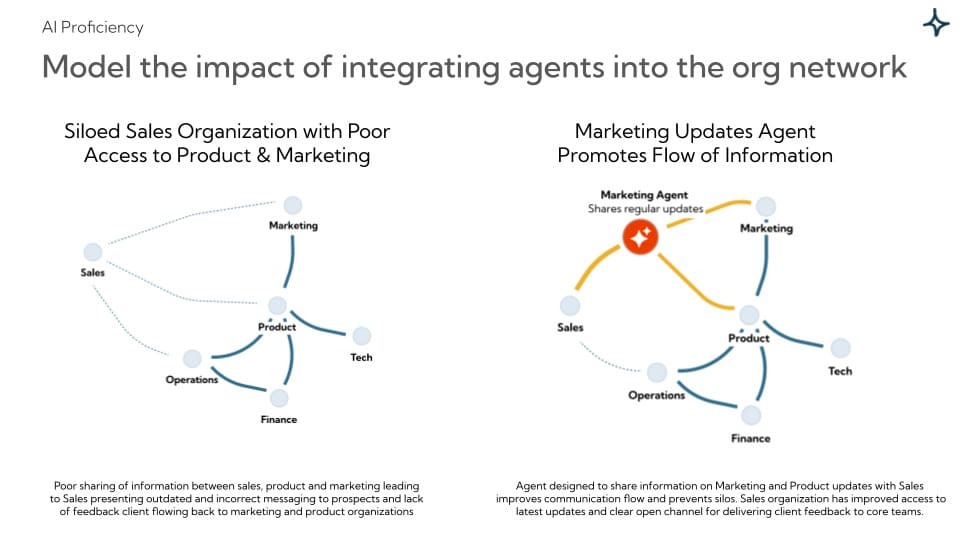
Because Worklytics is a full-fledged people analytics platform, it can analyze not just the AI usage itself but how it intersects with collaboration patterns and networks in your organization. For example, Worklytics can map how AI adoption spreads through your internal social networks – identifying “influencers” or champions who drive adoption by example.It can also observe if AI usage changes communication behavior (maybe teams that embrace AI have shorter meetings or fewer back-and-forth emails, indicating efficiency).
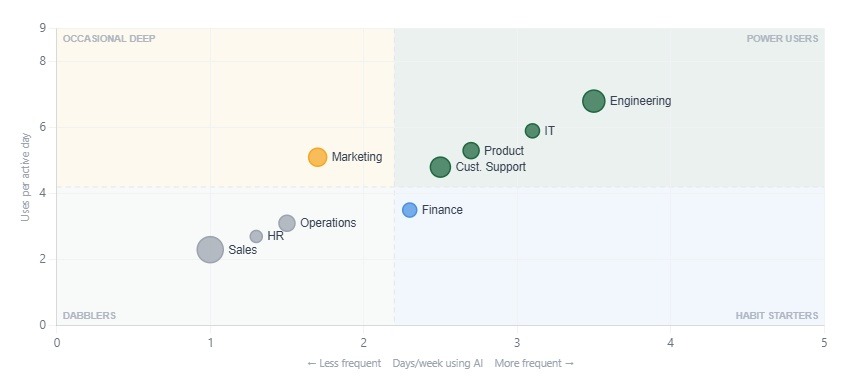
Departments plotted by frequency (days/week) vs. intensity (uses per active day)
Why does this matter? Two groups can have the same weekly active rate but sit in completely different quadrants. A group in "Occasional Deep" already finds AI valuable — they just need a daily trigger. A "Habit Starter" group uses AI every day but only scratches the surface — they need deeper use-case exposure. The enablement play is different for each.
Take action: Sales (largest bubble, bottom-left) needs both frequency and depth. Marketing in "Occasional Deep" already has the value signals — build a daily habit around what's already working for them.
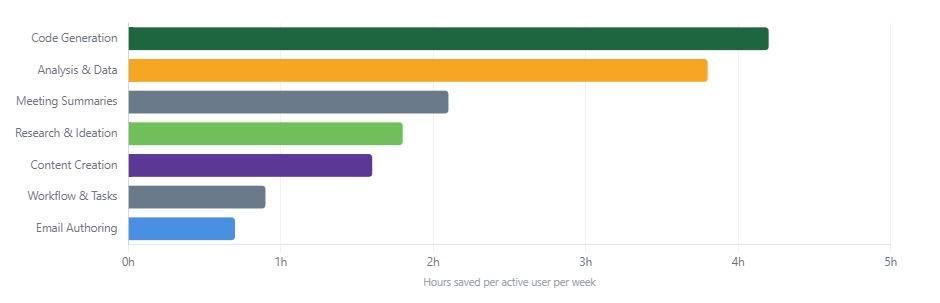
Average hours saved per active user per week, by task category
Why does this matter? Not all AI use is equally valuable. Code generation and analysis tasks tend to save the most time per interaction — while high-volume tasks like email save less per use but add up through sheer frequency.
Take action: Code generation and analysis are the highest-value use cases per person. If your largest functions are Sales and Support — heavy email users — the opportunity is to shift them toward higher-value use cases, not just more email.
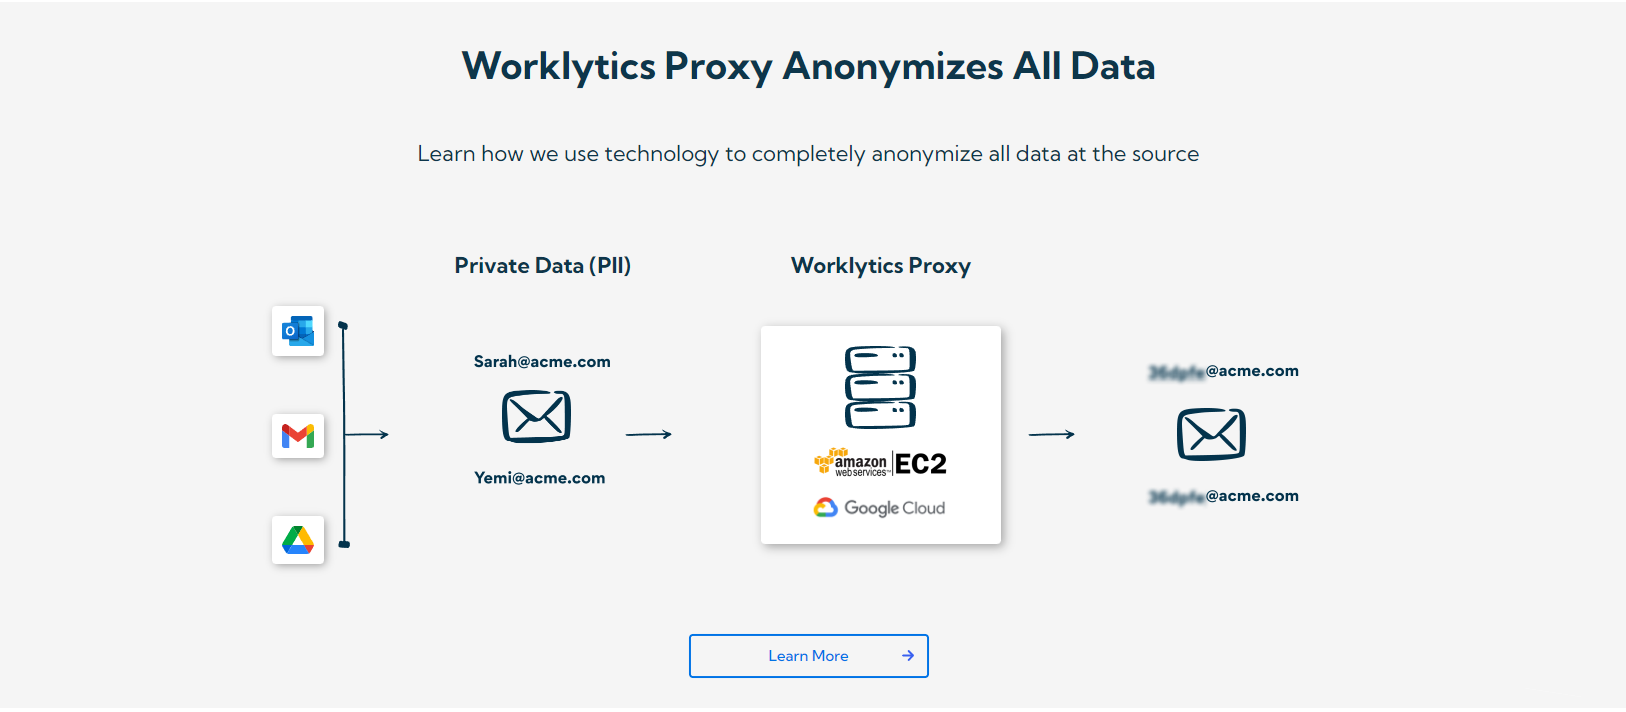
Given the sensitive nature of employee data, Worklytics is designed with a privacy-first approach. Insights are aggregated and anonymized, focusing on team-level trends rather than individual surveillance.
This is critical for maintaining employee trust. Worklytics ensures that while you get detailed analytics, you’re not crossing privacy lines – for example, it might highlight that Team X had a 60% adoption rate without naming which specific employees did or did not use the tool. Role-based access and data minimization techniques are used so that managers see only the insights relevant to their scope. In an era where 86% of employees believe employers should be transparent about any monitoring, Worklytics positions itself as an ethical analytics solution that balances insights with privacy. This means you can confidently use the data to drive decisions without fear of violating trust or regulations.
In essence, Worklytics acts as a supercharged Copilot Dashboard that aggregates all your AI tool data, adds richer context, and allows custom analyses to truly measure adoption and impact. By combining Microsoft’s telemetry with Worklytics’ organizational insights, companies gain the deep understanding needed to drive successful AI transformation. It’s not about manically tracking every click; it’s about surfacing the patterns that matter – where AI is working, where it’s not, and why.
In summary, measure what matters. AI can profoundly change how we work – making us faster, more creative, and more efficient – but its value must be captured with insight. Microsoft’s Copilot Dashboard and advanced analytics from Worklytics give you that insight. By leveraging these tools, you’ll not only track AI adoption, you’ll actively drive it, creating a virtuous cycle where greater adoption leads to greater impact, which in turn fuels even stronger adoption. This data-driven approach turns AI from a promising experiment into a proven, transformative business capability.
Ready to move from guesswork to clarity in your AI journey? By embracing an AI adoption dashboard and partnering with solutions like Worklytics, you equip your organization to measure, learn, and succeed in the new era of intelligent work. Let data be your guide as you unlock the full potential of Copilot and beyond. Here’s to turning AI insights into action – and watching your teams thrive in partnership with their new digital copilots.