
Individual results from Claude Code are well documented. Anthropic surveyed 132 of its own engineers and researchers and found that 27 percent of Claude-assisted work consisted of tasks that would not have been done at all without the tool, such as refactors and internal dashboards that were previously deprioritized. A separate seven-month observational study of Claude Code sessions showed the share of sessions spent debugging fell by nearly half as usage shifted toward end-to-end agentic work like deploying code and analyzing data.
Those individual gains often fail to appear in quarterly delivery metrics, and the reason is structural rather than statistical. When code generation accelerates, the constraint moves downstream to code review and validation. More pull requests enter the pipeline, review queues lengthen, and deployment frequency stays flat even though each engineer is producing more. If you only measure delivery outcomes, the gains are invisible. If you only measure individual sentiment, the gains are unverifiable. Accurate measurement has to connect three layers at once: who is using Claude Code, what portion of work it touches, and what that coverage is worth in hours and dollars.
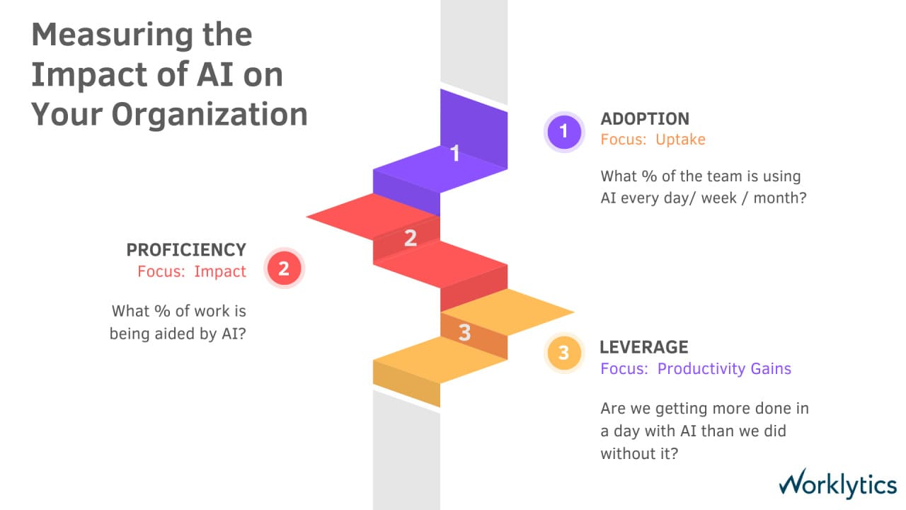
Productivity gains are a comparison, and a comparison needs a starting point. The most common failure in Claude Code measurement is jumping straight to output metrics without recording what adoption and work patterns looked like before rollout, which leaves any later improvement unattributable. A three-stage model prevents this. Adoption answers what percentage of the team uses Claude Code daily, weekly, or monthly. Proficiency answers what percentage of engineering work is being aided by AI. Leverage answers whether the team is completing more in a day than it did without the tool. Each stage depends on the one before it: leverage claims collapse under scrutiny if you cannot show which cohort adopted the tool and how deeply it penetrated their work.
Worklytics structures its AI adoption measurement around this exact sequence, building each stage from metadata in the tools engineering teams already use rather than from surveys, so the baseline exists on day one instead of being reconstructed from memory.
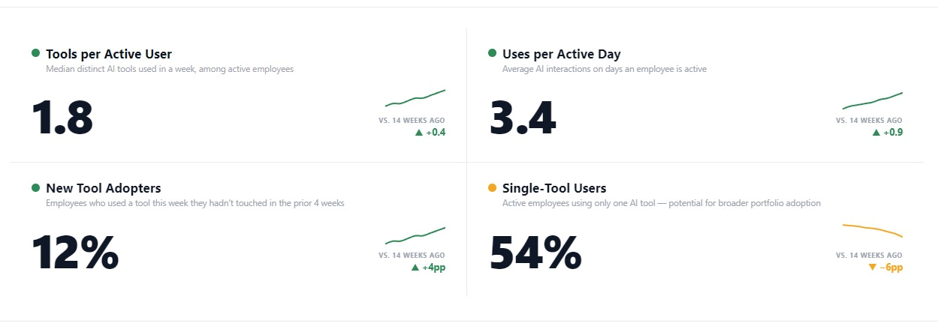
Seat counts overstate adoption and understate value. The metrics that actually describe Claude Code usage are weekly active users, percentage of the engineering workforce active, days per week of use, uses per active day, and the trend across a rolling window of at least 12 to 14 weeks. The trend matters as much as the level, because agentic coding tools follow a habit curve: usage that grows week over week signals workflow integration, while flat usage at any level signals a tool that never left the experimentation phase.
Claude typically presents a specialist profile in this data. In one Worklytics deployment view, Claude reached 15 percent of the workforce at 2.1 days per week, yet posted 4.2 uses per active day and grew 22 percent over 14 weeks, the fastest growth of any tool in the portfolio. Cursor showed the same shape at 6 percent of the workforce and 6.8 uses per active day. Broad assistants like Copilot inverted the pattern, reaching more people at lower intensity. This distinction changes decisions. A specialist tool is evaluated on depth and growth within its user base, not on organization-wide penetration, and enablement budget goes toward expanding the specialist cohort rather than nudging light users.
Claude-specific dashboards break that intensity down one level further, by surface. Claude.ai is conversational assistance, Claude Code is agentic delegation, and the two represent different maturity stages rather than interchangeable interfaces. The crossover moment in the trend below, where Claude Code active share among engineers climbs past conversational use, is the signal that a team is shifting from asking AI questions to handing AI tasks. That shift matters for measurement because productivity gains concentrate almost entirely in the delegation population, so tracking Claude usage as a single undifferentiated number dilutes exactly the cohort you are trying to measure.
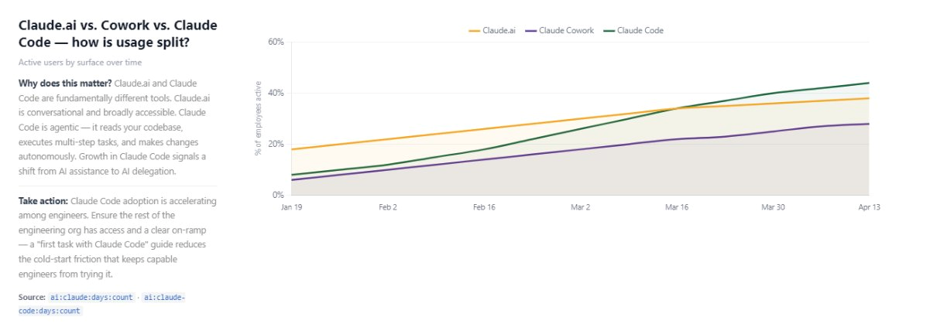
Active users by Claude surface over time: Claude Code adoption accelerating past conversational use is the delegation signal that precedes measurable delivery gains.
Collecting this data does not require reading code or prompts. Worklytics ingests usage metadata from Anthropic admin data alongside the rest of the stack, following a privacy-first architecture that aggregates at team level. For the setup details, see the Worklytics guides to tracking Claude Code usage and measuring Cursor utilization across an engineering organization.
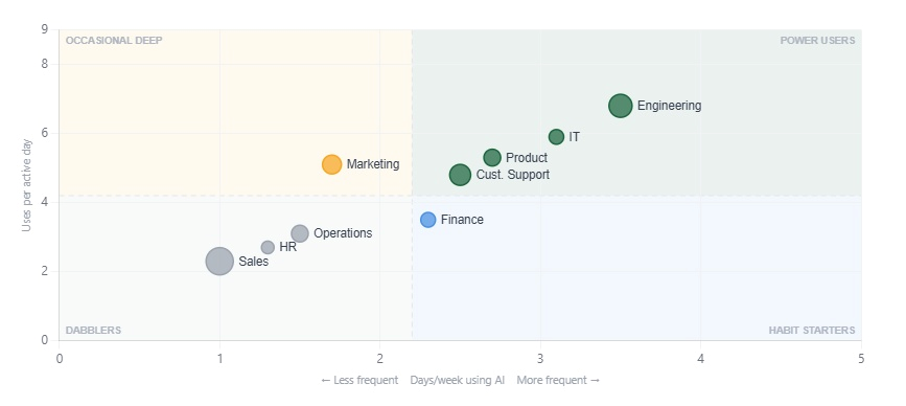
Averaging productivity across everyone with a license dilutes the signal until it disappears. If 40 engineers use Claude Code four or more days a week and 160 opened it twice last month, an org-wide average will show almost nothing, and skeptics will conclude the tool does not work. Plotting frequency against intensity, days per week on one axis and uses per active day on the other, splits the population into power users, habit starters, occasional deep users, and dabblers. Productivity gains should be measured within the power-user cohort against a matched cohort of non-users doing comparable work, because that is the only comparison where the treatment is real.
The quadrant also reveals where the next gains come from. Habit starters who use Claude Code frequently but shallowly respond to workflow training, such as multi-step agentic patterns. Occasional deep users respond to habit triggers, such as integrating Claude Code into CI or code review. Dabblers may simply hold seats that should be reallocated at renewal.
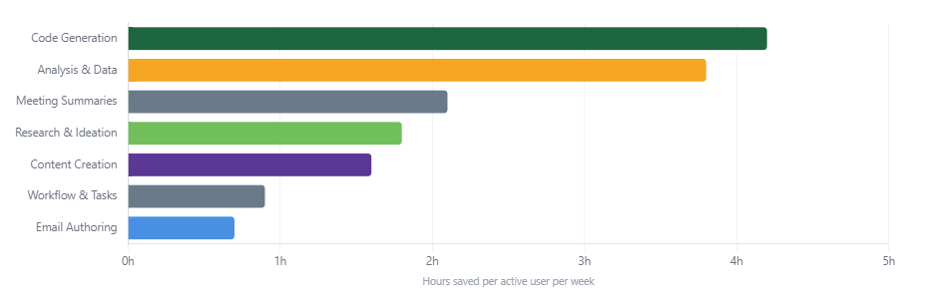
Usage counts become productivity claims only when they are mapped to the work being displaced. The method is to classify AI-assisted activity into task categories, code generation, analysis and data work, meeting summaries, research, content creation, and workflow management, then apply a time-saved model per category calibrated against calendar and collaboration signals. Categories differ sharply in value. In Worklytics benchmark data, code generation leads at 4.2 hours saved per active user per week, followed by analysis and data work at 3.8 hours, while email authoring contributes under one hour. This is why engineering-focused tools like Claude Code can justify their cost with a fraction of the user base a general assistant needs: the task category they accelerate is the most expensive one.
At the organization level these per-user figures compound quickly. A mid-size deployment in the same benchmark set produced roughly 1,240 saved hours per week across active AI users, translating to an annualized 2.4 million dollars in productivity value, with 68 percent of automatable work still untouched. Worklytics automates this classification and rollup inside its productivity analytics, and its free AI ROI calculator lets teams model the same math before instrumenting anything.
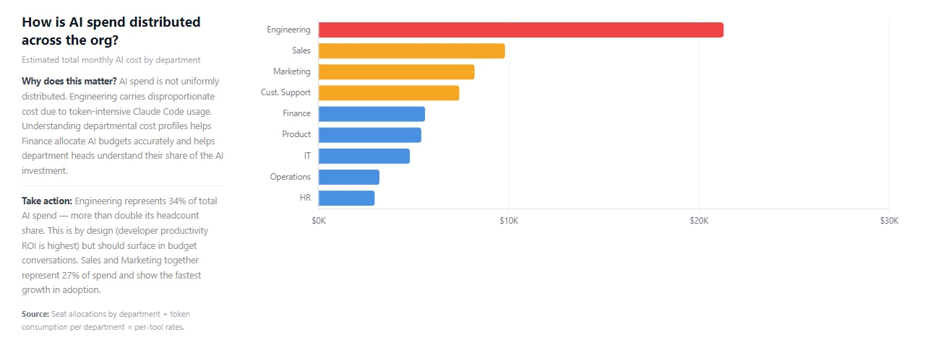
Claude Code pricing scales with token consumption, so spend grows with exactly the usage you are trying to encourage. That makes cost per hour saved the honest efficiency metric, not total spend. Engineering routinely carries a disproportionate share of AI budget, around 34 percent of total AI spend against a much smaller headcount share in Worklytics deployment data, and that allocation is defensible only if the value side of the ledger is visible. Plotting monthly cost against estimated monthly value per tool surfaces both kinds of outliers: tools with modest cost and strong measured value, where Claude frequently lands because of its concentration in code generation, and tools with large license commitments but weak weekly active usage, which become right-sizing conversations at renewal.
Before computing cost per hour saved, look at where the spend actually sits. Department-level cost stacked by surface, as in the illustrative view below, typically shows engineering carrying the majority of Claude spend, almost entirely from Claude Code, with engineering near 58 percent of the total in this example. That concentration is expected rather than alarming: agentic sessions are token-intensive by design, and the ROI case is strongest exactly where spend is highest. The same view also identifies the opposite case. Functions whose usage is primarily conversational carry low cost per active user, and for them the right response is adoption enablement, not cost optimization.

This reconciliation is also what converts measurement into budget authority. Finance approves expanded Claude Code spend when the request arrives as cost per saved engineering hour with a trend line, not as a sentiment survey. Worklytics ties tool-level cost data to the same task classification used for hours saved, so the ratio updates continuously inside its engineering effectiveness reporting.
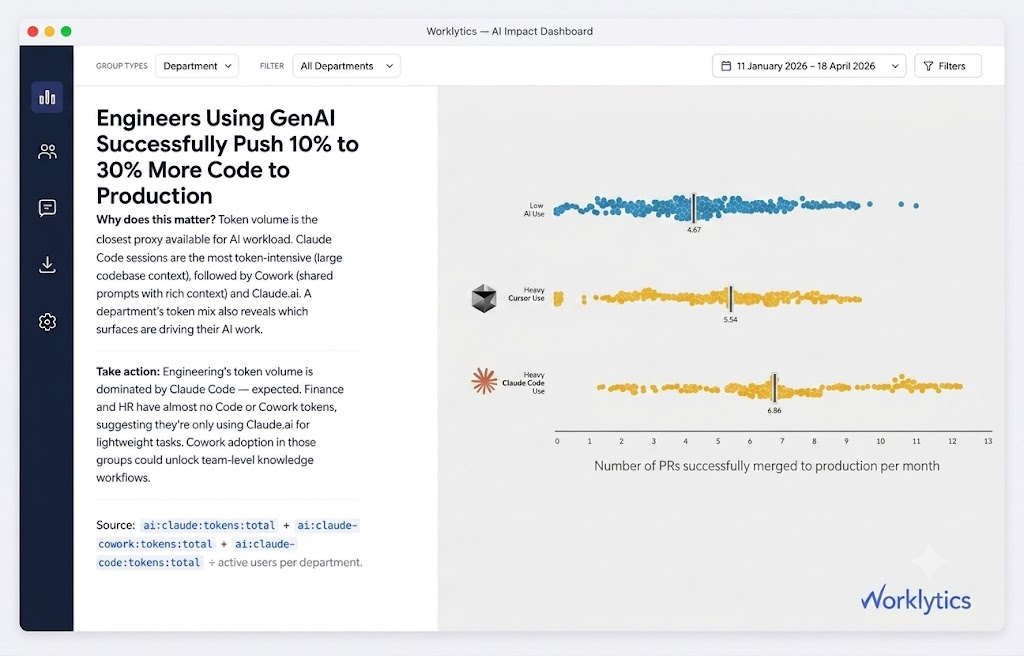
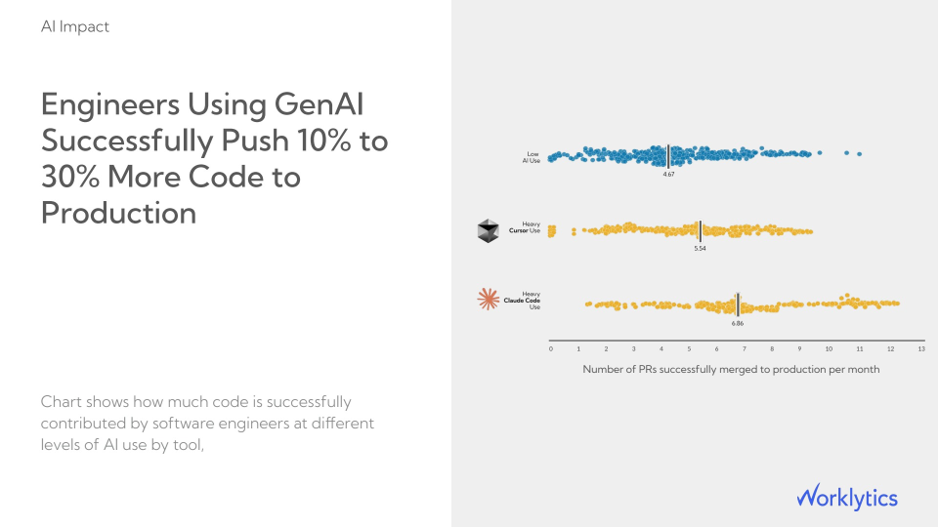
Hours-saved models are estimates, so the final proof has to come from delivery data itself. The cleanest test compares merged pull requests per engineer per month across usage cohorts doing comparable work. In Worklytics engineering impact data, engineers with heavy Claude Code use merged a median of 6.86 PRs to production per month against 4.67 for low AI use peers, with heavy Cursor users landing between the two at 5.54. Across tools and deployments this settles into a 10 to 30 percent lift in code successfully pushed to production. Reading the distribution matters as much as the median: if the lift comes from the whole cohort shifting right, the gain is real and broad, but if a few outliers drag the median up, the tool is amplifying existing top performers rather than raising the floor, and the enablement strategy differs accordingly.
Producing this view requires joining AI usage cohorts with source control activity, which is where measurement usually stalls when teams attempt it with spreadsheets. Worklytics builds the cohort comparison natively in its Workplace Insights Dashboards, and teams that want to run their own regressions can pipe the underlying usage data into a warehouse through DataStream and join it against GitHub or Jira records directly. The full list of supported sources is on the integrations page.
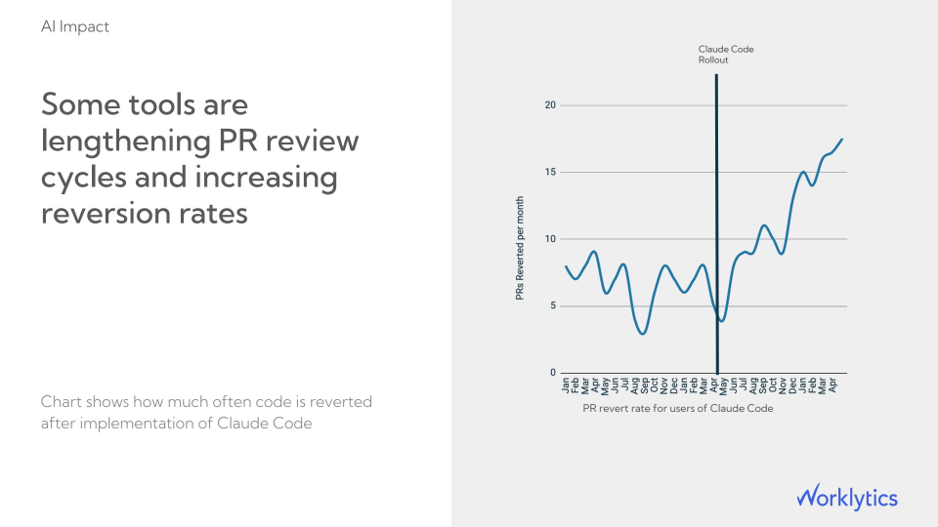
More merged code is only a productivity gain if it stays merged. Generation speed can outrun review capacity and test coverage, and when that happens the failure shows up as lengthening PR review cycles and a rising reversion rate in the months after rollout. In one Worklytics engineering impact view, PRs reverted per month among Claude Code users climbed from a pre-rollout baseline of roughly 5 to 8 toward 15 to 18 within a year of deployment. Left uninstrumented, that pattern silently refunds the hours the tool saved, because every reverted PR consumes generation time, review time, and remediation time. The corrective is not less AI but explicit guardrails: revert rate, review cycle length, and change failure signals tracked on the same dashboard as adoption, so a spike triggers investment in test infrastructure and review capacity before the quarter closes.
This pairing is also what keeps the measurement credible with engineering leadership. A report that shows PR volume up and stays silent on reversion invites the suspicion that the gains are cosmetic. Worklytics places quality guardrails beside output metrics inside its engineering effectiveness reporting, and trend tracking over rolling windows makes the post-rollout inflection visible while it is still cheap to fix.
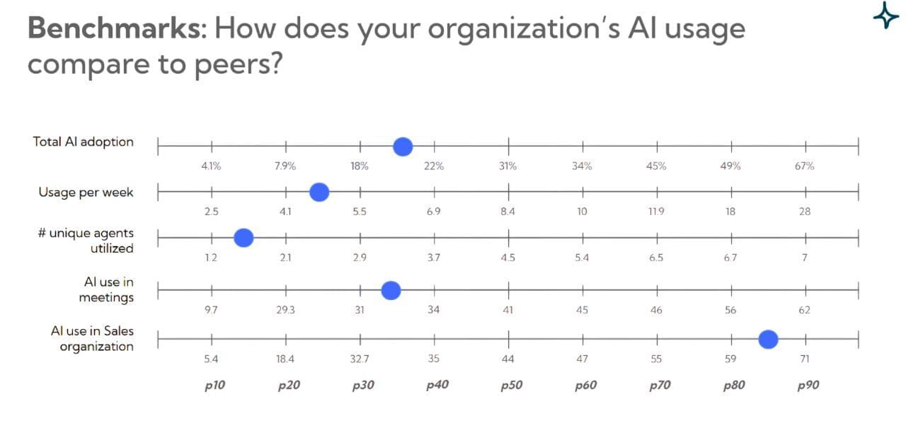
Internal trend lines answer whether you are improving, but not whether you are competitive. Fifteen percent workforce adoption of Claude Code might be a leading position in one industry and a lagging one in another, and without external reference points, leadership debates the number instead of acting on it. Percentile benchmarking resolves this by placing metrics like total AI adoption, weekly usage, unique agents utilized, and function-level adoption on a distribution of peer organizations. An organization sitting at the 40th percentile on total adoption but the 85th on AI use in its sales organization knows precisely where its next intervention belongs, which is a sharper conclusion than any internal dashboard can produce alone.
Worklytics benchmarks express each adoption and usage metric as a peer percentile, so Claude Code results are read against the market rather than against last quarter only.
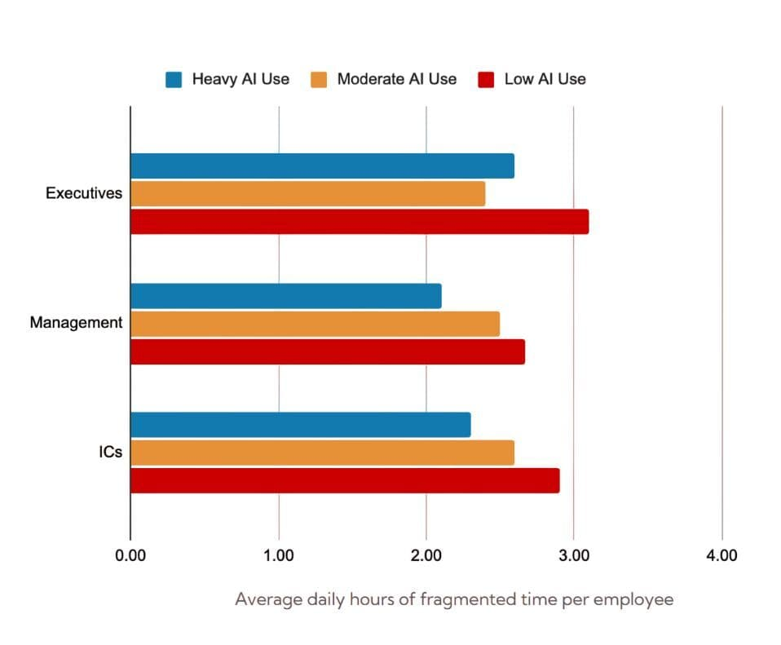
Hours saved are only a gain if they are reinvested in valuable work rather than absorbed by fragmentation. The downstream risk of faster code generation is a heavier review and coordination load, which can quietly consume the time the tool created. Fragmented time is a useful early-warning metric here. In Worklytics illustrative data, individual contributors with heavy AI use averaged 2.3 daily hours of fragmented time against 2.9 hours for low-use peers, and executives showed the same gap at 2.6 against 3.1 hours. The direction matters: when heavy Claude Code users show rising fragmentation instead, it usually means review queues and coordination overhead are eating the surplus, and the fix is process capacity rather than more AI.
A defensible answer to whether Claude Code is paying off comes from one connected chain: baseline, adoption and intensity, cohort comparison, hours saved by task category, cost per outcome, delivery-level validation with quality guardrails, and peer benchmark check on the result. Worklytics runs that chain on metadata from the tools your teams already use, with first metrics typically available within a week of connecting. Book a demo to see the AI adoption dashboard against your own Claude Code deployment.
No. Every metric in this framework, including active usage, depth, task classification, and hours saved, is built from usage metadata aggregated at the team level. Privacy-first platforms like Worklytics never analyze the content of prompts, outputs, or source code, which is also what makes deployment viable with works councils and privacy review.
Four to eight weeks of pre-adoption data is enough to establish stable patterns for delivery cadence, collaboration load, and focus time. If Claude Code is already deployed, a matched-cohort comparison between heavy users and non-users doing comparable work substitutes for a temporal baseline.
Attribution requires tool-level usage data and task classification per tool. When code generation hours are tied to Claude Code sessions specifically, and the power-user cohort is defined by Claude Code activity rather than any AI activity, gains in that cohort can be attributed with reasonable confidence. Cross-tool views also prevent double counting when engineers use Claude Code and Cursor in the same week.
Usually not. This pattern typically indicates the bottleneck has shifted to code review and validation, so individual output rose while organizational throughput stayed constrained. Measuring review time and queue length alongside Claude Code usage identifies whether the fix is review capacity, quality gates, or workflow changes rather than more generation speed.
Not necessarily. A rising reversion rate usually signals that review and testing capacity has not scaled with generation speed, not that the generated code is unusable. The evidence-based response is to strengthen quality gates, expand review capacity, and monitor whether the reversion trend flattens over the following one to two quarters while output gains hold. Scaling back the tool removes the gains without addressing the process constraint that caused the reverts.
Worklytics connects to Anthropic usage data and the surrounding stack through APIs, and most organizations see their first adoption and intensity metrics within a week, with trend data meaningful after roughly 30 days and cohort-level productivity comparisons after a full quarter.



