
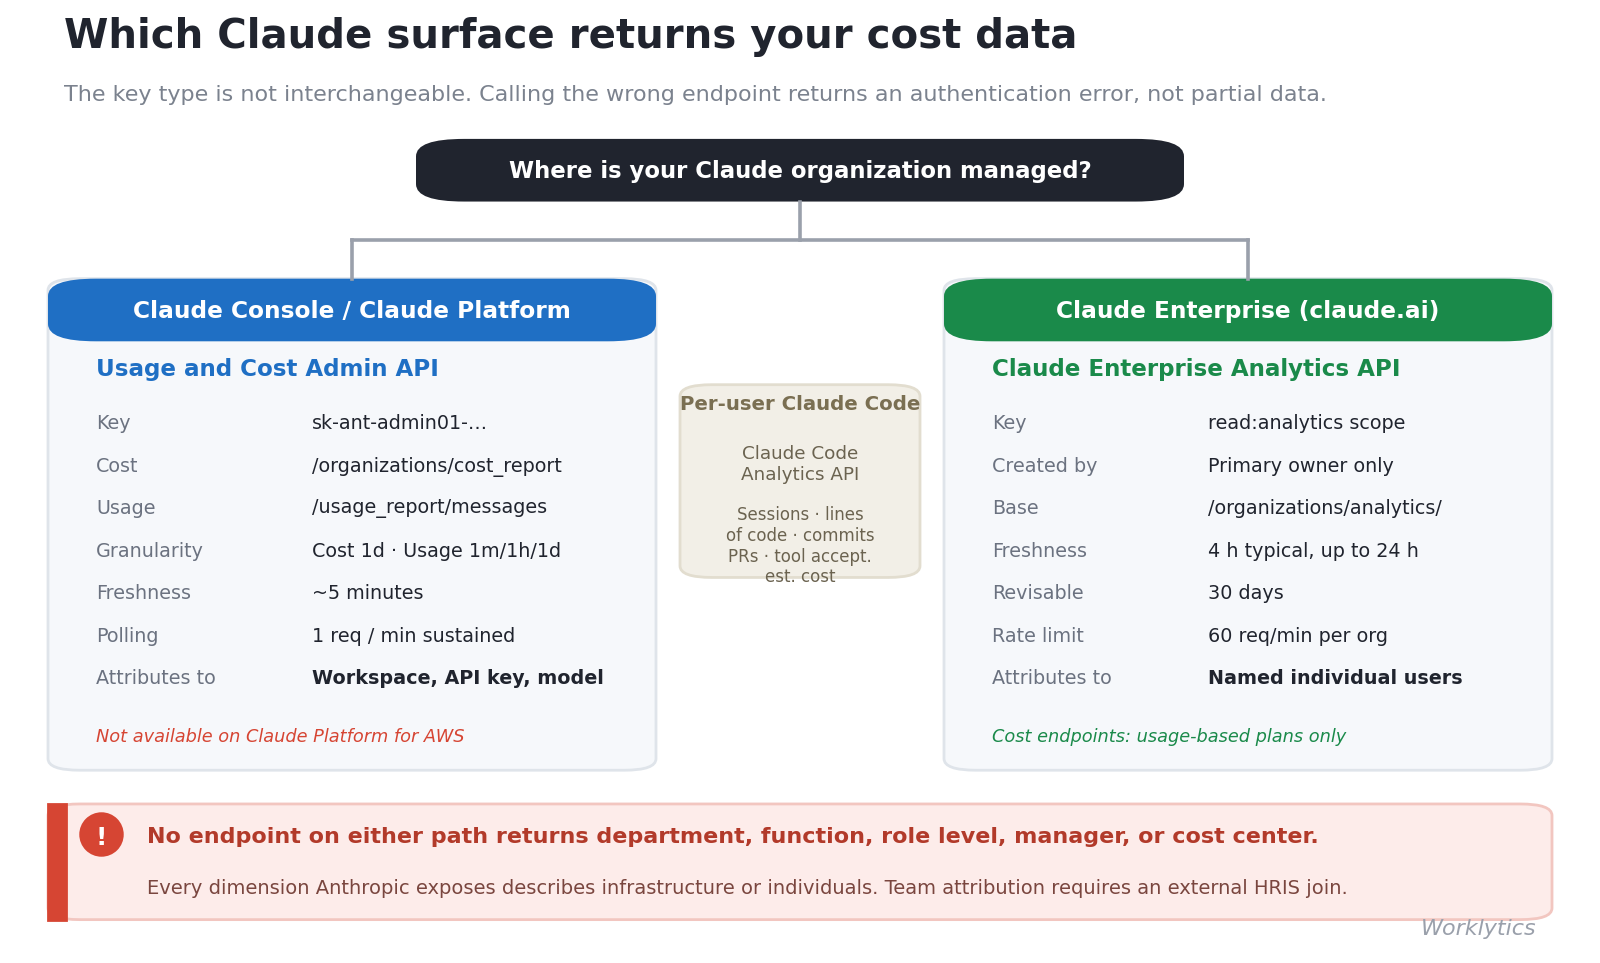
The first decision determines everything downstream, because the two reporting APIs use different keys that are not interchangeable. Calling the wrong one returns an authentication error, not a partial answer.
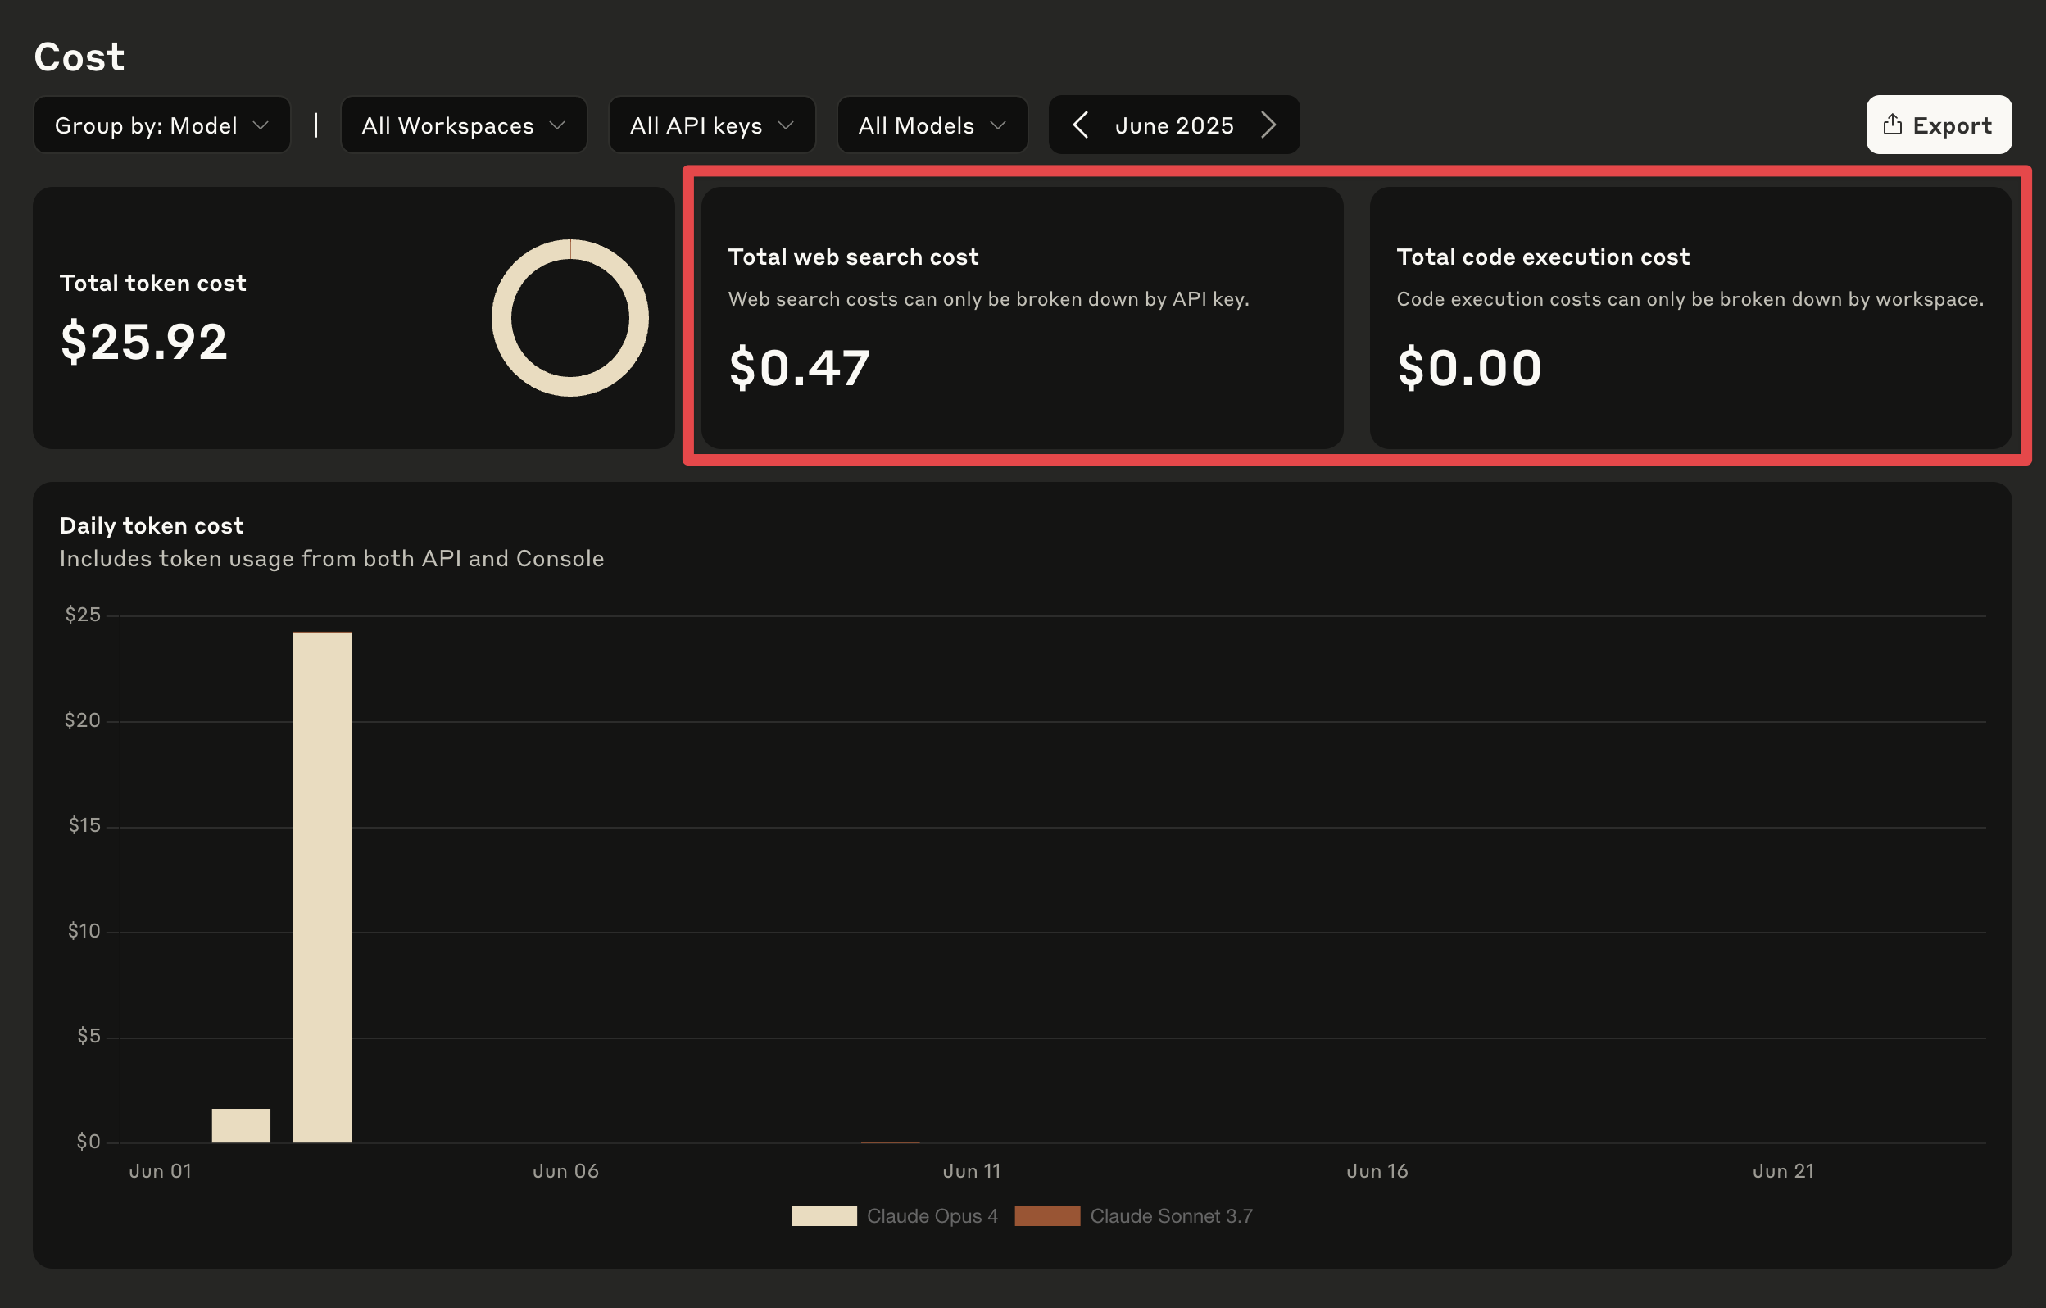
Where to find it: sign in to the Claude Console and open Usage or Cost in the left sidebar. On the Cost page, the Export button (top right) downloads the current view as a CSV; the Usage and Cost Admin API returns the same data programmatically. Anthropic's Cost and usage reporting guide walks through both pages.
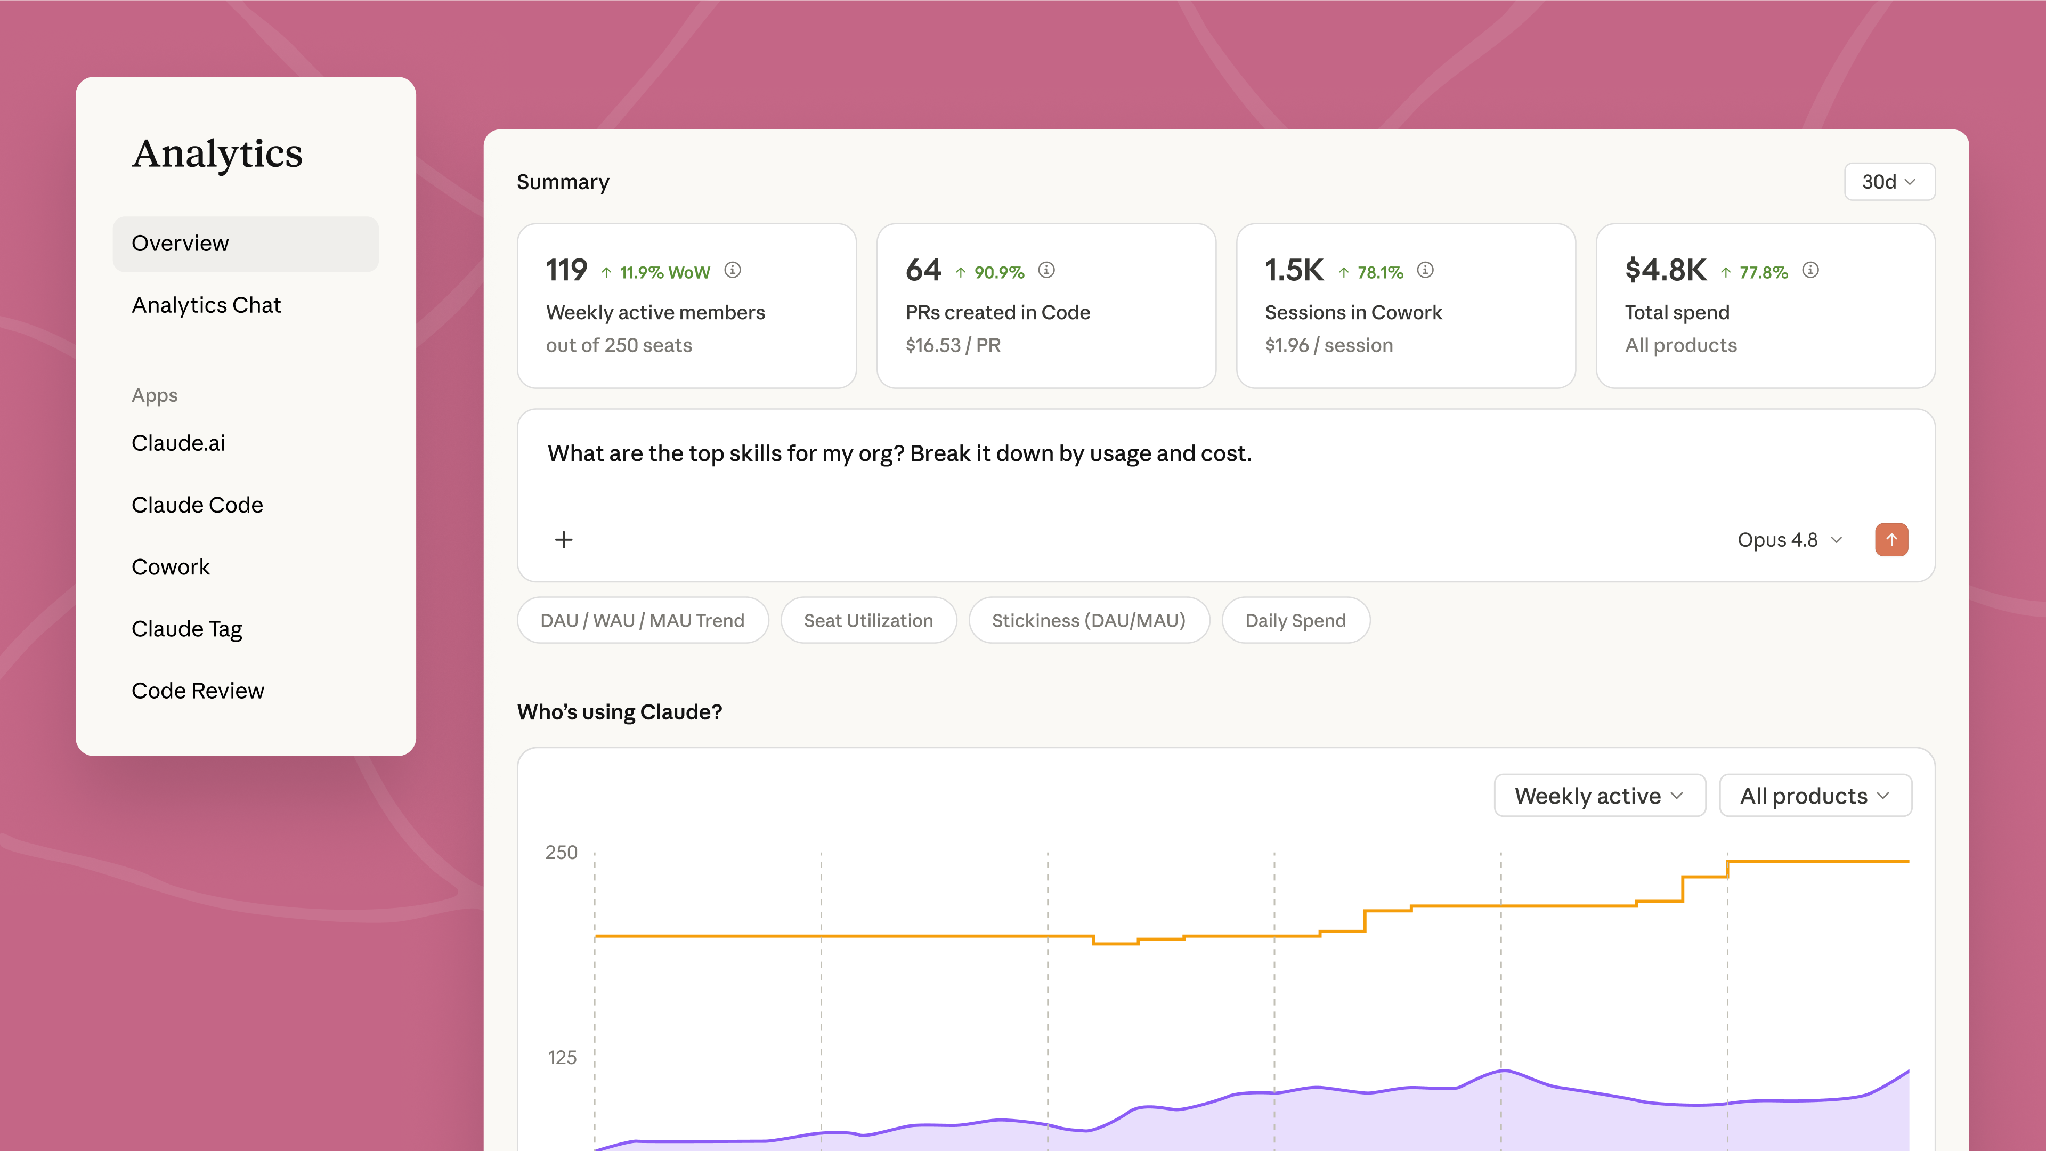
Where to find it: in claude.ai, click your initials in the lower-left corner and choose Analytics. Owners and admins see usage and adoption; spend is visible to owners only. The Claude Enterprise Analytics API returns the same metrics programmatically, and Anthropic's usage analytics guide covers the dashboard.
Most organizations run both products at once, which otherwise means two ingestion pipelines and two key types to maintain. Worklytics reads both paths into a single dataset, so the choice above becomes a configuration detail rather than two parallel exports you reconcile by hand.
If you're on the Console / Platform side, decide which spend you actually need before you pull data: general API spend and Claude Code spend are two different exports, from two different endpoints.
Claude Code token cost also rolls into the general cost report, so don't add the two together; use the Claude Code Analytics API when you specifically want the per-developer view. On a claude.ai Enterprise plan, Claude Code activity comes through the Enterprise Analytics API instead, not this endpoint.
The export follows the same seven steps for every endpoint:
With the key created, an export is a paginated pull over a fixed date range. On the Console side, a monthly cost report grouped by workspace and description is a single call:
curl "https://api.anthropic.com/v1/organizations/cost_report?\
starting_at=2026-06-01T00:00:00Z&\
ending_at=2026-06-30T00:00:00Z&\
group_by[]=workspace_id&\
group_by[]=description" \
  -H "anthropic-version: 2023-06-01" \
  -H "x-api-key: $ANTHROPIC_ADMIN_KEY"
For token-level detail (and for anything billed under Priority Tier), use the usage endpoint, which supports finer buckets and more grouping dimensions:
curl "https://api.anthropic.com/v1/organizations/usage_report/messages?\
starting_at=2026-06-01T00:00:00Z&\
ending_at=2026-06-30T00:00:00Z&\
group_by[]=model&\
group_by[]=service_tier&\
bucket_width=1d" \
  -H "anthropic-version: 2023-06-01" \
  -H "x-api-key: $ANTHROPIC_ADMIN_KEY"
Claude Enterprise organizations call the Analytics API with the Analytics key. The resource paths for user activity, summaries, and cost and usage all live under the analytics base; see the Analytics API reference for each:
curl "https://api.anthropic.com/v1/organizations/analytics/<resource>?\
starting_at=2026-06-01&\
ending_at=2026-06-30" \
  -H "anthropic-version: 2023-06-01" \
  -H "x-api-key: $ANTHROPIC_ANALYTICS_KEY"
For per-user Claude Code cost specifically, the Claude Code Analytics API returns sessions, lines of code, commits, pull requests, per-tool acceptance, and estimated cost by model, one UTC day per request, free to use:
A handful of parameters control every export. These are the ones that change your results:
Two endpoints, one loop. Keep the same parameters on every page and follow the cursor until it runs out:
page=""
while : ; do
  resp=$(curl -s "$BASE/cost_report?starting_at=$FROM&ending_at=$TO&group_by[]=workspace_id${page:+&page=$page}" \
    -H "anthropic-version: 2023-06-01" -H "x-api-key: $ANTHROPIC_ADMIN_KEY")
  echo "$resp" | jq -c '.data[]' >> claude_cost.jsonl
  [ "$(echo "$resp" | jq -r .has_more)" = "true" ] || break
  page=$(echo "$resp" | jq -r .next_page)
done
Three details decide whether the exported rows survive downstream:
To land it somewhere useful, flatten the JSON to CSV on the way out:
jq -r '.data[] | [.date, .workspace_id, (.amount|tonumber/100), .description] | @csv' \ claude_cost.jsonl > claude_cost.csv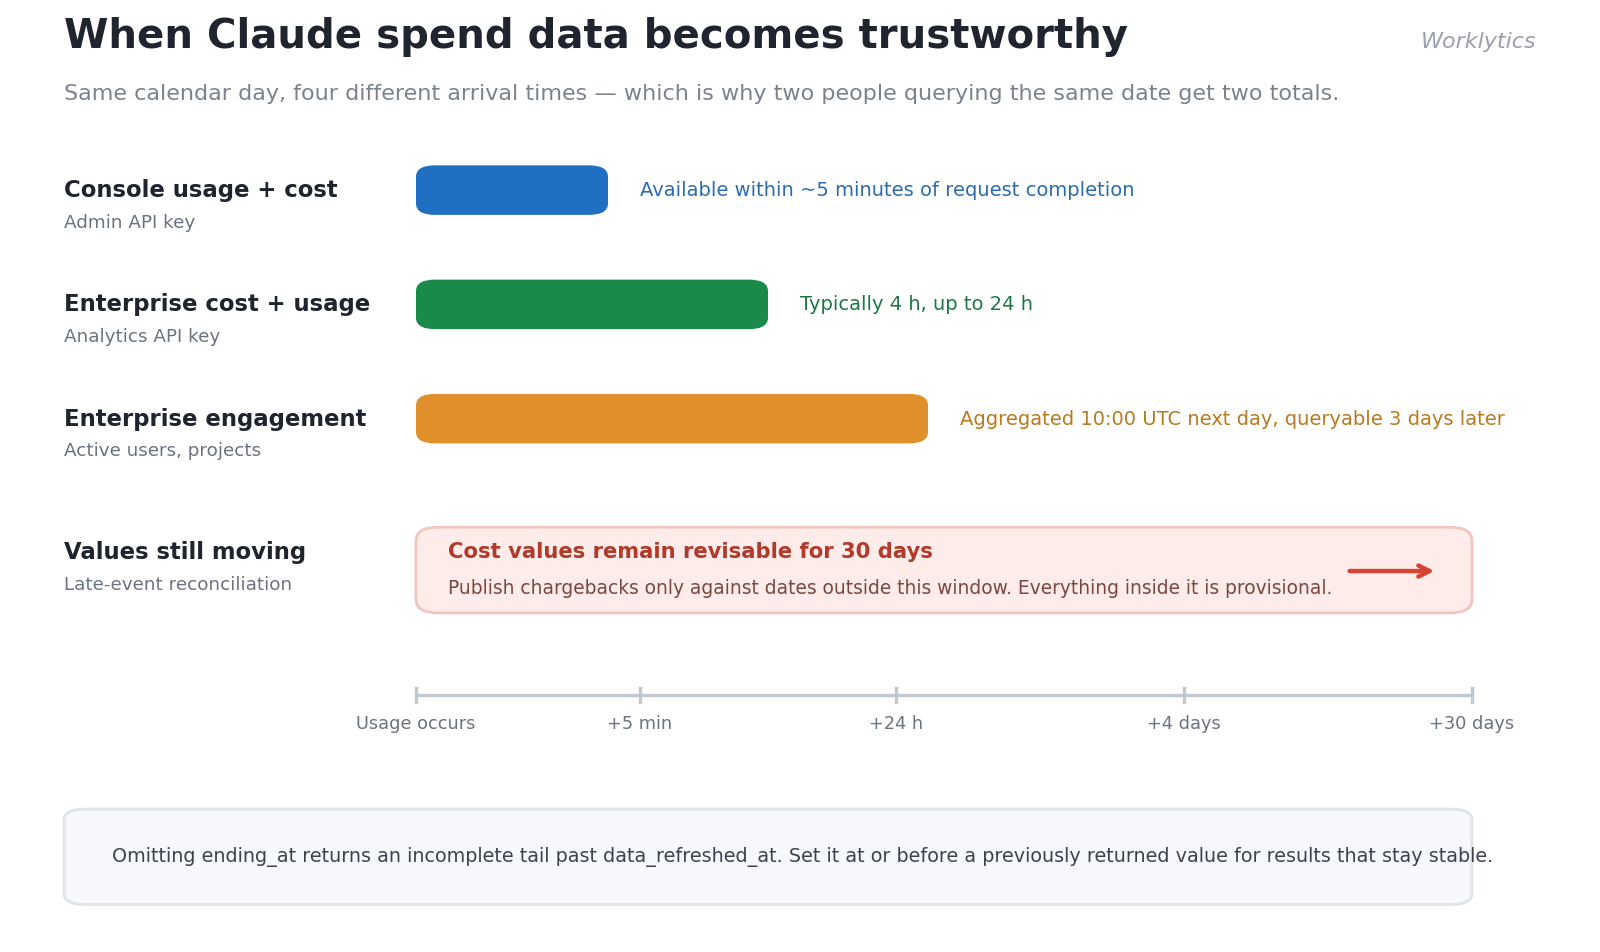
This is the plumbing that quietly breaks internal reporting: the 30-day revision window, the null-key rows, the cursor rules, the cents parsing. Worklytics handles it on ingestion, so Claude cost arrives as a maintained feed with a stable as-of date rather than a script someone babysits each close. One operational note either way: Admin and Analytics keys carry organization-wide read scope, so store them in a secret manager and aggregate per-user spend to group level before sharing it.
A clean export answers one question well: what did we spend on Claude infrastructure. It cannot answer the question finance actually asks (what did each team spend), and the reasons are structural, not a matter of finding the right parameter.
Anthropic's billing model has no concept of your org chart. The cost report groups by workspace and description; usage adds API key, model, service tier, context window, data residency, and speed. Every one of those describes infrastructure. Two teams sharing a workspace are indistinguishable, and a contractor and a VP of Engineering on the same API key produce identical rows.
This is the gap Worklytics closes first: it maps each workspace and user to an HRIS record, so the same rows carry department, function, role, level, manager, and tenure.
"Claude spend" is really three billing realities (direct API usage, Claude Code, and Enterprise seats) that sit in different systems and refresh on different schedules. Priority Tier costs appear only in the usage endpoint; Code Execution only in the cost endpoint; Workbench activity carries no API key at all. Assembling one number means stitching these together yourself.
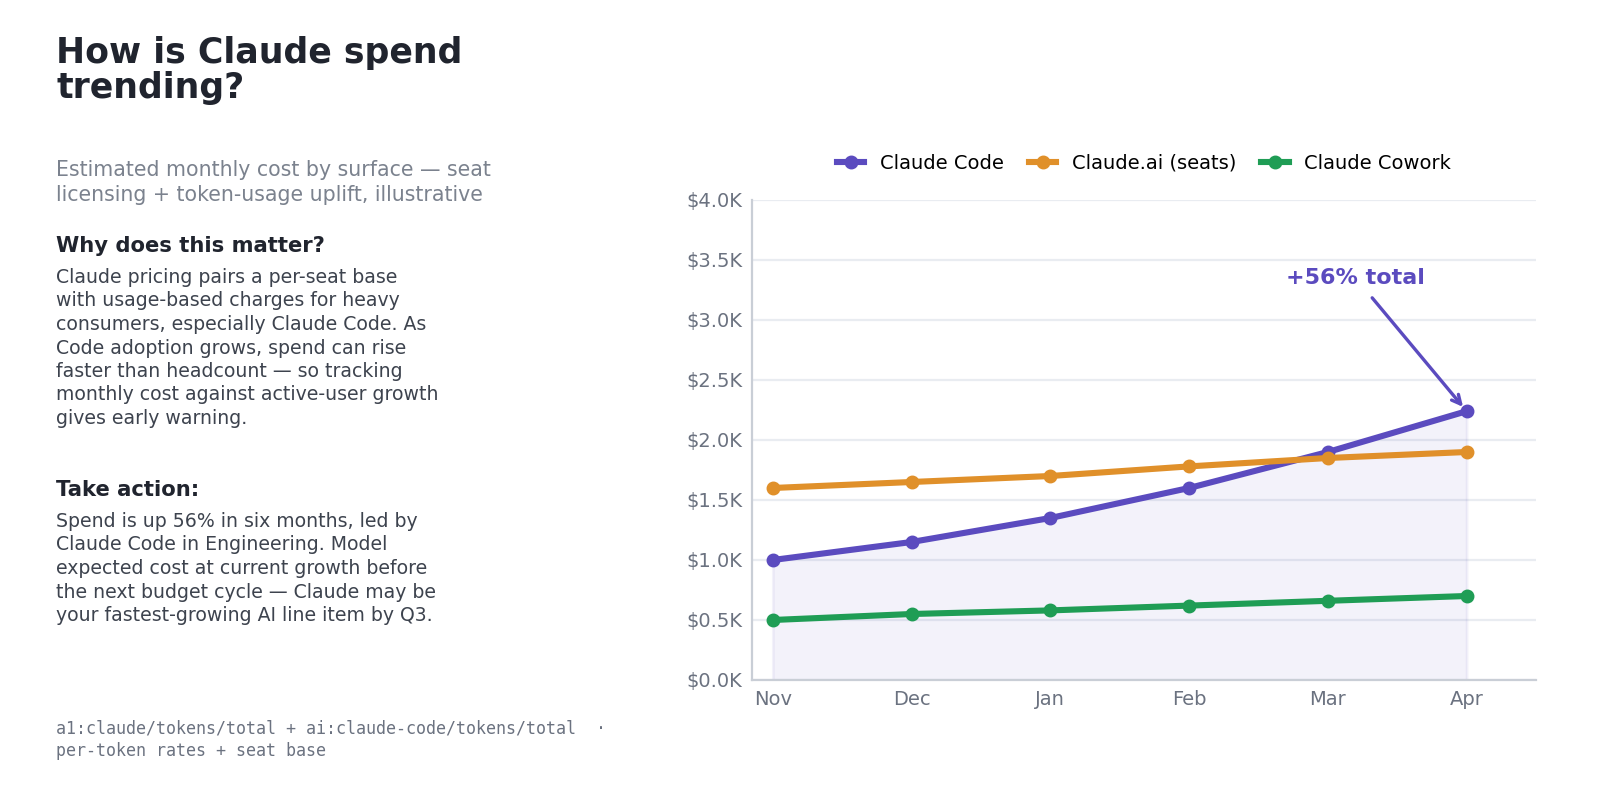
Worklytics reconciles the surfaces into a single figure per period, so Claude Code growth and seat-based chat are read on one line instead of being added up by hand each month.
If you run Claude Code through Amazon Bedrock, the Enterprise Analytics API returns none of it. The Claude Code Analytics API is narrower still: it covers Claude Code on the Claude API only, and excludes Bedrock, Microsoft Foundry, Google Cloud (Vertex), and Claude Platform on AWS. Any team on a cloud marketplace is understated until that usage is reconciled against cloud cost data.
Worklytics surfaces this shortfall in the same view, so the missing marketplace spend is visible and can be reconciled against your cloud cost data rather than silently dropping out of a per-team total.
The Enterprise Analytics API is a real improvement: it returns per-user daily metrics and per-user cost across chat, Claude Code, Cowork, and Office Agent. But it still returns a user identifier, not a department. And the identifier itself varies: each Claude Code record carries an actor that is either a user_actor with an email_address (OAuth) or an api_actor with only an api_key_name (API key), so a join keyed on email silently drops the api_actor rows, which are usually CI pipelines and service accounts. You are one join away from a usable answer, and that join is where reporting stalls.
One scheduling caveat: engagement data for a day is aggregated at 10:00 UTC the next day and becomes queryable three days later, while cost data arrives within hours but stays revisable for 30 days. Join them naively and a dashboard shows populated cost against an empty active-user count for several days, which is expected behavior, not a broken pipeline.
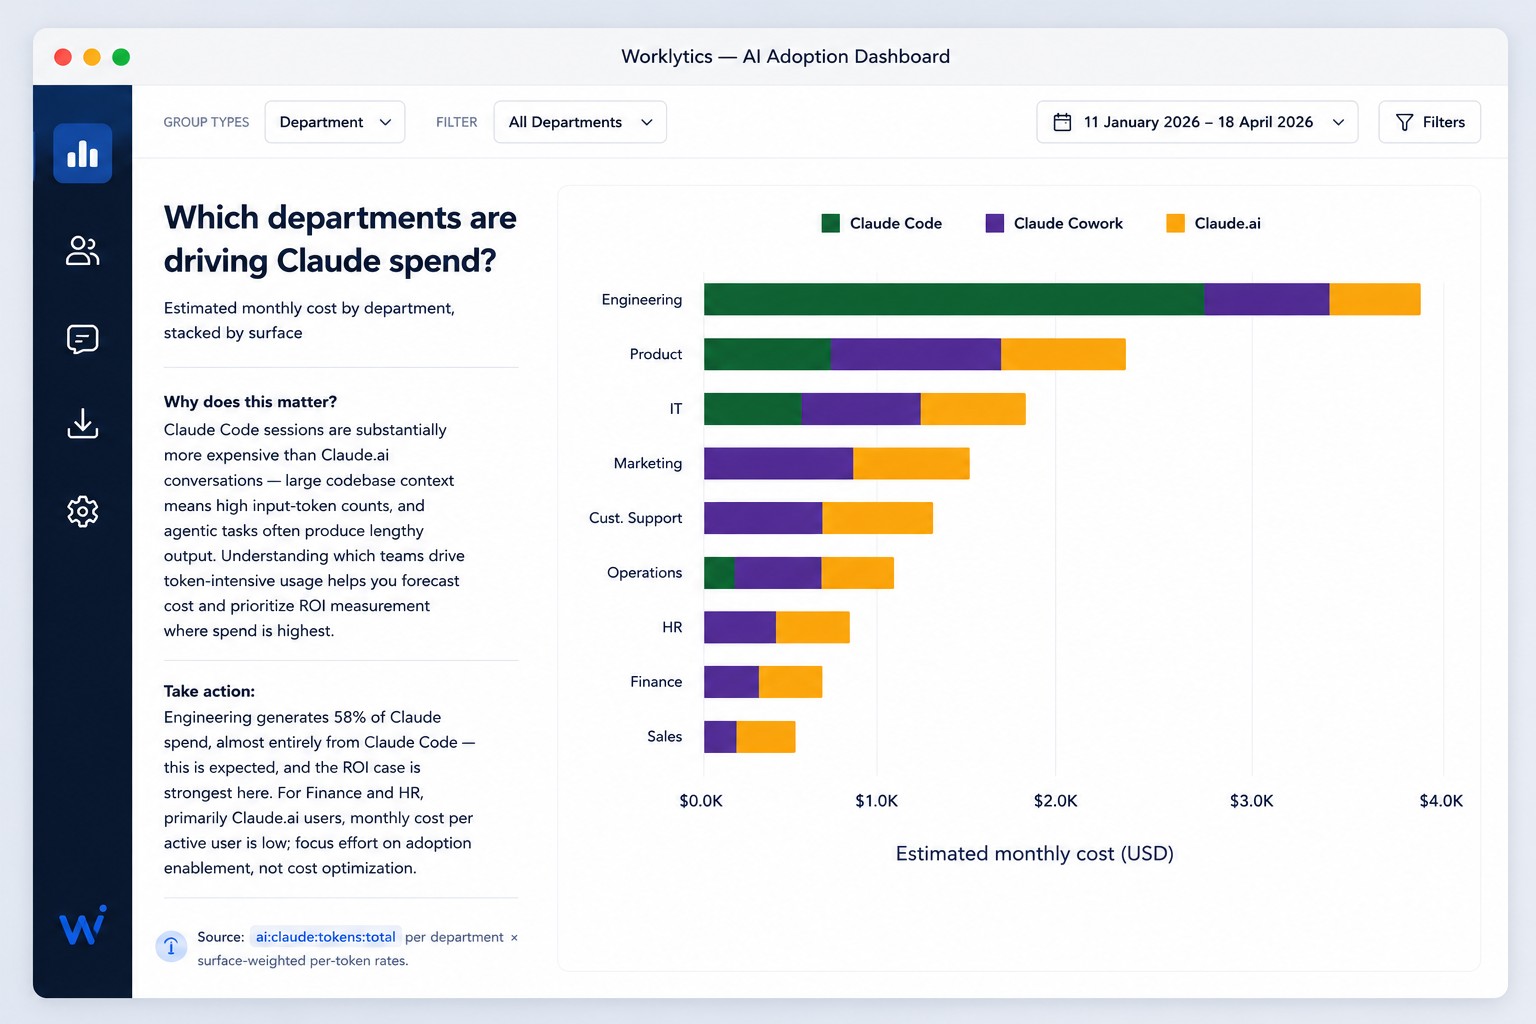
The export is the input. Worklytics turns it into the per-team, per-model view Anthropic's endpoints structurally can't produce.
Worklytics ingests Claude usage and cost (both the Console and Enterprise paths) alongside HRIS attributes, so every exported row inherits department, function, role, manager, and tenure. Because it resolves organizational identity as of the date of the spend rather than the date of the query, a March reorganization doesn't rewrite who owned February's cost; the answer is the same every time it is rebuilt.
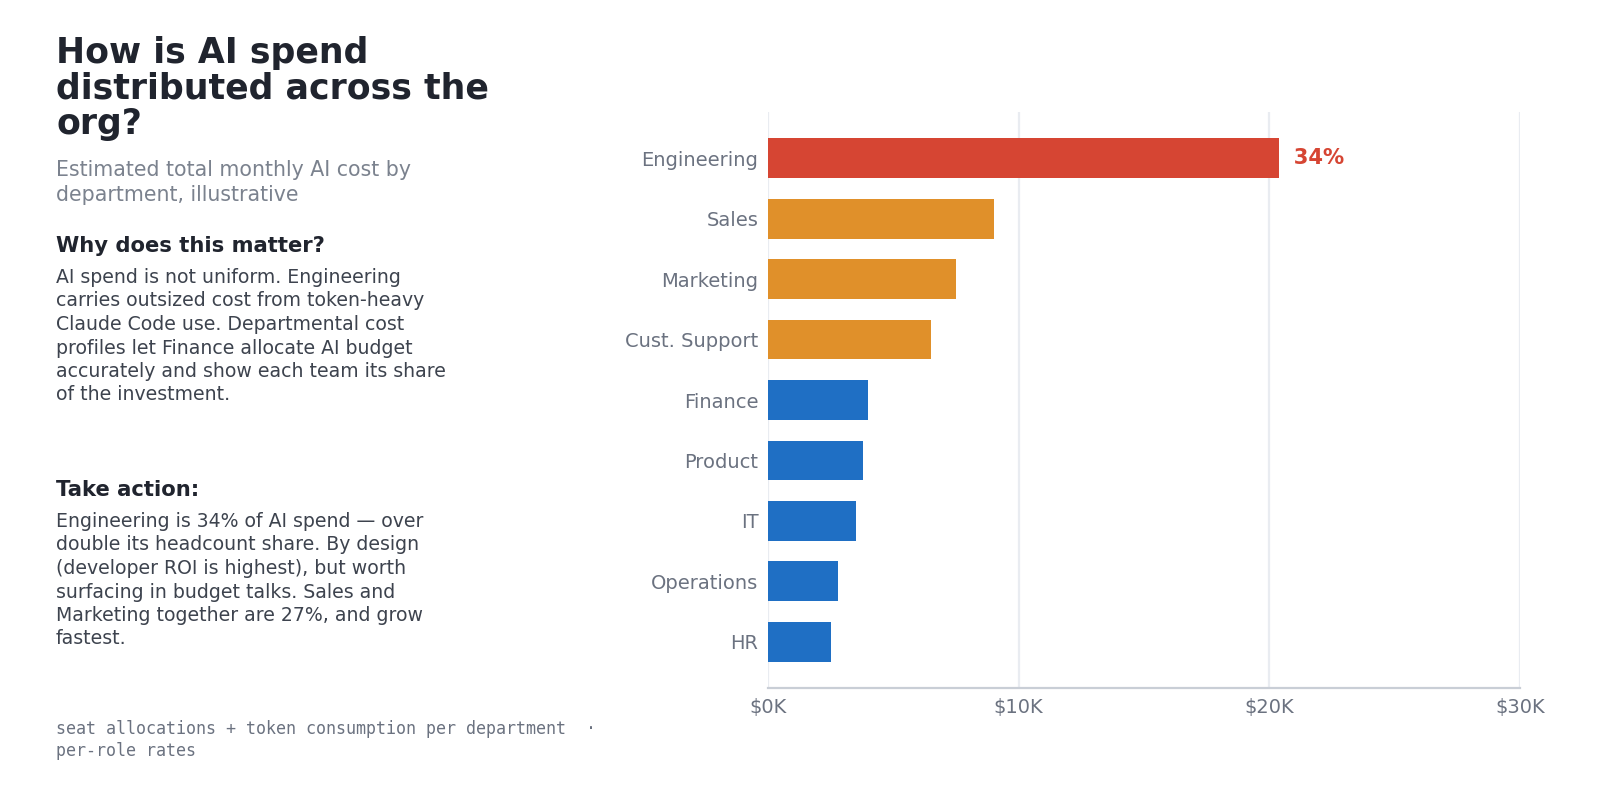
Anthropic's export already carries a model dimension; what it lacks is the team dimension. Once Worklytics adds that, the two read together: you can see spend per team and per model at once (Engineering's Opus versus Sonnet, say), and split each team by surface across Claude Code, chat, and Cowork. That cross-tab is exactly what a raw export can't produce, because it has no idea what a team is.
Worklytics DataStream exports the joined dataset to your own warehouse or BI environment, where finance reconciles Claude spend against the general ledger using the same cost-center codes it uses for every other vendor. Pairing spend with adoption (weekly active users and seat utilization) turns the number into a decision: three measures per function (total spend, spend per weekly active user, and share of licensed seats with any weekly activity) separate intensive use from paid-for-but-idle capacity, which is the difference between a renewal you grow, one you reallocate, and one you renegotiate.
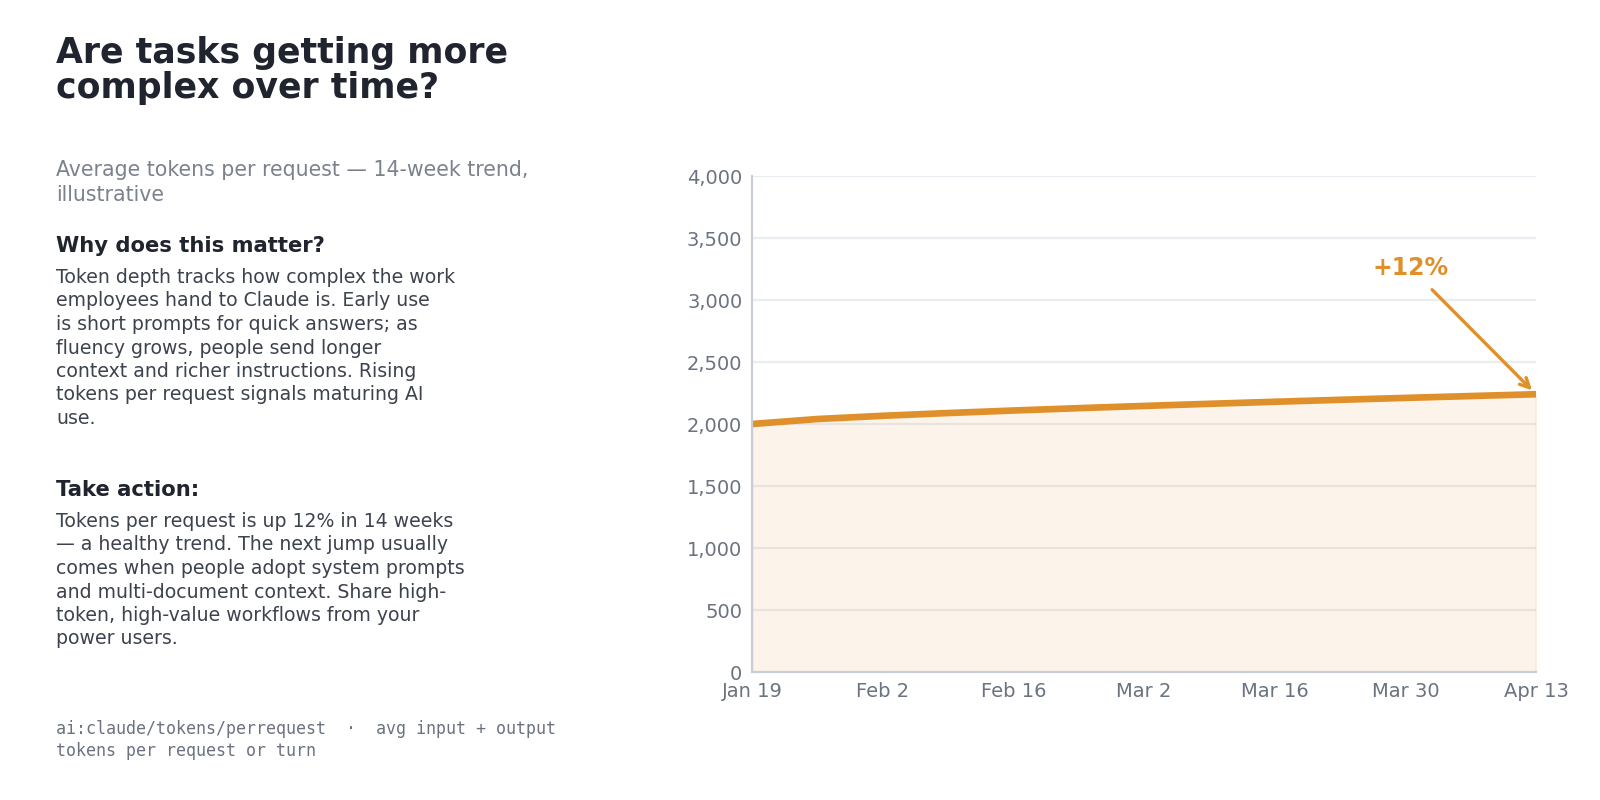
Worklytics view: average tokens per request rising as the complexity of delegated work growsThe same pipeline already handles Claude Code usage tracking and Claude Enterprise usage tracking, which matters because most organizations run both surfaces at once and need them reconciled into one number per team. See how Worklytics measures AI for the full model.
No. The cost endpoints group by workspace, API key, model, and service tier, and the Enterprise Analytics API groups by individual user. None of these carries department, function, or role. Department-level attribution requires joining the workspace ID or user email to an HRIS source, the step Worklytics automates.
Yes. Both the usage report (group_by[]=model) and the Claude Code Analytics API (per-model cost breakdown) expose a model dimension, so a per-model export is straightforward. What Anthropic can't give you is per-model and per-team together; that needs the organizational join.
They serve different products with non-interchangeable keys. The Usage and Cost Admin API covers Claude Console and Platform organizations with an Admin key and reports usage and cost by workspace. The Claude Enterprise Analytics API covers Claude Enterprise organizations on claude.ai with an Analytics key created by the primary owner, and reports per-user engagement and cost across chat, Claude Code, Cowork, and Office Agent.
Claude Enterprise Analytics data is available for dates on or after January 1, 2026. Cost values remain revisable for up to 30 days after the usage date, so exports older than 30 days are the most stable.
No. The Enterprise Analytics API doesn't return Claude Code activity running through Amazon Bedrock, and the Claude Code Analytics API covers Claude Code on the Claude API only, excluding Bedrock, Microsoft Foundry, Google Cloud, and Claude Platform on AWS. Those deployments need cloud cost data to be reconciled into a complete per-team view.
Three expected mechanisms: Enterprise cost values stay revisable for 30 days; omitting ending_at includes an incomplete tail past data_refreshed_at; and Priority Tier and code-execution costs sit in different endpoints. Fix it by stating an as-of date, setting ending_at at or before a returned data_refreshed_at, and documenting which cost categories the report includes.



