

Claude Enterprise admins field the same three questions every quarter: who is actually using Claude, how deeply they are using it, and whether it is changing how work gets done. Anthropic’s built-in export surfaces answer the first two with per-user precision. The third requires analysis the raw data cannot deliver on its own. This guide walks through both export paths, the CSV report and the Analytics API, explains exactly what each dataset contains and where its blind spots sit, then shows how to turn the export into adoption, proficiency, and impact measurement.
Anthropic splits Claude Enterprise reporting across three separate surfaces, and choosing the wrong one is the most common reason teams end up with the wrong granularity for their question. The Analytics dashboard inside claude.ai covers engagement and usage, and it is the only place to run a one-click CSV export. The Claude Enterprise Analytics API returns the same categories of data programmatically, as per-user daily records suited to data warehouses and BI tools. The Compliance API is a governance surface: it exposes audit log events, the user directory, and, for claude.ai organizations, chat and file contents for data loss prevention and legal review. It exists for security teams rather than analysts and requires a separate Compliance Access Key created by the Primary Owner.
One distinction matters before you request access. An Analytics API key created in claude.ai is not the same as an Admin API key created in Claude Console, and Anthropic’s Analytics APIs documentation states the two key types are not interchangeable. If someone hands you an Admin key and every analytics endpoint returns an authentication error, the key type is the reason, not your code.
The CSV is the fastest path to per-user visibility and requires no engineering time. Anthropic’s usage analytics guide for Team and Enterprise plans documents the workflow:
Custom date ranges reach back a maximum of 90 days, and the most recent data available is from yesterday, because usage data refreshes daily with a one-day delay. Each row in the file represents one person’s usage of one model, with request and token totals summed across the selected range.
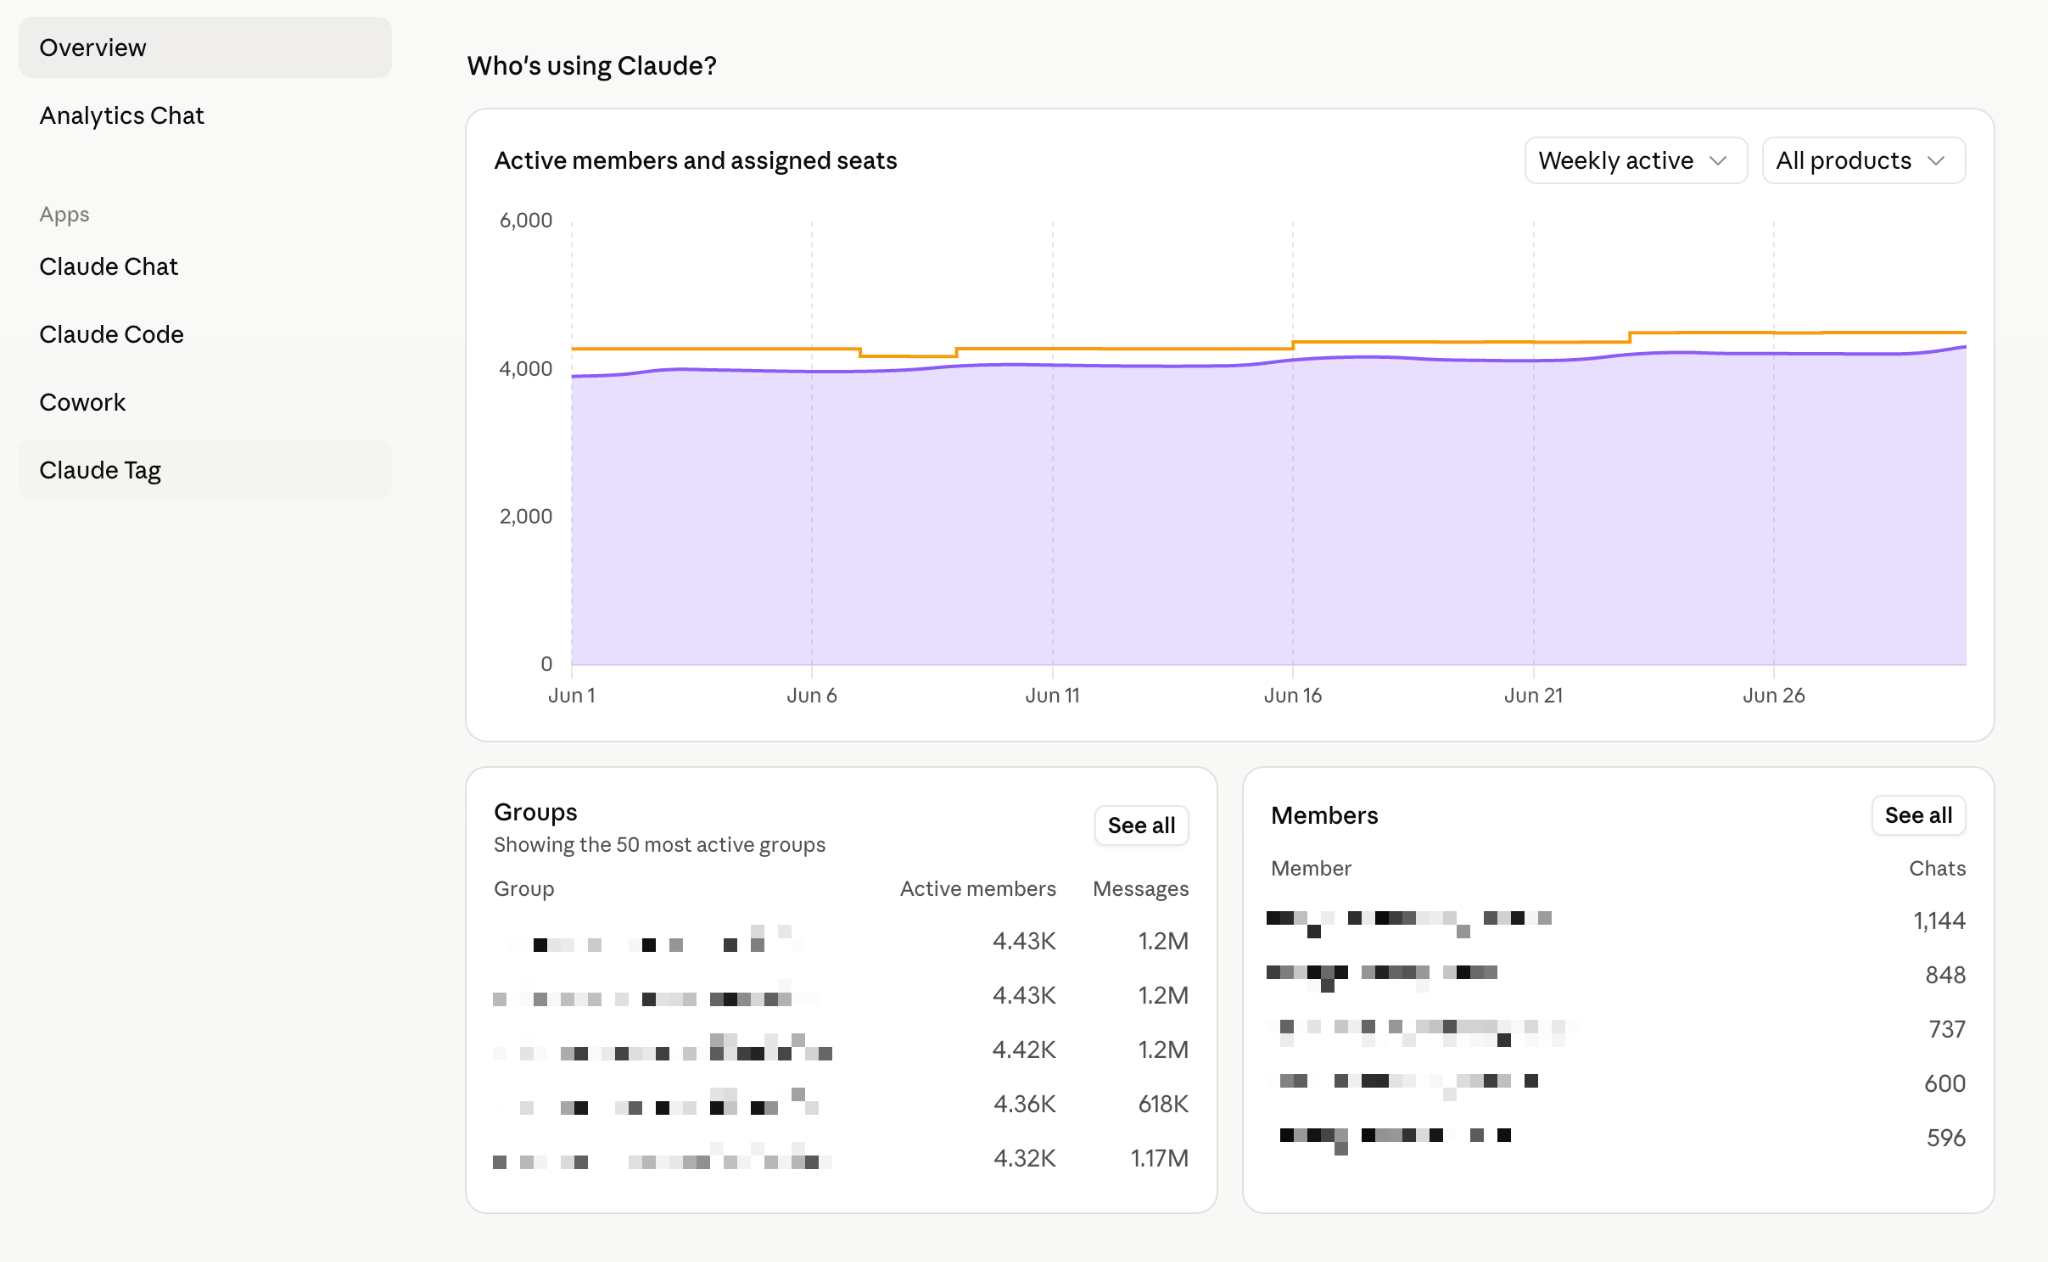
A product column separates Chat, Claude Code, Cowork, Claude in Chrome, and Office Agents, which aggregates the Claude add-ins for Excel, PowerPoint, and Word. Alongside those dimensions you get request counts and input and output token totals per user per model.
Two plan-specific caveats prevent misreadings. On usage-based Enterprise plans, the export captures the organization’s full usage. On seat-based plans, the export option only appears when usage credits are enabled, and the file reflects only the overage activity beyond seat allotments rather than the usage inside them. If your CSV totals look implausibly low relative to how active your teams are, that scope difference is the explanation, not an export defect.
When the analysis needs to live in a warehouse, refresh on a schedule, or join against HR data, the Claude Enterprise Analytics API replaces the manual export. Access is deliberately restricted: only the Primary Owner can enable public API access under Organization settings > API in claude.ai and create an Analytics API key. Keys carry the read:analytics scope, the secret is displayed exactly once, and every request passes it in the x-api-key header against endpoints under api.anthropic.com/v1/organizations/analytics/. A minimal test looks like this:
curl "https://api.anthropic.com/v1/organizations/analytics/users?date=2026-07-10&limit=50" --header "x-api-key: $ANALYTICS_API_KEY"
The dataset is broader than the CSV. Per-user daily records cover chat activity (conversations, messages, projects, files, and artifacts), Claude Code activity (sessions, commits, pull requests, and lines of code), and Cowork actions, alongside organization-level engagement metrics such as daily, weekly, and monthly active users and seat utilization. Field-level schemas live in Anthropic’s Analytics API reference guide.
Freshness constraints shape how you schedule pulls. Engagement data lands with a three-day delay. Usage data refreshes roughly every four hours, can take up to 24 hours to appear, and values may be revised for up to 30 days as late events reconcile, so Anthropic recommends querying dates at least 30 days in the past when accuracy matters most. Historical data is available from January 1, 2026 onward with a 90-day query window. One coverage gap is explicit in the documentation: if your organization runs Claude Code through Amazon Bedrock, that activity does not appear in the Analytics API at all, so engineering-heavy organizations on Bedrock need a supplementary telemetry path.
Raw rows do not answer executive questions; a measurement framework does. Worklytics structures AI adoption measurement in three stages, and the Claude export maps cleanly onto the first two.

The Worklytics three-stage model for measuring AI impact: adoption, proficiency, and leverage.
Adoption asks what share of the team uses AI daily, weekly, or monthly. From the CSV, count distinct users with at least one request in the window and divide by licensed seats. This immediately produces the list every admin needs before renewal: seats with zero requests in 90 days. Proficiency asks how deeply active users work with the tool. Requests per active day, token consumption per user, and product mix carry the signal here, because a user logging 40 short Chat requests represents a different maturity level than one whose Claude Code sessions produce commits and pull requests. Leverage asks whether the organization is getting more done with AI than without it, and this is where the export stops. Anthropic reports what happened inside Claude and nothing about output. Answering the leverage question requires joining usage records to calendar, collaboration, and delivery signals, which is the analysis layer Worklytics automates through its productivity measurement capabilities.
Exported numbers only become meaningful against a reference point, so here are first-hand observations from Worklytics deployment data that you will not find in Anthropic’s documentation. In a representative enterprise deployment of roughly 1,700 employees, Claude reached 255 weekly active users, or 15 percent of the workforce, averaging 2.1 active days per week and 4.2 uses per active day, with weekly active use growing 22 percent over a 14-week period. That combination, high intensity on active days paired with below-average frequency across the week, is the signature of a specialist tool: Claude concentrated in engineering and product workflows while horizontal assistants such as Google Workspace AI (40 percent of the workforce weekly) and ChatGPT (28 percent) served as everyday defaults.

Worklytics tool portfolio: Claude registers 255 weekly active users at 15% of the workforce, 2.1 active days per week, and 4.2 uses per active day — the profile of a specialist tool.
Two further observations determine how much weight a Claude-only export deserves. Across the same deployment, active AI users touched a median of 1.8 distinct AI tools per week, and 54 percent used only one. A Claude Enterprise export therefore describes a minority slice of most employees’ AI activity, and adoption conclusions drawn from it alone will undercount the true AI footprint of any team that also holds Copilot, Gemini, or ChatGPT seats. In Worklytics benchmark data across peer organizations, monthly AI adoption ranges from 4.1 percent of employees at the 10th percentile to 67 percent at the 90th, with a median of 31 percent, which gives your exported adoption rate an external yardstick rather than an internal guess.

Worklytics Benchmark: AI adoption, weekly usage, and agent utilization plotted against peer-organization percentiles.
Organizations that want this comparison as a standing report rather than a one-off exercise can run it through Worklytics Benchmark, which positions each metric from the export against peer percentiles.
The native exports are accurate for what they cover, and their limits are structural rather than fixable with better queries. The scorecard below shows why the biggest limit bites first: in a typical org, most employees split their AI work across several tools, so a single-vendor export sees only part of the picture.

Worklytics adoption scorecard: active AI users touch a median of 1.8 tools per week and 54% use only one, which is why a single-vendor Claude export undercounts the real AI footprint.
Worklytics ingests Claude Enterprise usage data alongside Copilot, Gemini, ChatGPT Enterprise, and coding assistants, resolves every user against your organizational hierarchy, and handles the joins the raw export leaves to you. Three capabilities map directly onto the gaps above.
Adoption tracking by team and role. The AI adoption dashboard aggregates active use across every connected AI tool and surfaces adoption gaps at the department level rather than as a flat list of email addresses, so enablement budgets target the specific functions where uptake has stalled instead of spreading evenly across the company.

Worklytics sample report: Sales, HR, and Marketing show the lowest AI penetration, surfacing adoption gaps by department across connected tools.
Work classification. Worklytics automatically classifies AI activity into work categories such as coding, research, analysis, summarization, drafting, and email creation. This converts the export’s token counts into the language leadership actually uses: which workflows AI is accelerating, and where usage remains shallow.

Worklytics insight view: AI usage classified into work categories, showing what each tool is actually used for.
Impact measurement. Pairing classified usage with delivery, collaboration, and calendar signals shows which tools are moving real work forward, which is the evidence a renewal conversation about Claude seats actually needs. Worklytics pairs this with the AI ROI calculator for teams that want to model expected returns before expanding licenses.

Worklytics impact view: monthly cost versus estimated value generated per tool, including Claude.
All of this runs on usage metadata only. Worklytics never reads prompt or completion content, which keeps the program positioned as measurement rather than surveillance and aligns with how Claude’s own analytics dashboard treats conversations. Engineering leaders who need depth on the coding side specifically can follow the Worklytics guide to tracking Claude Code usage, and admins comparing the dashboard and Compliance API in more detail should read the full guide to tracking Claude Enterprise usage.
Owners and Primary Owners can run the CSV usage report from the Analytics dashboard. Creating an Analytics API key is more restricted: only the Primary Owner of the Enterprise organization can enable API access and mint keys, which carry the read:analytics scope.
The dashboard CSV reaches back a maximum of 90 days, with the most recent data from yesterday. The Analytics API holds history from January 1, 2026 onward, also queried in windows of up to 90 days. Longer retention requires warehousing the data yourself or routing it through a platform like Worklytics that stores the trend line for you.
No. Both the CSV and the Analytics API return usage metadata: users, models, products, request counts, and tokens. Access to chat contents, uploaded files, and audit events sits with the separate Compliance API, gated behind a Compliance Access Key that only the Primary Owner can create.
Two structural reasons explain most gaps. On seat-based plans with usage credits enabled, the export reflects only the overage activity beyond seat allotments, not the usage inside them. And usage data refreshes daily with a one-day delay, so today is never included, while Analytics API values can be revised for up to 30 days as late events reconcile, which makes recent dates provisional.
Yes. The Analytics dashboard includes a dedicated Claude Code view, the CSV separates Claude Code as a product line, and the Analytics API returns Claude Code sessions, commits, pull requests, and lines of code per user per day. The one exception is Claude Code routed through Amazon Bedrock, which the Analytics API does not report.
Exporting Claude Enterprise data answers who used Claude and how. Deciding whether the investment is working requires seeing Claude next to every other AI tool your teams run, classified by the work it supports, benchmarked against peers, and connected to productivity outcomes. Book a Worklytics demo to see your Claude data in that context, or request a sample AI adoption report to preview the analysis before connecting anything.



