
Google Workspace lets admins export Gemini usage data three ways: a CSV from the audit and investigation page, the Admin SDK Reporting API, and a direct export of Gemini audit logs to BigQuery. Those exports show who opened Gemini and how often, not whether it changed how work gets done. To measure AI sales team effectiveness, connect Gemini activity to four things: adoption, depth of use, time saved, and business impact. Worklytics reads the same Workspace data and adds that layer, using one model: Adoption (who uses it), Proficiency (how much work it touches), and Leverage (what you get back).
Gemini now sits inside Gmail, Docs, Sheets, Meet, and Chat for most Google Workspace customers. For a sales organization, that means reps can draft prospect emails, summarize discovery calls, and update notes without leaving the tools they already use. The question every revenue operations and enablement leader asks next is simple: is any of this actually helping us sell more?
Google gives you the raw material to answer that. Since August 2025 you can export Gemini audit logs to BigQuery, on top of the CSV and API access that came before it. But an export is a pile of events, not an answer. This guide shows how to pull Gemini usage data out of Google Workspace, then how to turn those events into a clear read on AI sales team effectiveness, so you can tell the difference between a team that bought licenses and a team that changed how it works.
Google writes a Gemini event every time a user interacts with Gemini inside a Workspace app. Each record carries the person, the app (Gmail, Docs, Meet, and so on), the type of action, and a timestamp. There are three ways to get that data out, and they suit different jobs.
All three are good at counting active users, seeing which apps get the most Gemini use, and spotting people who have never touched it. All three miss the same thing: any link between that activity and the work it produced. That gap is why this guide keeps going past the export step.
BigQuery is the export most teams grow into, because a CSV stops being workable once you have real volume. Before you start, you need three things: the Reports administrator privilege (a super admin has it), a Google Cloud project with billing enabled, and the gapps-reports service account added as an editor on that project. Then follow Google's official steps to set up service log exports to BigQuery:
The dataset is created the next day, Pacific time. Once it is running, activity data (which includes Gemini events) lands within about ten minutes of an event, while usage reports have a longer initial delay. Two retention numbers matter when you plan: Workspace holds 180 days of activity log history and 450 days of usage log history, and the default BigQuery table expiration is 60 days, which you can raise. For very large Gemini or Gemini Enterprise deployments, Google Cloud documents patterns to analyze and govern that data at scale in BigQuery.
Prefer to skip the pipeline work? Worklytics connects to the same Workspace logs and builds the dataset for you, which is the route most teams take when they want analysis instead of a data engineering project. Our walkthrough on tracking Gemini AI usage from Google Workspace audit logs covers that path in detail.
A Gemini export answers one question, did someone use Gemini, and then it stops. For a sales org that limit is expensive. Picture two 20-person sales teams with identical license counts and near-identical event totals. On paper they look the same. In practice, one team pastes a single email into Gemini once a week to trip its active flag, while the other runs call summaries, follow-ups, and CRM notes through it every day. The logs cannot separate them, because a raw event has no idea what the work was worth.
That is the core limit of any usage export: it counts actions, not results. To measure AI sales team effectiveness you have to answer three questions the export cannot. Who has genuinely adopted Gemini? How much of their real work does it touch? And what do they get back in time and outcomes? Worklytics groups those into one model it applies to every AI tool, from Gemini to Copilot to Claude: Adoption for uptake, Proficiency for impact on work, and Leverage for productivity gains. The rest of this guide walks each layer and shows the view that fills the gap.

Adoption is the first gap because a license count hides non-use. The number that matters is not seats purchased but the activation rate, the share of licensed people who have used Gemini at least once, followed by the active usage frequency, how many of them use it in a given week. You can force a Gemini export to produce these, but only after you dedupe users, define a rolling window, and rebuild it every reporting cycle.
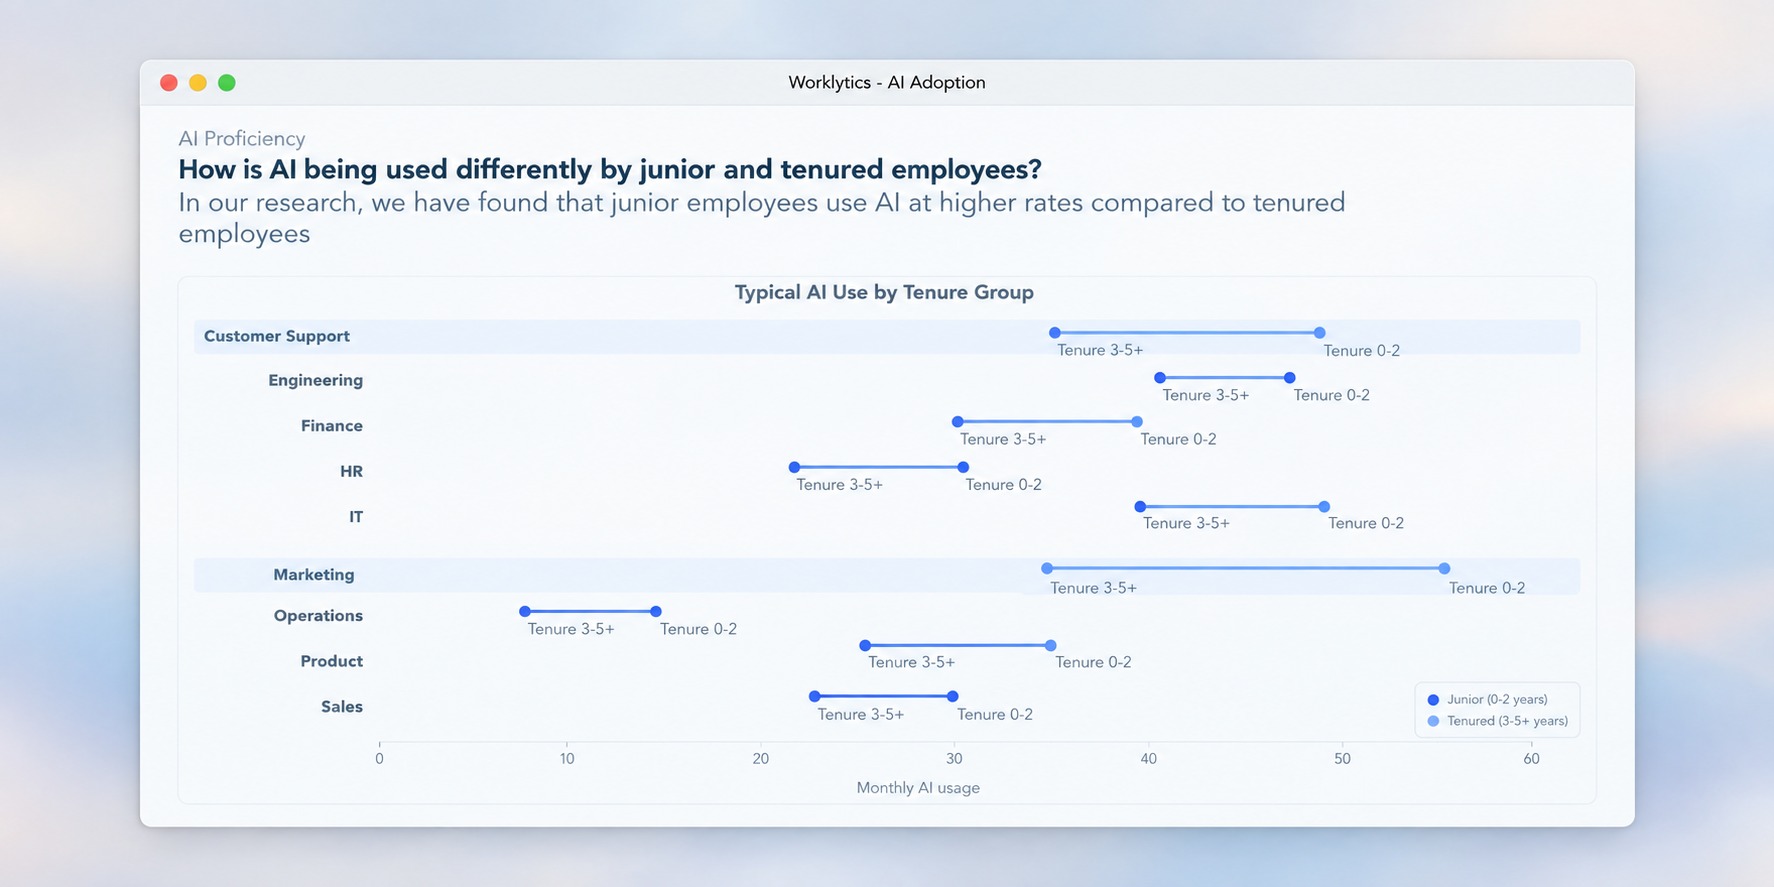
Worklytics calculates activation rate and weekly active use out of the box, then splits both by team, role, and manager. That split surfaces the pattern a flat CSV buries: which sales pods have real uptake and which contain adoption laggards, the managers or departments where usage has stalled. For a sales org, adoption also has a shape defined by tasks. The value is not that Gemini was opened, it is that Gemini touched the work reps lose hours to. Worklytics sorts AI use into categories such as email creation, drafting, research, analysis, and summarization, then shows where the biggest gaps sit. In the sample above, the tasks with the most headroom are the ones that eat a rep's day: email authoring, proposal writing, and CRM updates. That turns adoption from a headline number into a coaching list.
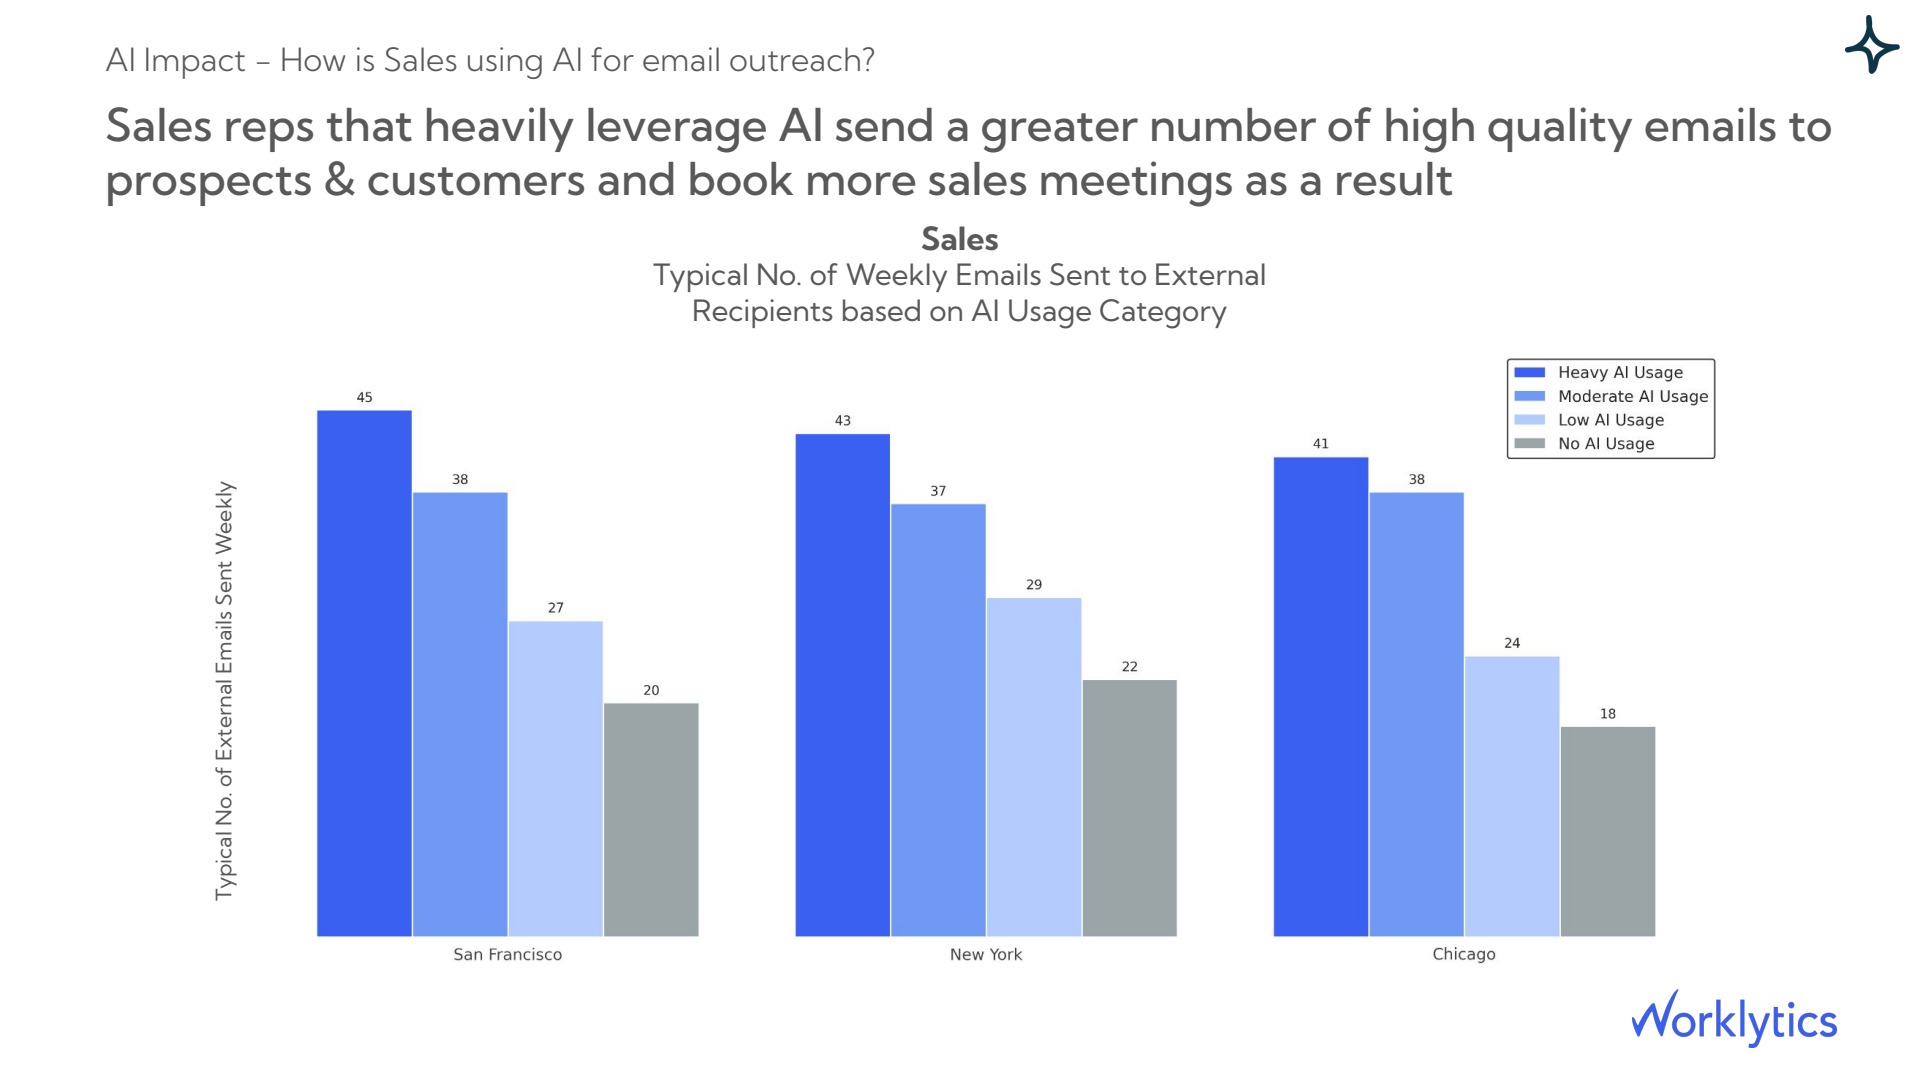
Adoption tells you someone started. Usage tells you whether it stuck. A rep who uses Gemini every day has built it into how they work; a rep who used it twice in March has not. A raw export can show a frequency count, but a count has no reference point, so you cannot tell whether six uses a week is strong or weak. Usage needs two things the log lacks: a per-person habit measure and a benchmark to read it against.
Worklytics supplies both. Its power user distribution shows how usage is spread, so you can see whether Gemini value is concentrated in a handful of reps or spread across the floor. Its Benchmark tool compares your numbers to peer organizations. Look at the AI use in Sales organization row in the sample above. That is exactly where a revenue team wants a reference point, because a sales org sitting near the 20th percentile on AI use is leaving speed on the table that competitors are already taking. Figures shown are illustrative sample data, not a published benchmark.
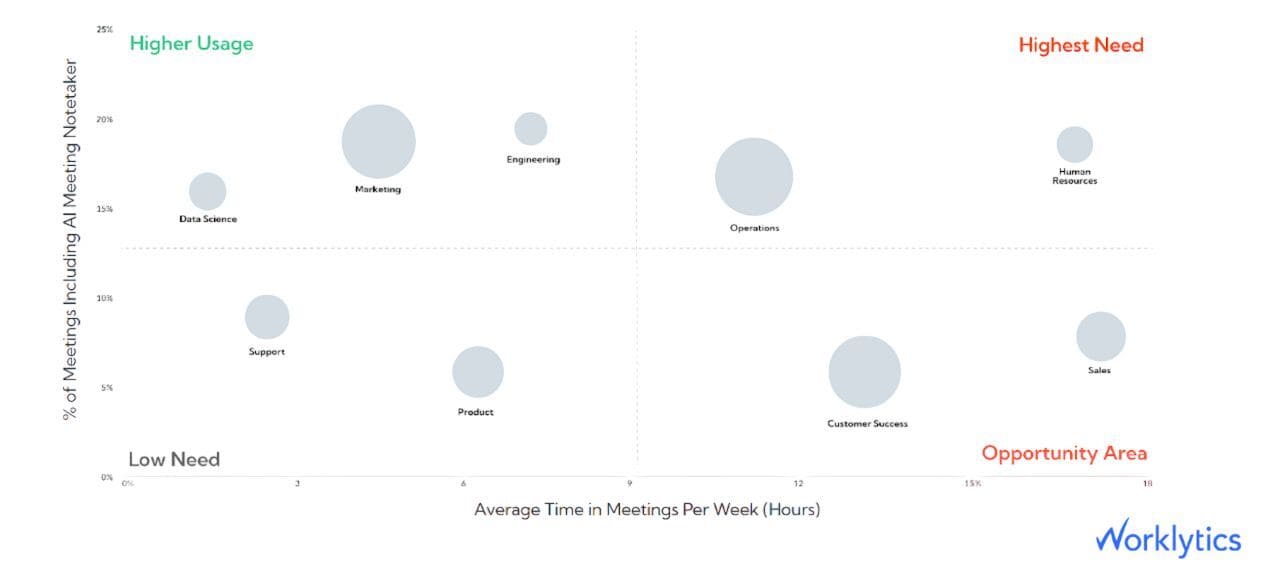
Usage also shows up in meetings, which for sales is where deals move. Worklytics measures the share of meetings that include an AI notetaker and crosses it with how much time each team spends in meetings. In the sample above, Sales sits in the Opportunity Area: a heavy meeting load paired with low AI notetaker use, the profile where adding automatic capture would free the most selling time. If you want to measure meeting effectiveness or manager effectiveness next to AI use, Worklytics reports on both in the same dashboard.
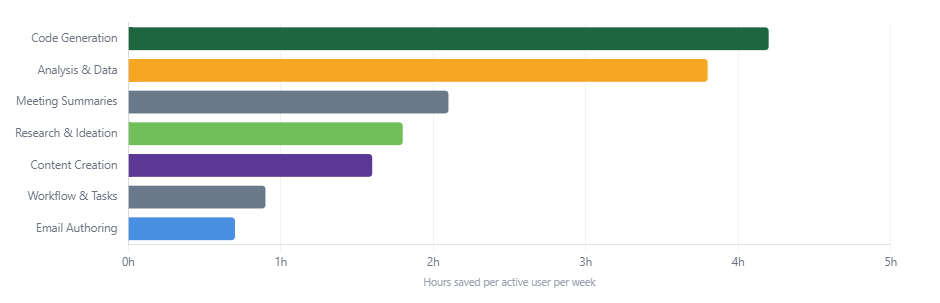
Adoption and usag describe behavior. Productivity asks the payoff question: when a rep uses Gemini, do they get time back, and where does it go? A usage export cannot answer this, because it never records how long a task took or what happened to the freed minutes. Worklytics estimates hours saved per active user per week by task category, which converts a vague sense that AI helps into a number you can plan around. In the sample above, analysis and content tasks return the most time. The read-across for sales is direct: reps who push research, analysis, and drafting through Gemini reclaim more hours than reps who only reach for it on the odd email.
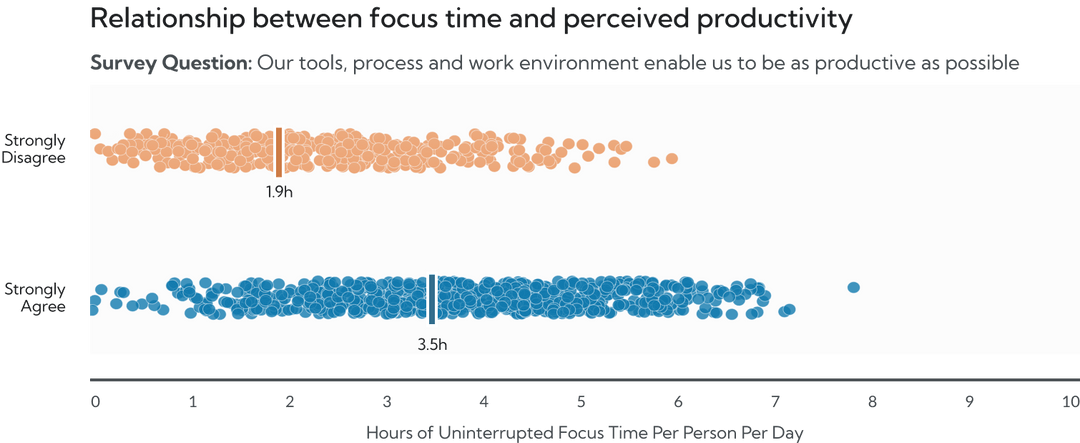
Time saved only counts if it lands somewhere useful, which is where productivity meets focus. Worklytics measures focus time, meaning uninterrupted blocks long enough to do real work, and links it to whether people feel able to perform. In the sample above, people who strongly agree that their environment lets them be productive carry about 3.5 hours of daily focus time, against 1.9 hours for those who strongly disagree. The point for a sales leader is specific: the goal is not just for Gemini to save minutes, it is for those minutes to become protected prep and selling time rather than leaking back into low-value busywork. Measuring employee productivity this way, with time saved on one side and focus and perceived productivity on the other, is what Worklytics is built for.
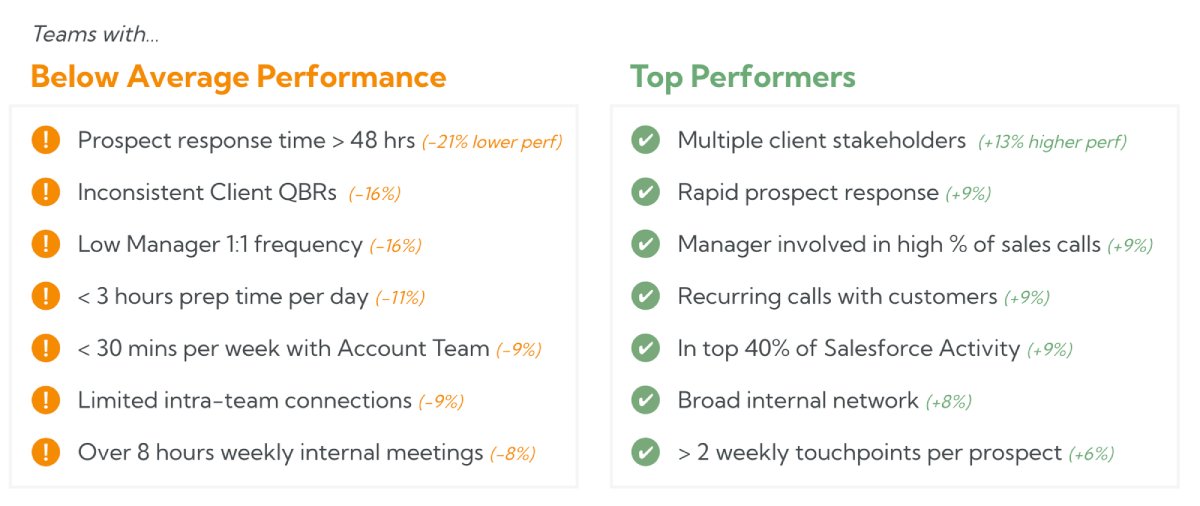
This is the layer executives care about and the one no export can reach on its own, because impact lives in outcomes, not events. No Gemini log contains a closed deal. The way to bridge the two is to connect AI behavior to the working patterns that separate strong sales teams from weak ones, then watch whether more AI use moves those patterns in the right direction.
Worklytics scores the behaviors that track with sales performance. In the sample above, top-performing teams share concrete habits: rapid prospect response, managers involved in a high share of sales calls, recurring customer calls, and more than two touchpoints per prospect each week. Below-average teams show the mirror image: prospect response slower than 48 hours, low manager one-to-one frequency, and more than eight hours a week lost to internal meetings. Now connect that to Gemini. If AI use moves a rep from a 48-hour follow-up to a same-day one by drafting it automatically, you have stopped measuring Gemini usage and started measuring a behavior the same report ties to higher performance. AI activity on one axis and performance-linked behavior on the other is what a real measure of AI sales team effectiveness looks like.
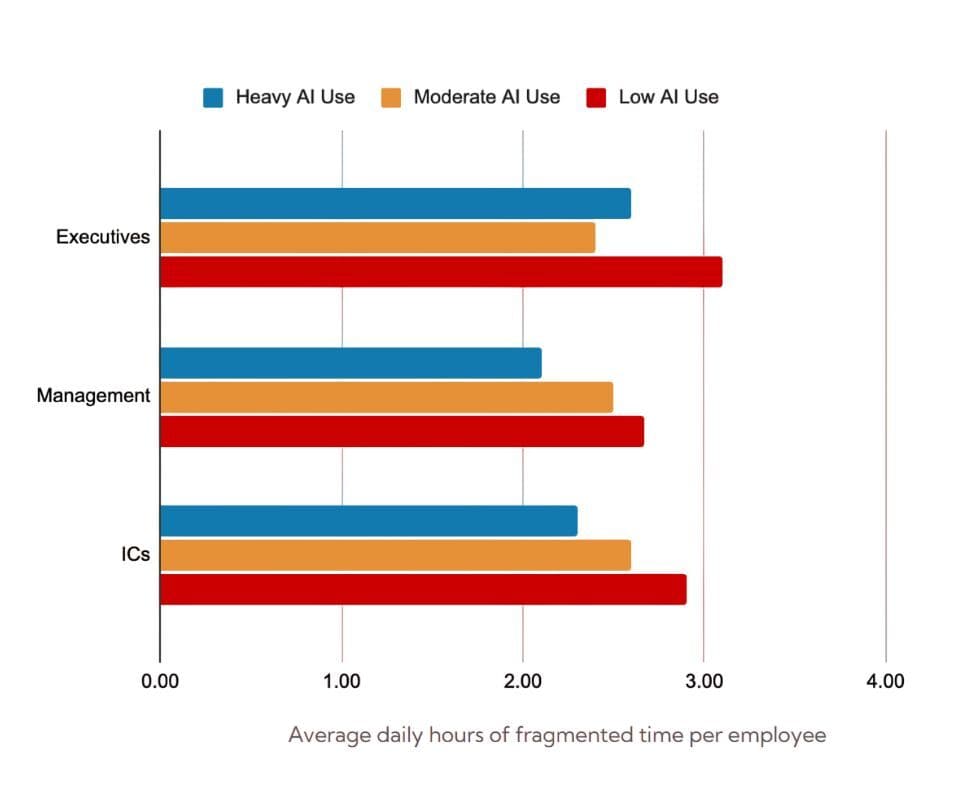
Impact also shows up in how broken up a rep's day is. Fragmented time, meaning a day chopped into small pieces by meetings and interruptions, is the enemy of both prep and follow-through. In the sample above, heavy AI users carry less fragmented time than low AI users across executives, managers, and individual contributors. That is the quiet mechanism behind a lot of AI impact: it clears the small tasks that would otherwise splinter the day. Track this across a quarter and you can see whether rising Gemini use is buying your reps cleaner, more sellable time, or whether the saved minutes are getting eaten somewhere else.

You do not need all of this on day one. A workable sequence:
Steps one and two you can do with Google's tools and some SQL. Steps three through five are where Worklytics Measure AI does the heavy lifting, because they need benchmarks, behavioral data, and outcome links a raw log will never hold. If your goal is to prove and improve AI sales team effectiveness rather than report Gemini logins, book a Worklytics demo or request a sample report, and connect Gemini next to your other AI tools to see adoption, usage, productivity, and impact in one place. For related reading, see how to measure employee performance in the age of AI and how to track whether employees are using Claude Enterprise.
Admins with the Reports administrator role can export Gemini activity three ways: download a CSV from the audit and investigation page, pull events through the Admin SDK Reporting API, or send Gemini audit logs to BigQuery under Menu > Reporting > Data integrations. The BigQuery route needs a Google Cloud project with billing enabled.
Yes. Gemini audit logs record the user, the Workspace app, the action, and a timestamp for each interaction, so admins can see who has used Gemini and how often. The logs do not show what the work produced or whether results improved, which is why teams add an analytics layer such as Worklytics.
Measure it in layers. Start with adoption, the share of reps actively using AI, add usage, how often and how deeply, then productivity, hours saved and focus time, and finally impact, whether AI use moves the behaviors tied to sales results such as prospect response time and customer touchpoints. Worklytics connects all four to your Gemini data.
The Workspace export itself is a configuration, not a paid add-on, but BigQuery storage and queries are billed by Google Cloud. BigQuery includes a monthly free tier of 10 GB of storage and 1 TB of queries, and the default table expiration is 60 days, so cost depends on how much history you keep and how often you query it.
Adoption measures uptake: how many people use Gemini and how often. Impact measures results: whether that use changes output, time, or business outcomes. A team can have high adoption and low impact if people open Gemini but it never touches their most valuable work.
It can, if you measure patterns instead of content. Worklytics reports on aggregated and anonymized activity, so leaders see team and role trends without reading anyone's individual prompts or messages. For sensitive analysis, keep reporting at the group level and avoid exposing single-person data.



