
/teams/daily-usage-data endpoint returns the most detailed rows: tabs shown and accepted, lines added and accepted, applies and accepts, and requests split by composer, chat, and agent, per user per day.Cursor tracks a lot about how your team actually works: tab acceptances, lines applied, requests by mode, spend by model. Getting that data out, and turning it into something an engineering leader can act on, are two separate problems. Below is where to get the data, how to export it through the dashboard and the two APIs, how to calculate the metrics people actually ask for, and where a single-tool export stops answering the question that matters.
Cursor exposes usage data through four channels, and each answers a different question. The web dashboard is built for a quick read: charts you can scan and export one at a time. The Admin API returns per-user-per-day rows plus billing and audit data as JSON you pull on a schedule. The Analytics API is newer and narrower: dedicated endpoints for specific metrics like tab completions, agent edits, and daily active users. OpenTelemetry export, in beta on Enterprise, streams metrics and logs to a collector you run, which matters if platform or security engineering already has an observability stack Cursor should report into.
ChannelFormatBest forLimitDashboardCSV per chartSpot checks, monthly reviews10 users, 90 daysAdmin APIJSON (POST)Warehousing raw rows, billing, audit30-day window per call, rate limitedAnalytics APIJSON (GET)Prebuilt metrics, acceptance, DAUEnterprise, 30-day window per callOpenTelemetryMetrics + logs streamExisting observability stacksEnterprise, beta
Pick the channel by what happens to the data next. A one-time export for a review is a dashboard job. Metrics you refresh often fit the Analytics API. Anything that needs to be joined with other systems of record, spend, HR data, delivery metrics, belongs in raw Admin API rows in your own warehouse.
The fastest export needs no code. Following Cursor's Usage Analytics documentation, a Team or Enterprise admin can pull a CSV in four steps
cursor.com/dashboard and go to Settings, then Team, then Usage.The dashboard reports AI share of committed code, agent edits, tab completions, messages sent, active users, a usage leaderboard, and repository insights at the team and per-user level. On Enterprise, Conversation Insights also classifies each agent session by the kind of work it did, such as bug fixing, new features, or refactoring, all scored on-device.
Two limits are easy to miss. Analytics data is collected only from users on client version 1.5 or higher, so a team running older Cursor builds sees usage undercounted with no error to flag it. And the 10-user filter means a company-wide CSV pull is a manual, repeated export once headcount passes single digits, not a single click.
The Admin API authenticates with basic auth, using a team admin's API key as the username, generated from Cursor Dashboard, API Keys. Most Admin API endpoints are an Enterprise-tier capability, so confirm which your plan unlocks before building against all of them.
Three endpoints cover most needs:
/teams/daily-usage-data (POST, 20 requests/minute). Takes startDate and endDate as epoch milliseconds, capped at a 30-day range per call. Returns, per user per day: totalTabsShown, totalTabsAccepted, totalLinesAdded, acceptedLinesAdded, totalApplies, totalAccepts, totalRejects, composerRequests, chatRequests, agentRequests, mostUsedModel, clientVersion, and isActive, alongside the user's email./teams/filtered-usage-events (POST, 60 requests/minute). Event-level detail: timestamp, model, request kind, token usage, and chargedCents, filterable by user, service account, or cloud agent. This is the layer that reconciles exactly against /teams/spend./teams/spend (POST). Per-user spendCents, fastPremiumRequests, and configured spend limits, useful for pairing usage volume with what it actually cost.curl https://api.cursor.com/teams/daily-usage-data \
-u YOUR_API_KEY: \
-H "Content-Type: application/json" \
-d '{"startDate": 1735689600000, "endDate": 1738368000000}'
Run the curl examples in this guide in a Unix-style shell: macOS Terminal, Linux, or on Windows either Git Bash or WSL. The \ line breaks and single-quoted JSON do not work as-is in Windows PowerShell or Command Prompt, and the plain curl name in PowerShell points at a different tool. In PowerShell, put the request on one line and call curl.exe:
curl.exe https://api.cursor.com/teams/daily-usage-data -u YOUR_API_KEY: -H "Content-Type: application/json" -d '{"startDate": 1735689600000, "endDate": 1738368000000}'
Keep the colon after YOUR_API_KEY, which sends the key as the username with an empty password, and swap in a real Enterprise admin key.
Because daily-usage-data caps at 30 days, a full quarter means three sequential calls, not one. Two details matter before you build the job: by default the endpoint returns only active users, so pass page and pageSize to page through every team member, and because Cursor aggregates this data hourly, polling more than once an hour adds nothing. Store the raw JSON in a warehouse table keyed by user and day, and then the 30-day cap only sets how often the job runs. A separate /teams/audit-logs endpoint (GET, 20 requests/minute, 30-day cap) returns IP address and event type per action for security review. The Cursor community forum is worth checking before you build the pipeline; several teams have documented the endpoint's edge cases, including gaps in lines-added reporting on certain client versions.
The Analytics API is the newer option built for metrics rather than raw rows. It uses GET requests to api.cursor.com/analytics/, an admin-scoped key with admin:* access, and is Enterprise-only. Team-level endpoints allow 100 requests per minute, by-user endpoints allow 50, and every call is capped at a 30-day range. Dates accept plain formats and shortcuts like 7d, today, or yesterday, and large teams page through results at up to 500 users per page.
Each metric has its own endpoint, so you pull exactly the number you need instead of computing it from raw rows:
EndpointWhat it returns/team/agent-editsSuggested and accepted diffs and lines from AI edits/team/tabsTab autocomplete shown and accepted/team/dauDaily active user counts/team/modelsModel usage breakdown/team/leaderboardUser ranking by AI usage/team/conversation-insightsAggregate conversation analysiscurl "https://api.cursor.com/analytics/team/agent-edits?startDate=30d&endDate=today" \
-u YOUR_API_KEY:
Every team endpoint has a /analytics/by-user/ twin that returns the same metric per person. The practical split: use the Analytics API when you want a clean acceptance or active-user number on a dashboard, and the Admin API when you want the raw per-user-per-day rows to join against spend, delivery, or HR data in your own warehouse.
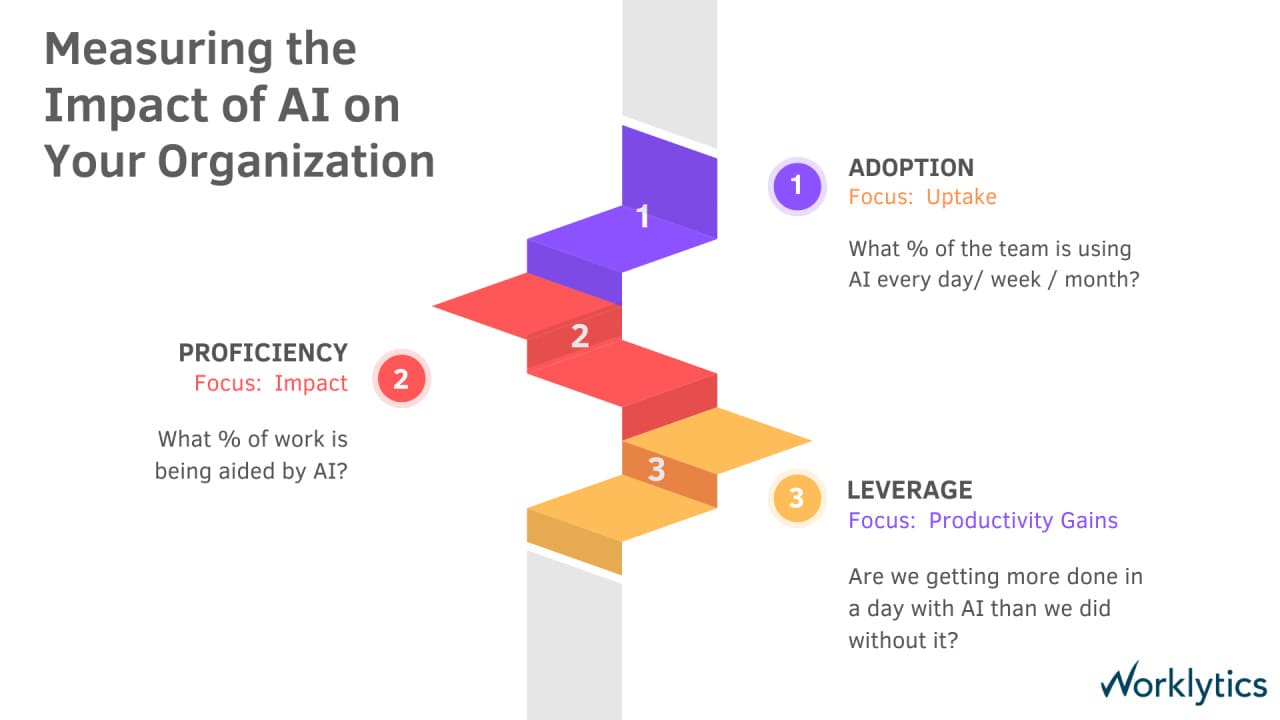
Exporting all of this is the easy part. The harder question is what to measure. It helps to sort the metrics into three stages: how many people use Cursor, how much of their work it touches, and whether they actually get more done. The rest of this guide follows that order.
Acceptance rate is totalTabsAccepted divided by totalTabsShown, or acceptedLinesAdded divided by totalLinesAdded if you measure at the line level instead of the suggestion level. Those two denominators do not agree, and that is the problem: a suggestion-level rate and a character-level rate describe the same usage but give different numbers. Cursor now also reports tab acceptance and agent-edit acceptance separately, so the Analytics API /team/agent-edits endpoint gives accepted diffs over suggested diffs, a third number again. The same behavior can come out as 30 percent or 65 percent depending on which of these you pick.
Pick one method, document it once, and never let a report mix them. A team whose accepted-lines rate climbs from 30 percent to 45 percent while its tabs-accepted rate stays flat is not improving, it is writing longer accepted suggestions, which is a different finding entirely. Vendor-reported acceptance figures tend to be higher because they are often computed differently than your own data will show, so check how any published rate was calculated before you compare against it.
An exported CSV or API response only ever describes Cursor. Most engineering orgs also run Copilot, Claude Code, or an internal agent framework, and none of those tools' native dashboards knows the others exist. Comparing Cursor spend to Cursor value on its own hides the real question, which is where the next license dollar does the most good.
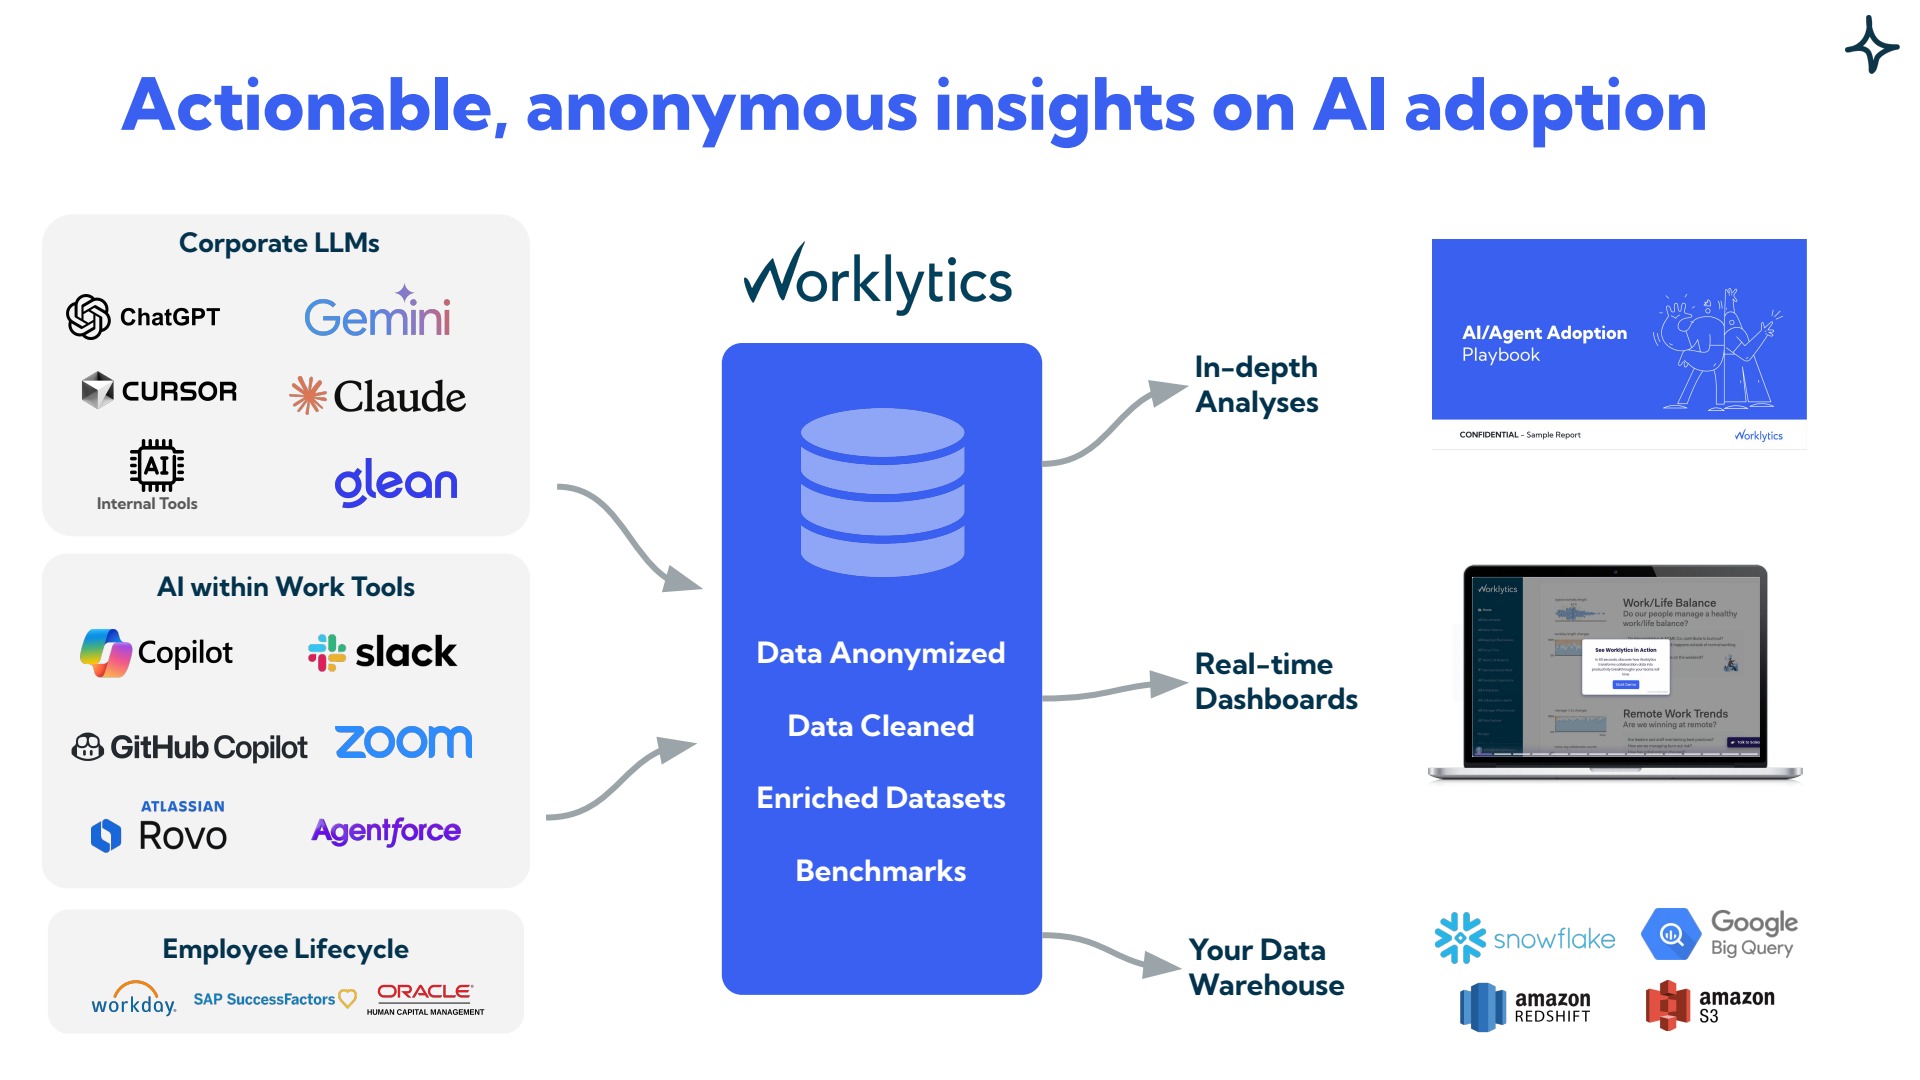
Worklytics reads AI usage across every assistant in one place, so Cursor appears alongside Copilot, Claude, ChatGPT, and Gemini rather than on its own. Its activation rate, the share of licensed engineers who have used a tool at least once, is measured the same way as every other tool, so a Cursor rollout that looks healthy on its own dashboard can still be the one falling behind once it is ranked against the other tools. A deeper walkthrough of what Cursor's own analytics can and cannot answer is in tracking how employees utilize Cursor AI.
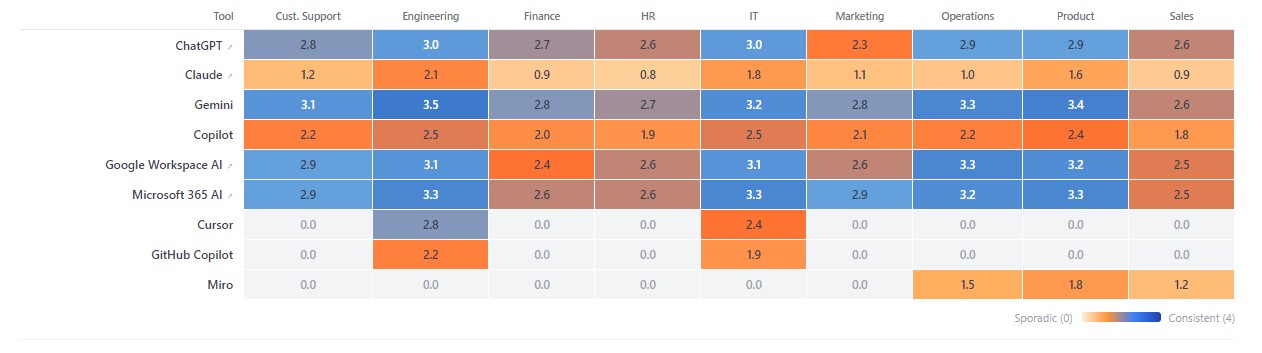
Illustrative sample report. Cursor adoption looks different once it is shown next to every other tool a team can use, rather than alone in its own export.
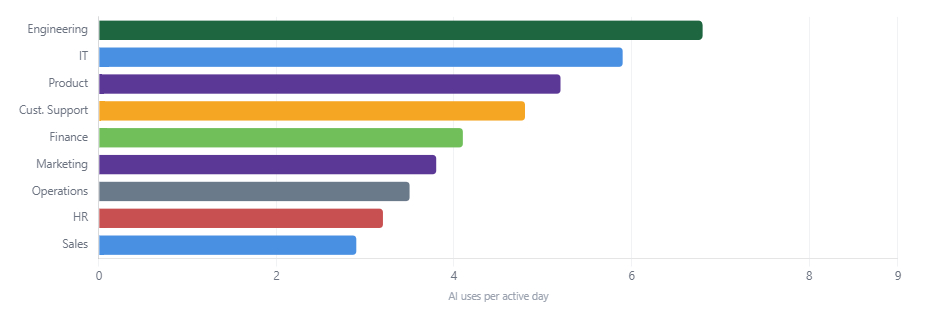
Activation tells you someone opened Cursor once. Engagement tells you whether people kept using it, and that is the number tied to renewal value. The Admin API's isActive flag and the Analytics API's /team/dau endpoint give you daily active counts, but a raw export will not tell you how that use breaks down: how many people are weekly-active versus one-time, which teams are power users versus occasional users, and which departments have stalled after an early rise.
Worklytics separates active usage frequency, power-user distribution, and adoption laggards as distinct measures, so a flat company-wide average splits into the teams keeping it high and the ones that stopped using it after week two. That distinction changes the action: a team with high activation but low weekly use has a habit problem, not an access problem, and the fix is training and support, not more seats.
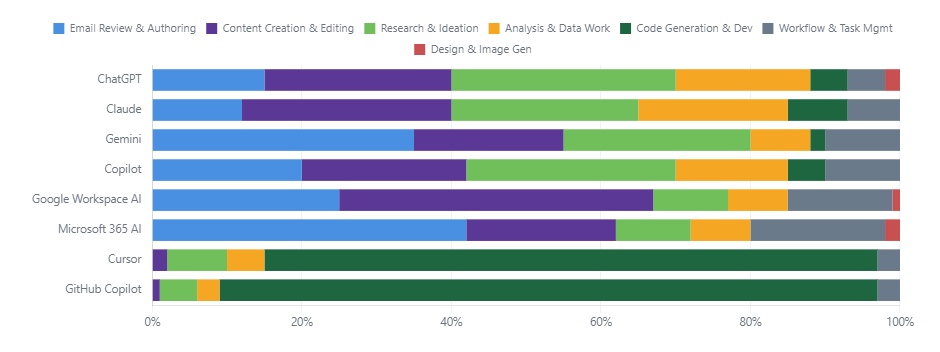
Volume metrics miss what matters most to an engineering leader: what the AI is actually used for. Cursor's Conversation Insights scores each agent session by work type, such as bug fixing, new features, refactoring, and testing, all on-device. That answers the question inside Cursor. It does not answer it for Copilot, Claude Code, or ChatGPT running alongside it. Worklytics classifies AI activity into the same kind of work categories across every tool, so a leader can see whether AI effort is concentrated on routine maintenance or on new product work company-wide, not one tool at a time.
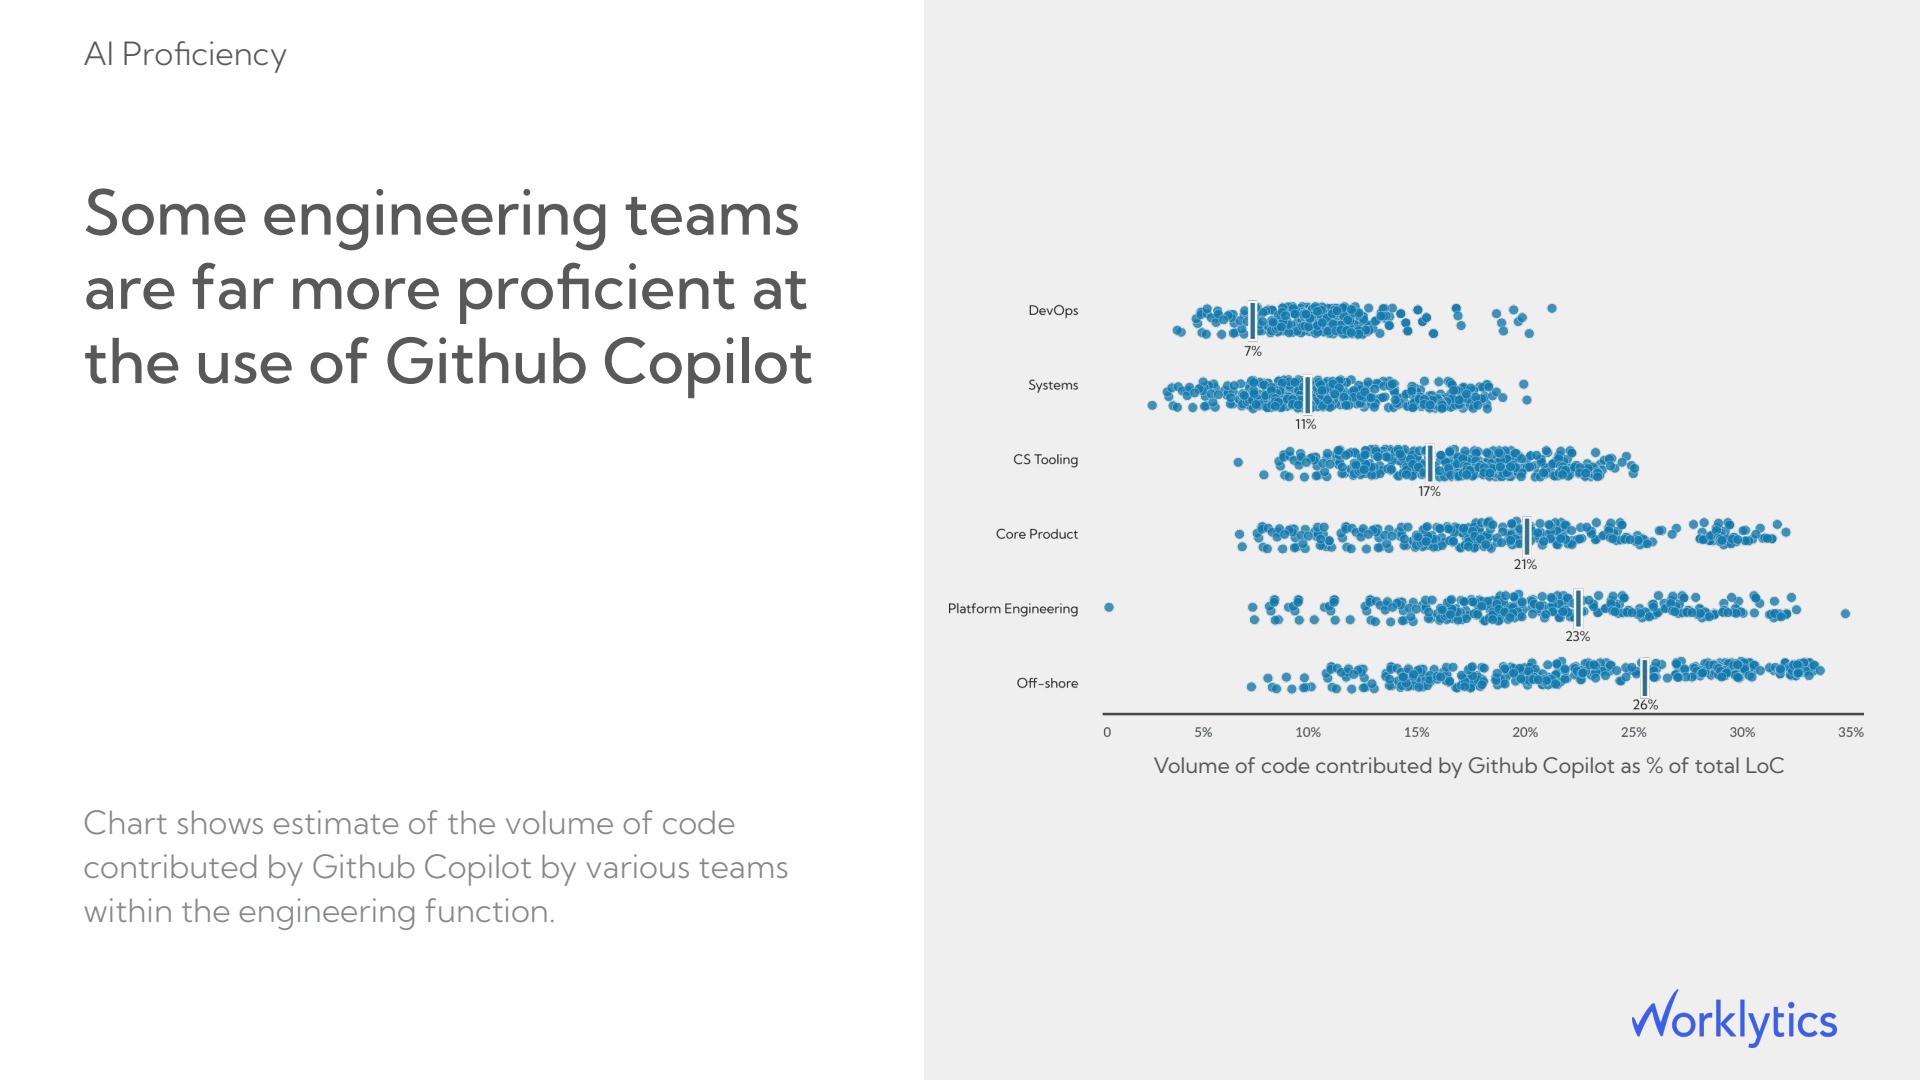
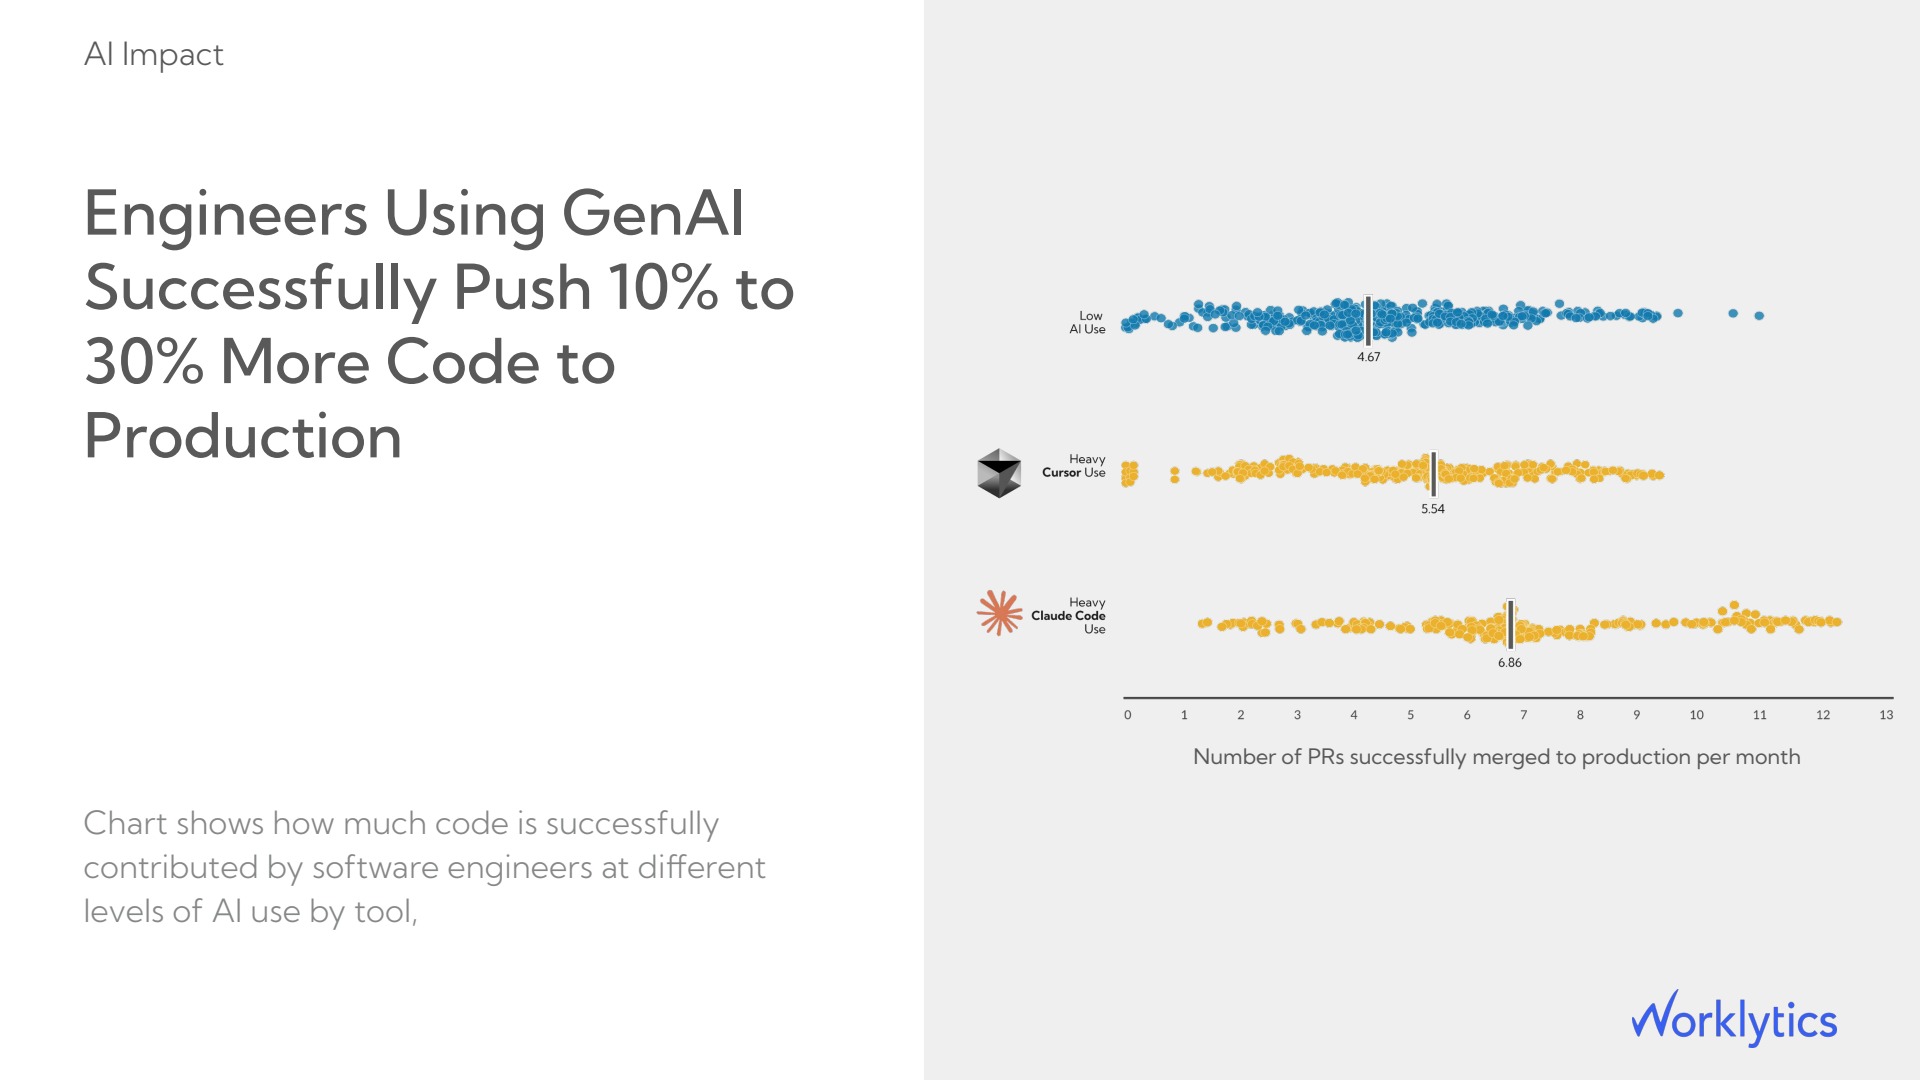
Adoption and output are not the same measurement, and an export that stops at tab-accepts never measures output. Worklytics has observed engineers with heavy AI use merging 6.86 pull requests a month against 4.67 for light users, a 47 percent lift, and that number looks good until you check it against rework.
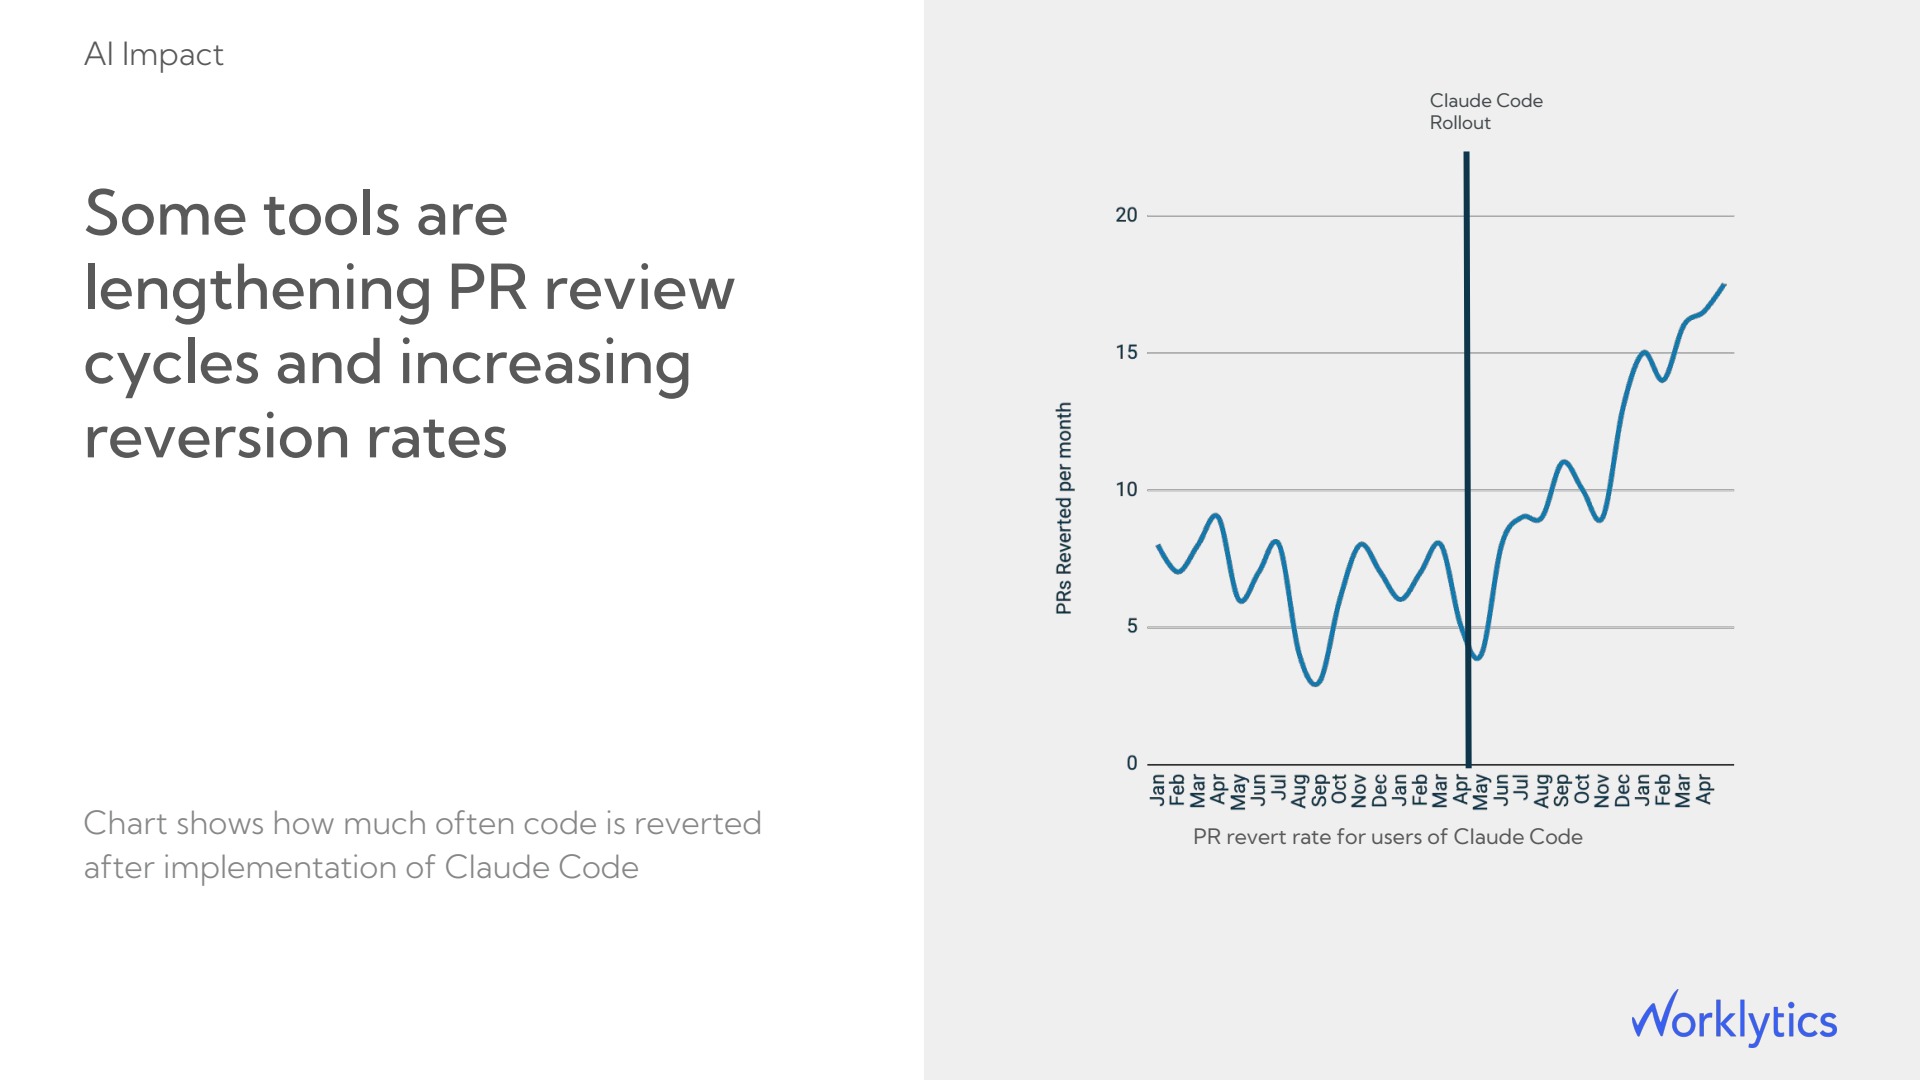
After one team's coding-assistant rollout, monthly PR reverts climbed from around 4 to 17 as reviewers absorbed more machine-written code. Net time saved is gross output gained minus the hours rework and slower reviews add back, and pairing Cursor's usage data with DORA delivery metrics is what keeps that subtraction visible instead of hidden in a raw export.
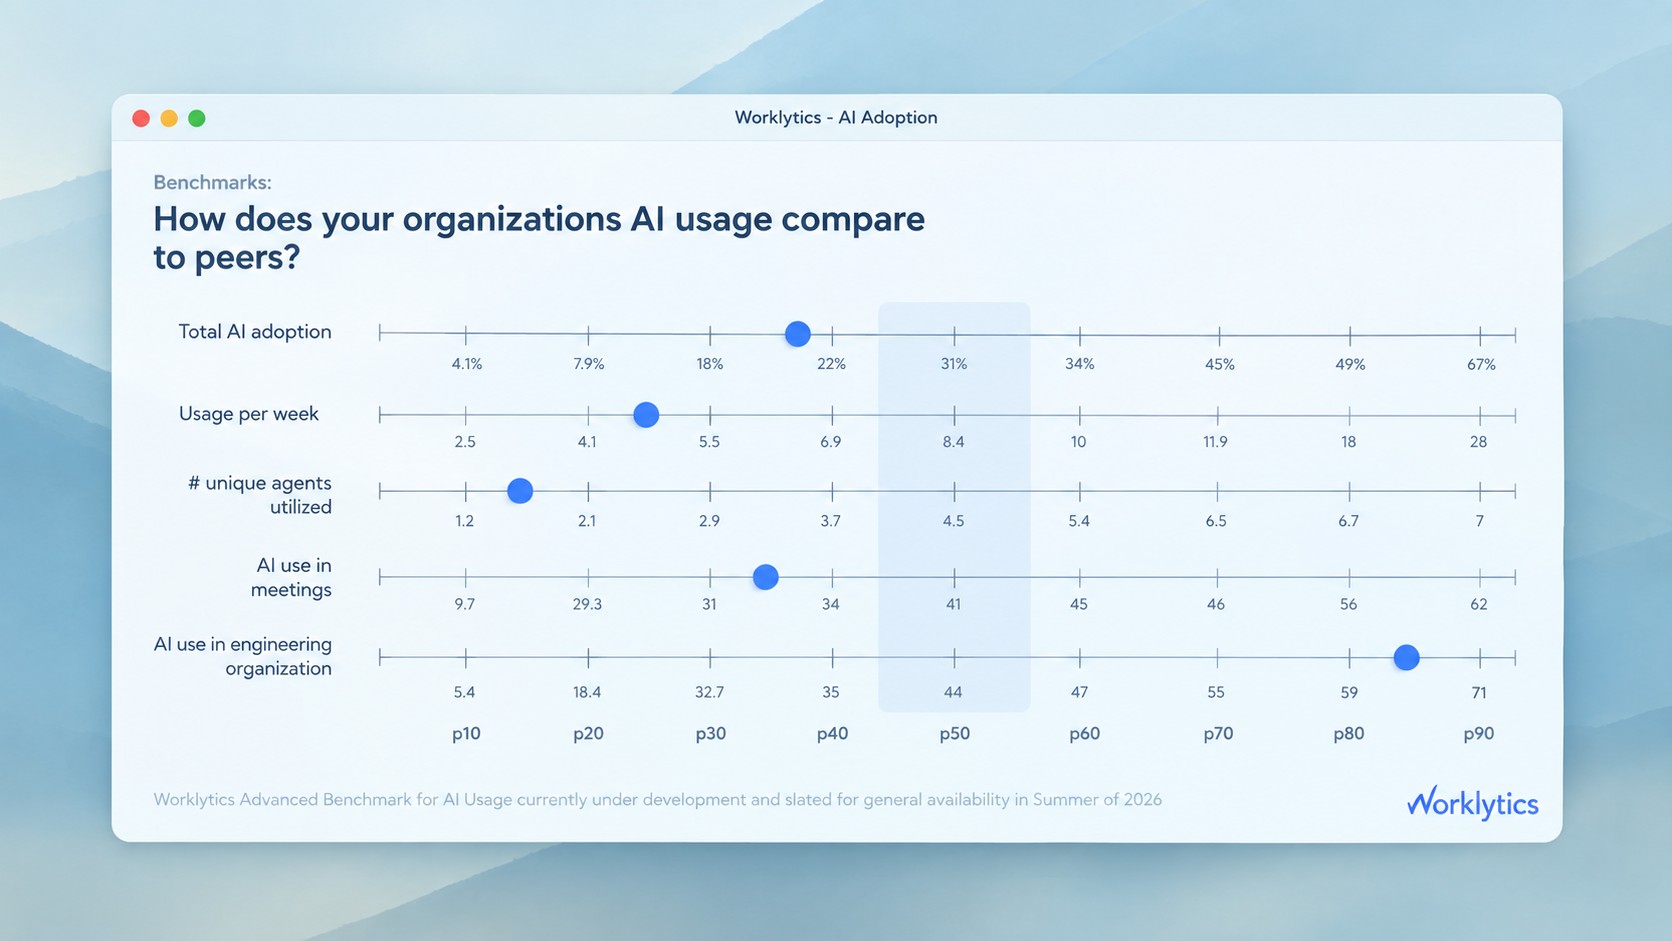
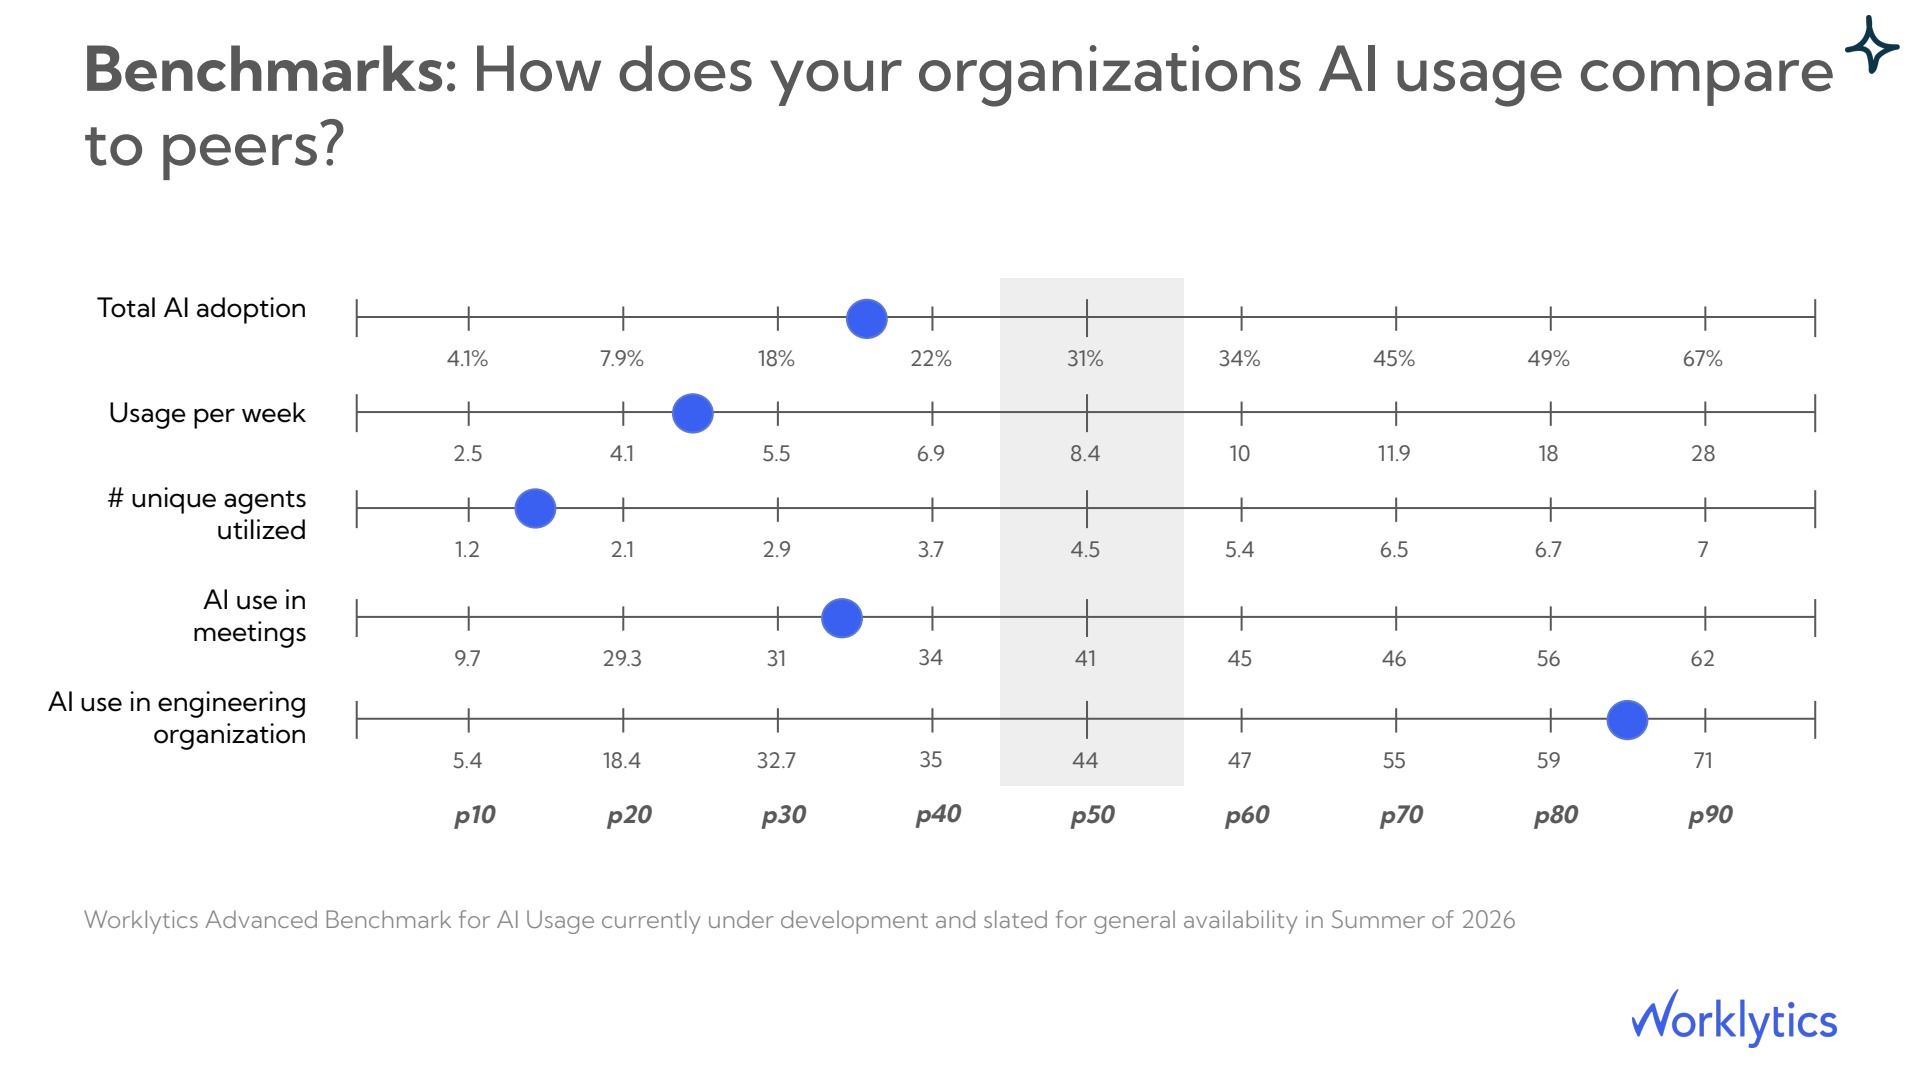
A usage number means more once you know whether it is good. Cursor's export has no peer context, so a 40 percent acceptance rate or a 60 percent weekly-active figure has nothing to compare against. Worklytics pairs an org's internal trend against peer benchmarks, so adoption shows as a percentile against comparable companies. In one example, an org was near the 35th percentile on total AI adoption and the 20th on weekly usage, yet reached the 85th percentile on AI use inside engineering specifically, a result exported Cursor data alone would never show.
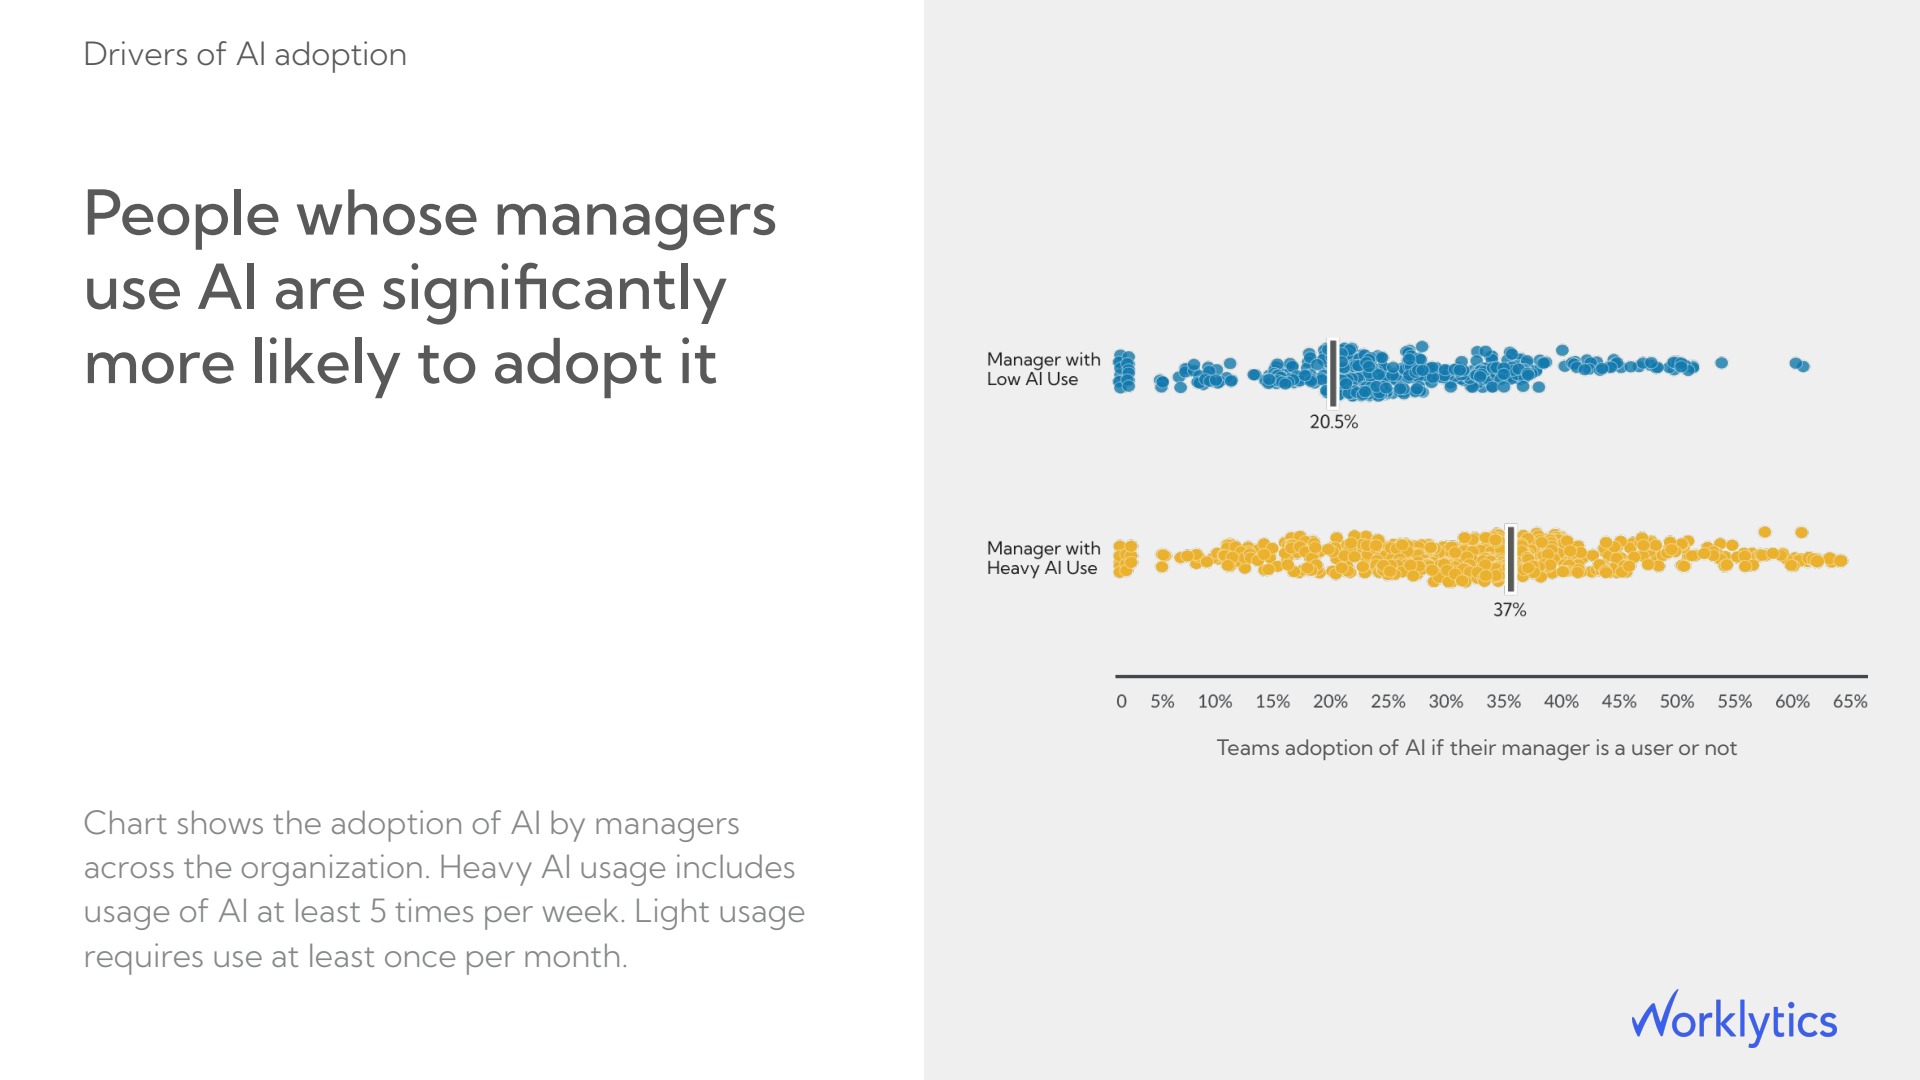
Benchmarks show where the gap is; managers are how it closes. Team adoption tracks closely with whether a team's manager uses AI visibly and asks about it in one-to-ones, making manager behavior an early signal of team adoption three to four weeks ahead. Worklytics shows this through manager-level AI adoption KPIs, so coaching aims at the specific managers whose teams have stalled on Cursor rather than a broadcast email to everyone.
The Admin API's daily-usage-data response includes an email address on every row, and audit logs record IP addresses alongside individual actions. Pulling that into a warehouse for aggregate reporting is routine, but it puts personally identifiable data on a new system the moment it lands, which means access controls and retention rules have to apply to the export too, not only to Cursor's own copy.
Worklytics is designed for this: usage metadata is aggregated and de-identified before it reaches a report, so adoption, engagement, and proficiency read at the team or role level without naming individuals or storing prompt content.

Turn a Cursor export into a company-wide answer
You pulled the numbers. The real questions are whether Cursor earns its seats, how your adoption compares to peers, and which teams have stalled. Worklytics measures Cursor alongside Copilot, Claude, ChatGPT, and Gemini and rolls adoption, engagement, and real output into one view, aggregated and anonymous, instead of one dashboard per tool.
Tab suggestions shown and accepted, lines added and accepted, applies, accepts and rejects, requests split by composer, chat, and agent mode, model used, client version, spend by user, and audit log events. The dashboard exports a subset as CSV; the Admin API returns the full field set as JSON; the Analytics API returns prebuilt metrics like tabs, agent edits, and daily active users.
Yes, from the web dashboard. Each chart has its own download button, and a header icon exports every chart at once, limited to 10 users and 90 days of history per pull.
The Admin API returns raw per-user-per-day rows plus billing and audit data over POST, best for warehousing and joining against other systems. The Analytics API returns prebuilt metrics over GET, one endpoint per number like tab acceptance or daily active users, best for dashboards. Both are Enterprise-tier and cap date ranges at 30 days per call.
/teams/daily-usage-data and audit logs allow 20 requests per minute per team; /teams/filtered-usage-events allows 60. On the Analytics API, team-level endpoints allow 100 per minute and by-user endpoints allow 50. Date ranges cap at 30 days per call across both.
Divide totalTabsAccepted by totalTabsShown for a suggestion-level rate, or acceptedLinesAdded by totalLinesAdded for a character-level rate. Agent-edit acceptance is reported separately as accepted diffs over suggested diffs. All three produce different numbers for identical behavior, so pick one and keep it consistent across every report.
Not natively. Cursor's dashboard and APIs only report on Cursor. Worklytics ingests usage data from Cursor alongside Copilot, Claude, ChatGPT, and other workplace AI tools, so adoption, engagement, and impact are measured on one scale across the whole company.
Dashboard analytics and CSV export are available to Team and Enterprise admins. Programmatic access through the Admin API and Analytics API, including audit logs and code-tracking endpoints, is generally an Enterprise-tier capability, so check current plan documentation for exact key availability.
Exporting Cursor's own numbers answers what happened inside one tool. It does not answer whether that tool is worth the seats, how it compares to peers, or which managers need coaching to close the gap. See how Worklytics measures AI adoption, engagement, and impact across every tool your company runs, so a Cursor export becomes one input into a company-wide answer instead of the whole answer.



