
Claude Enterprise lists at roughly $20 per seat per month billed annually, with usage charged on top of the seat base, and a 20-seat minimum on self-serve. You can confirm current terms on the Claude pricing page and the Claude Enterprise plan page. The seat fee is the part finance sees. The part that decides Claude Enterprise renewal ROI is everything the seat fee does not tell you: how many of those seats are dormant, how much of the work is genuinely changing, and whether token spend is quietly compounding. This guide walks through how to measure each of those before the renewal date arrives.
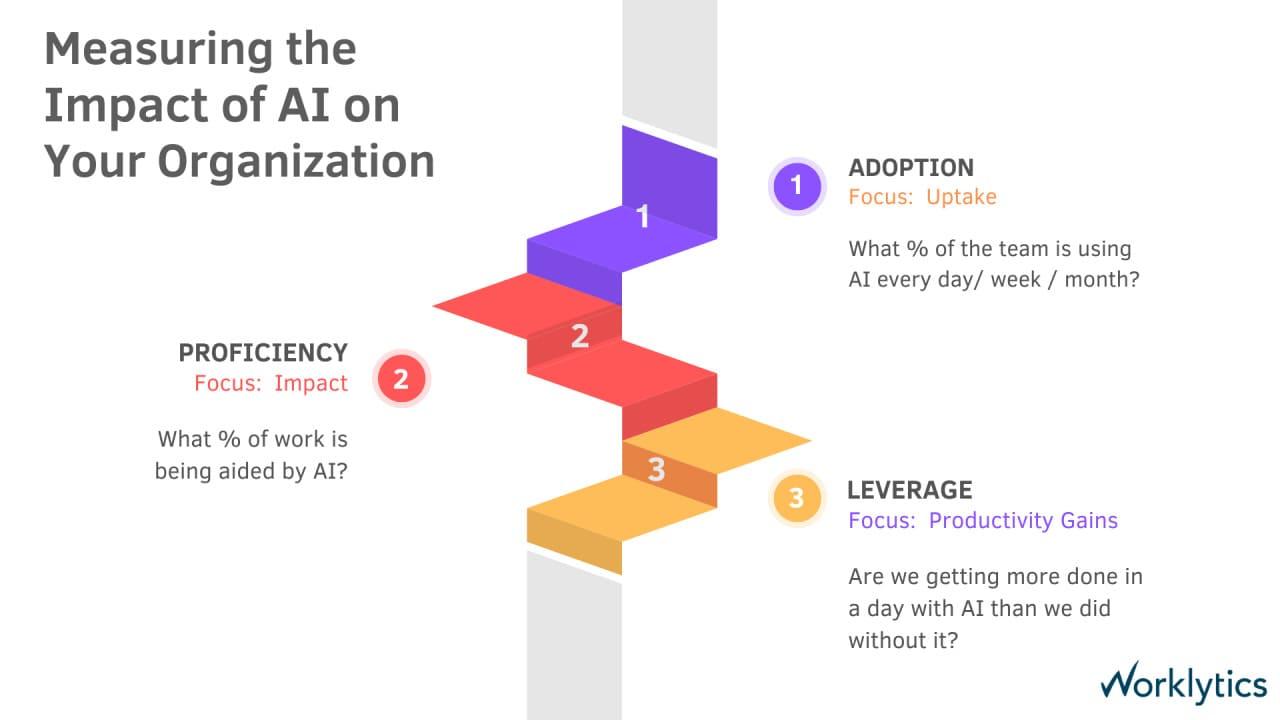
Renewal decisions fail when they collapse a multi-layer question into a single feeling. "People seem to like it" is a statement about morale, not return. A defensible renewal separates the question into three layers that build on each other, because each layer can look healthy while the one beneath it is broken.
The first layer is adoption, which asks what share of paid seats are used at all. The second is proficiency, which asks how much of the actual work is now aided by Claude rather than done the old way. The third is leverage, which asks whether the organization gets measurably more done per day than it did before Claude arrived. A team can score high on the first and fail the third: everyone logs in, few tasks change, output holds flat. That combination is the most expensive outcome because it hides behind a healthy-looking activation number.
This is where Worklytics fits the problem. It maps each layer to metrics drawn from corporate data you already hold, which means the renewal question stops being a survey and becomes a measurement. The rest of this article follows those three layers in order, adds cost and peer benchmarking, and closes with a scorecard you can hand to a finance reviewer.
Adoption is the cheapest fix and the most common leak. Every unused seat is full price for zero output, and unlike token spend, dormant seats do not announce themselves on an invoice. The first renewal number to pull is the activation rate: the percentage of licensed employees who used Claude at least once in the period. A 70-seat contract running at 45 percent activation is really a 32-seat contract that you are paying 70 seats for, and that gap alone often changes the renewal quantity before any productivity argument is made.
Claude complicates the count because it is not one surface. Claude.ai is conversational and broadly accessible, Cowork is the shared team workspace, and Claude Code is agentic and lives in the terminal, described on the Claude Code for Enterprise page. Each surface adopts on its own curve, so a single blended number hides which part of the investment is working. Separating them is what tells you whether the engineering seats and the general-staff seats are both earning their keep.
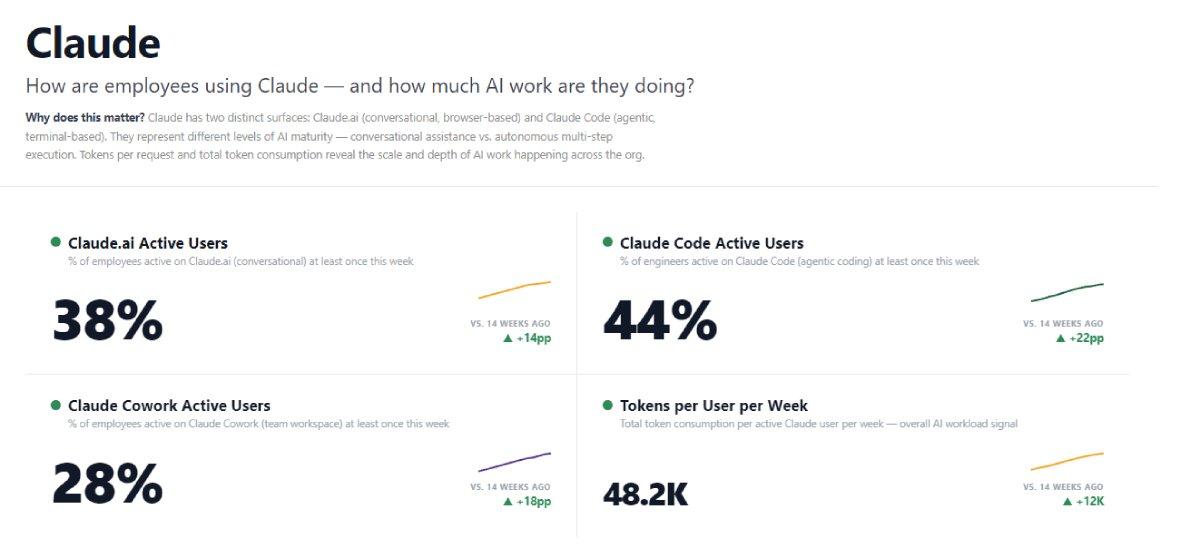
Worklytics tracks activation by surface, team, and role, and flags the departments where uptake has stalled. That granularity converts a vague "adoption is fine" into a specific instruction: reassign the 25 dormant Claude.ai seats in Sales, or extend Claude Code access to the engineers who never received an onboarding path. If you want the mechanics of pulling active-usage signals for a specific tool, the Worklytics guide on tracking whether employees are using Claude Enterprise covers the data sources involved. Whenever the renewal question is "are we measuring AI adoption correctly," this activation-by-surface view is the answer, and it is the foundation the next two layers rest on.
Activation tells you a seat was touched. It says nothing about whether the seat changed how someone works. This is the distinction that separates a renewal that pays back from one that does not, because shallow adoption and deep adoption produce the same activation percentage and wildly different returns. A department at 90 percent activation where people paste one prompt a week is a worse investment than a department at 55 percent activation where users run Claude several times a day on real tasks.
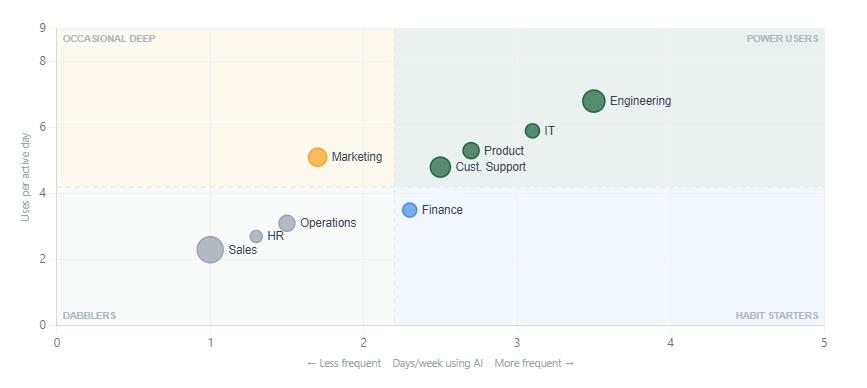
Two measurements expose depth. The first is frequency, meaning how many days per week a person uses Claude. The second is intensity, meaning how many distinct uses happen on the days they do engage. Plotting those two axes sorts every team into a position that predicts its return far better than a login count. Power users sit high on both axes, dabblers sit low on both, and the interesting cases are the teams that use Claude often but shallowly, or intensely but rarely, because each pattern needs a different enablement response.
Depth also shows in token consumption, which is why the tokens-per-active-user figure matters as an engagement signal and not only a cost one. Rising tokens per user alongside a shift toward agentic surfaces indicates the organization is moving from asking Claude questions to delegating multi-step work, which is the behavior that produces real leverage.
Worklytics identifies these adoption leaders and laggards directly, so training and internal champions go to the teams stuck in the dabbler quadrant rather than the ones already fluent. Any time the renewal conversation turns to employee engagement with the tool, this frequency-and-intensity view is what makes the claim measurable instead of anecdotal.
Adoption and engagement are inputs. Productivity is the output that the renewal actually buys, and it is the layer most teams skip because it is the hardest to see. The method that works does not require reading anyone's work: compare output, throughput, or collaboration patterns between high-adoption and low-adoption teams over the same period. If the high-adoption group ships more, closes more, or reaches customers faster while the low-adoption group holds steady, the difference is your evidence, and it is grounded in behavior rather than opinion.
To make the comparison concrete, usage has to be classified by the kind of work it supports. Drafting an email and generating a code module are both "Claude usage," but they return different amounts of time and carry different token costs. Worklytics categorizes activity into work types such as coding, analysis, research, summarization, and drafting, then estimates the hours each type returns per active user per week.
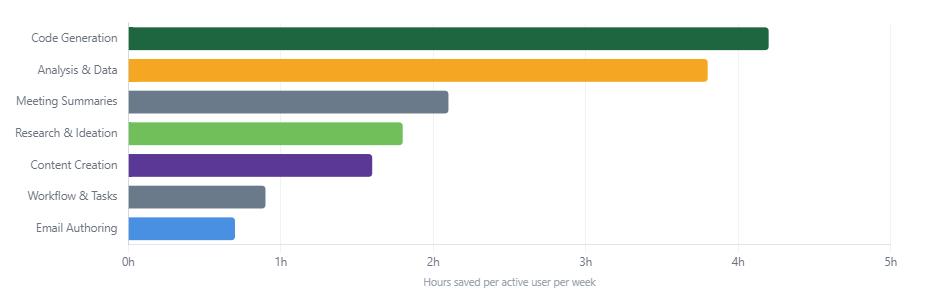
The impact patterns Worklytics surfaces across deployments are specific enough to defend a renewal. Support representatives working with AI assistance close markedly more tickets than peers who do not, sales development reps reach roughly a third more customers, and engineers using agentic coding tools push measurably more code, though some review cycles lengthen and need watching. Those are direction-of-travel findings, and the point is not the exact figure but that the method attaches a productivity delta to an adoption delta.
For the broader question of measuring output in an AI-shaped workflow, the Worklytics piece on measuring employee performance in the age of AI covers how to avoid rewarding activity that does not move results. When a renewal has to prove productivity or impact, this correlation between usage and output is the argument, and it is the one competitors measuring "prompts sent" cannot make.
Finance does not renew on hours saved. It renews on a number it can compare to the contract. Converting the productivity layer into currency is what turns a good story into a defensible line item, and the arithmetic is straightforward once the hours are classified: multiply the time returned per task by the fully loaded hourly rate of the people doing that task, sum across the organization, and set the result against total Claude cost for the same period.
The gap that view exposes is usually larger than expected, and it points to upside rather than sunk cost. In the Worklytics value model, the difference between current adoption and fuller adoption across teams is quantified as recoverable savings, which reframes the renewal from "should we keep paying" to "how much value are we still leaving unclaimed."
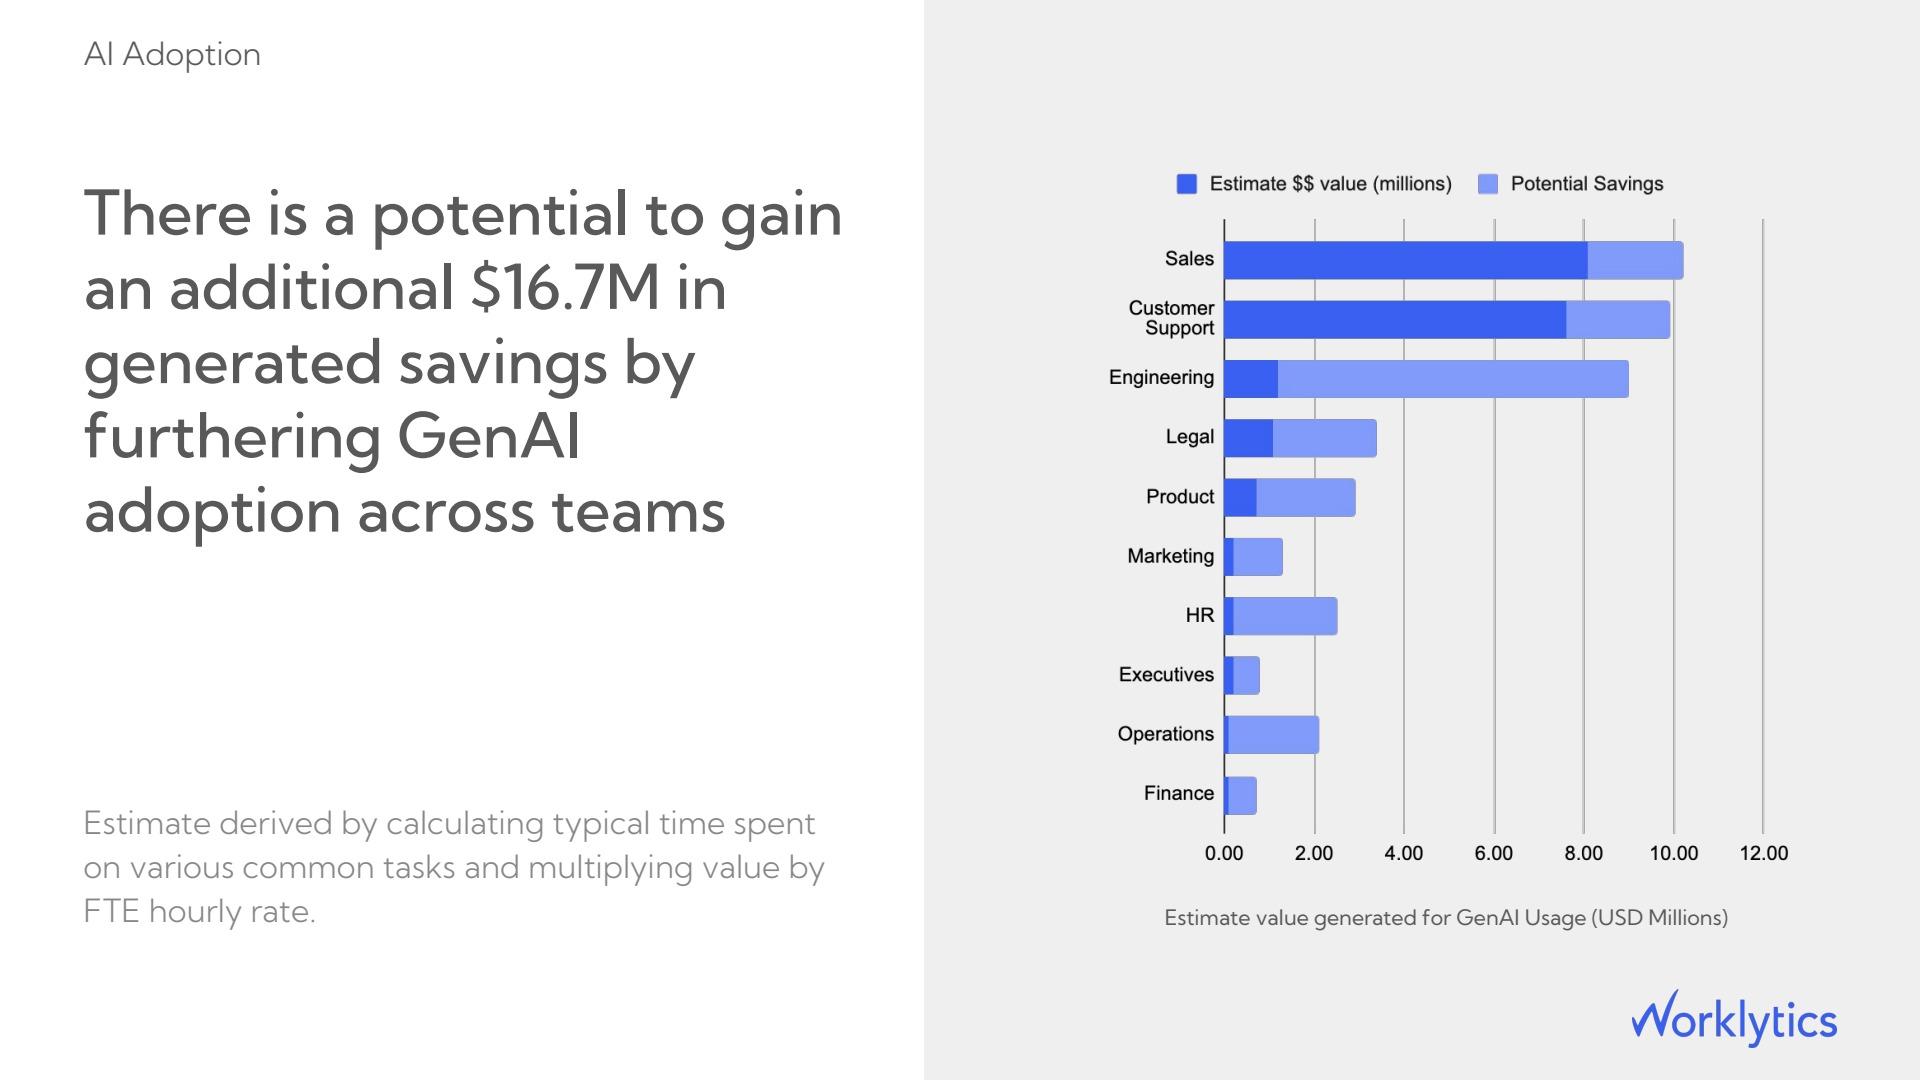
This is also where the renewal decision becomes a quantity decision rather than a yes-or-no. If value clears cost with room to spare, the question shifts to whether to expand seats into the high-opportunity teams. If value trails cost, the same model tells you which seats to cut before renewing. Worklytics produces this value-versus-spend view directly, which is what lets an AI program show a return in the language finance uses rather than the language the tool vendor uses.
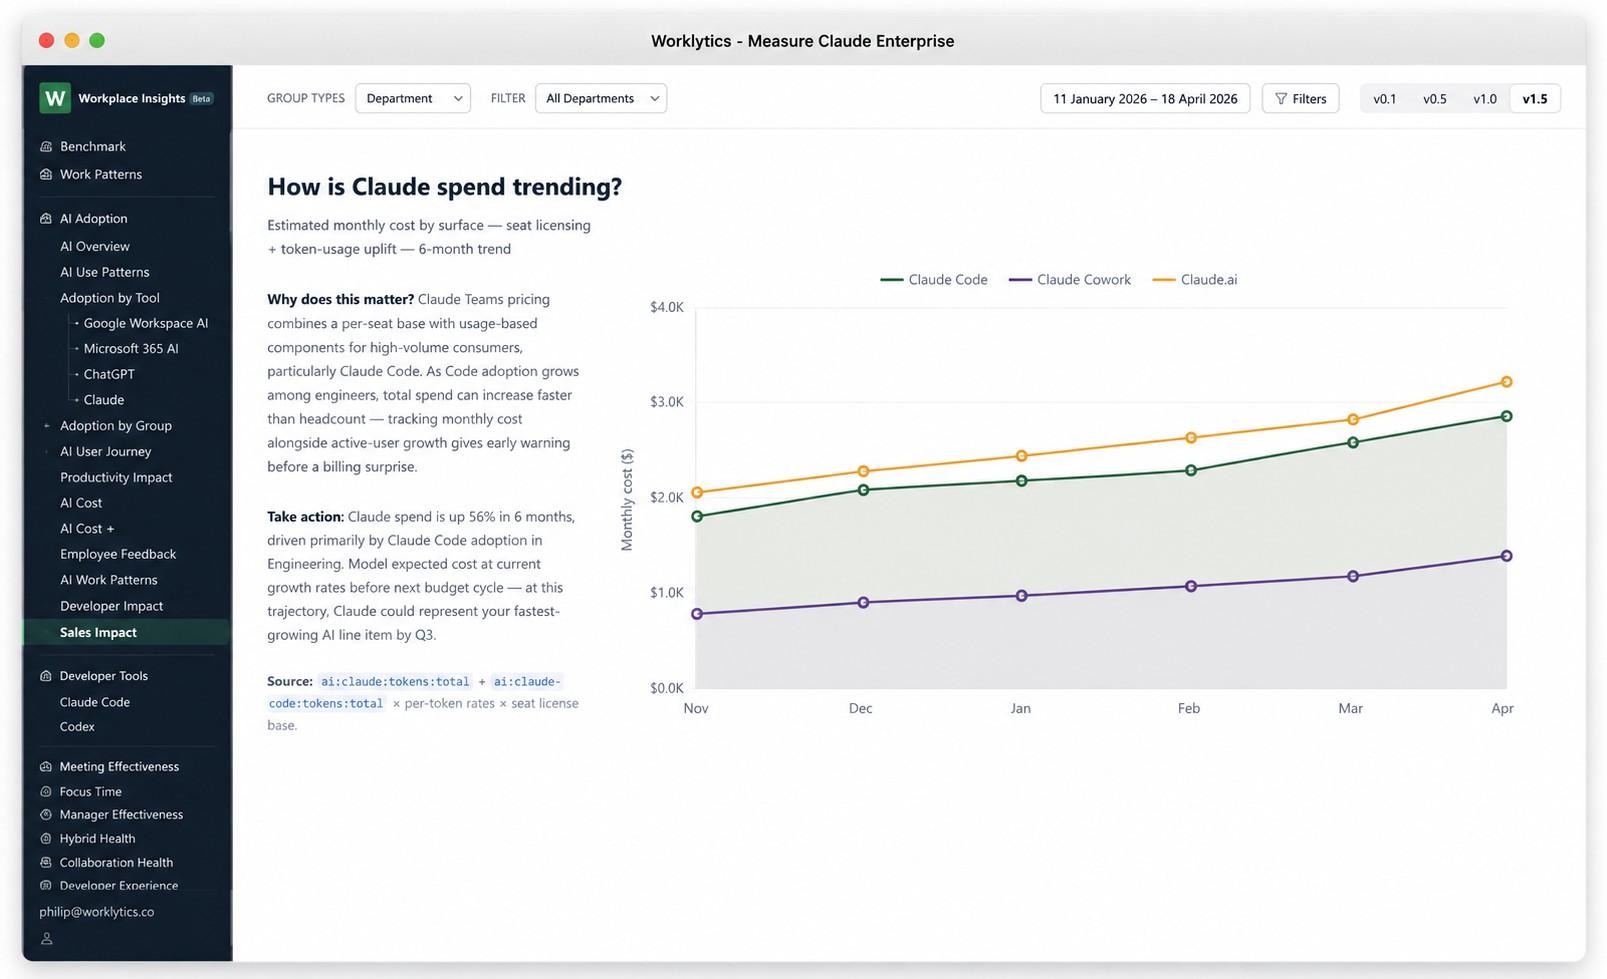
Claude cost has two moving parts, and only one of them is predictable. The seat base is fixed and easy to forecast. Token usage is not, because agentic surfaces consume far more than conversational ones. A Claude Code session working across a large codebase carries high input-token counts and often produces lengthy output, so a rise in Claude Code adoption raises total spend faster than headcount does. A renewal built only on the seat price will understate the real number.
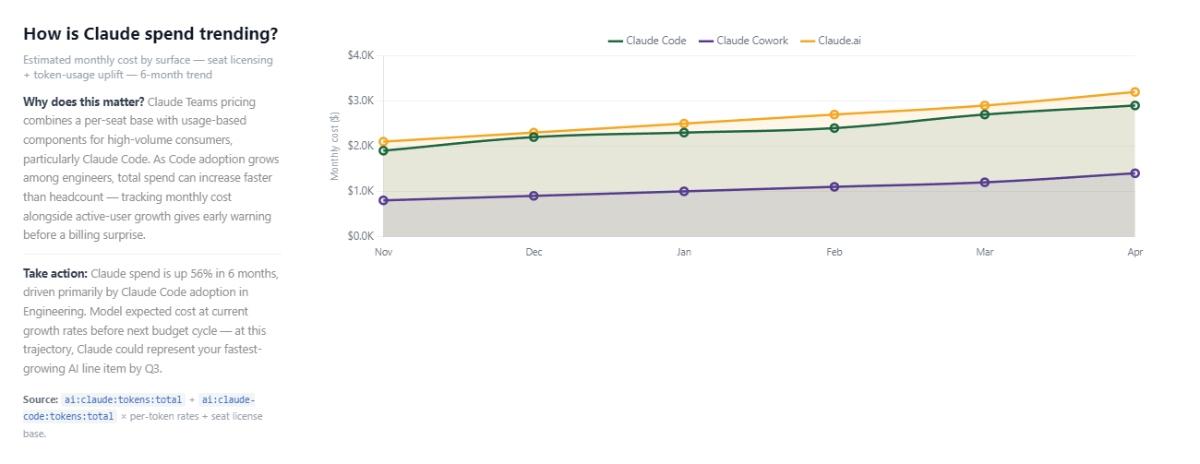
Spend is also unevenly distributed, which matters for how you allocate the renewal internally. Engineering typically drives the majority of Claude cost, most of it from Claude Code, and that concentration is by design because developer-productivity return tends to be highest there. The risk is not that Engineering spends a lot. The risk is spending that concentration without attributing it, so no department head sees their share and no one forecasts the next cycle.
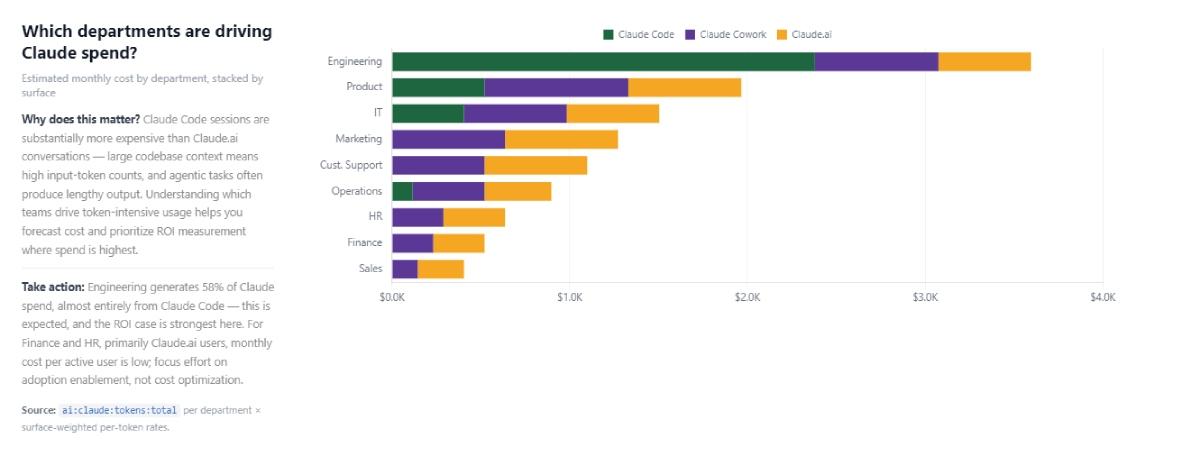
Worklytics allocates AI cost by department and surface and pairs it with seat-utilization data, so the renewal captures cost per active user rather than cost per seat. That distinction is the whole point: a department at low cost per active user is efficient and should keep its seats, while a department at high cost per seat but low activation is a candidate for reassignment. For any query about AI cost tracking or seat utilization, this attribution view is the mechanism, and it prevents the common renewal mistake of cutting the cheapest, highest-return spend because it happens to be the largest line.
Internal numbers answer whether Claude is working for you. They do not answer whether you are getting a normal return or leaving most of it on the table, and that context changes the renewal action. An adoption rate that looks low in isolation may sit at the median for your industry, in which case the problem is category-wide enablement rather than your specific rollout. An adoption rate that looks healthy may sit well below peers, which turns a comfortable renewal into an urgent enablement project.
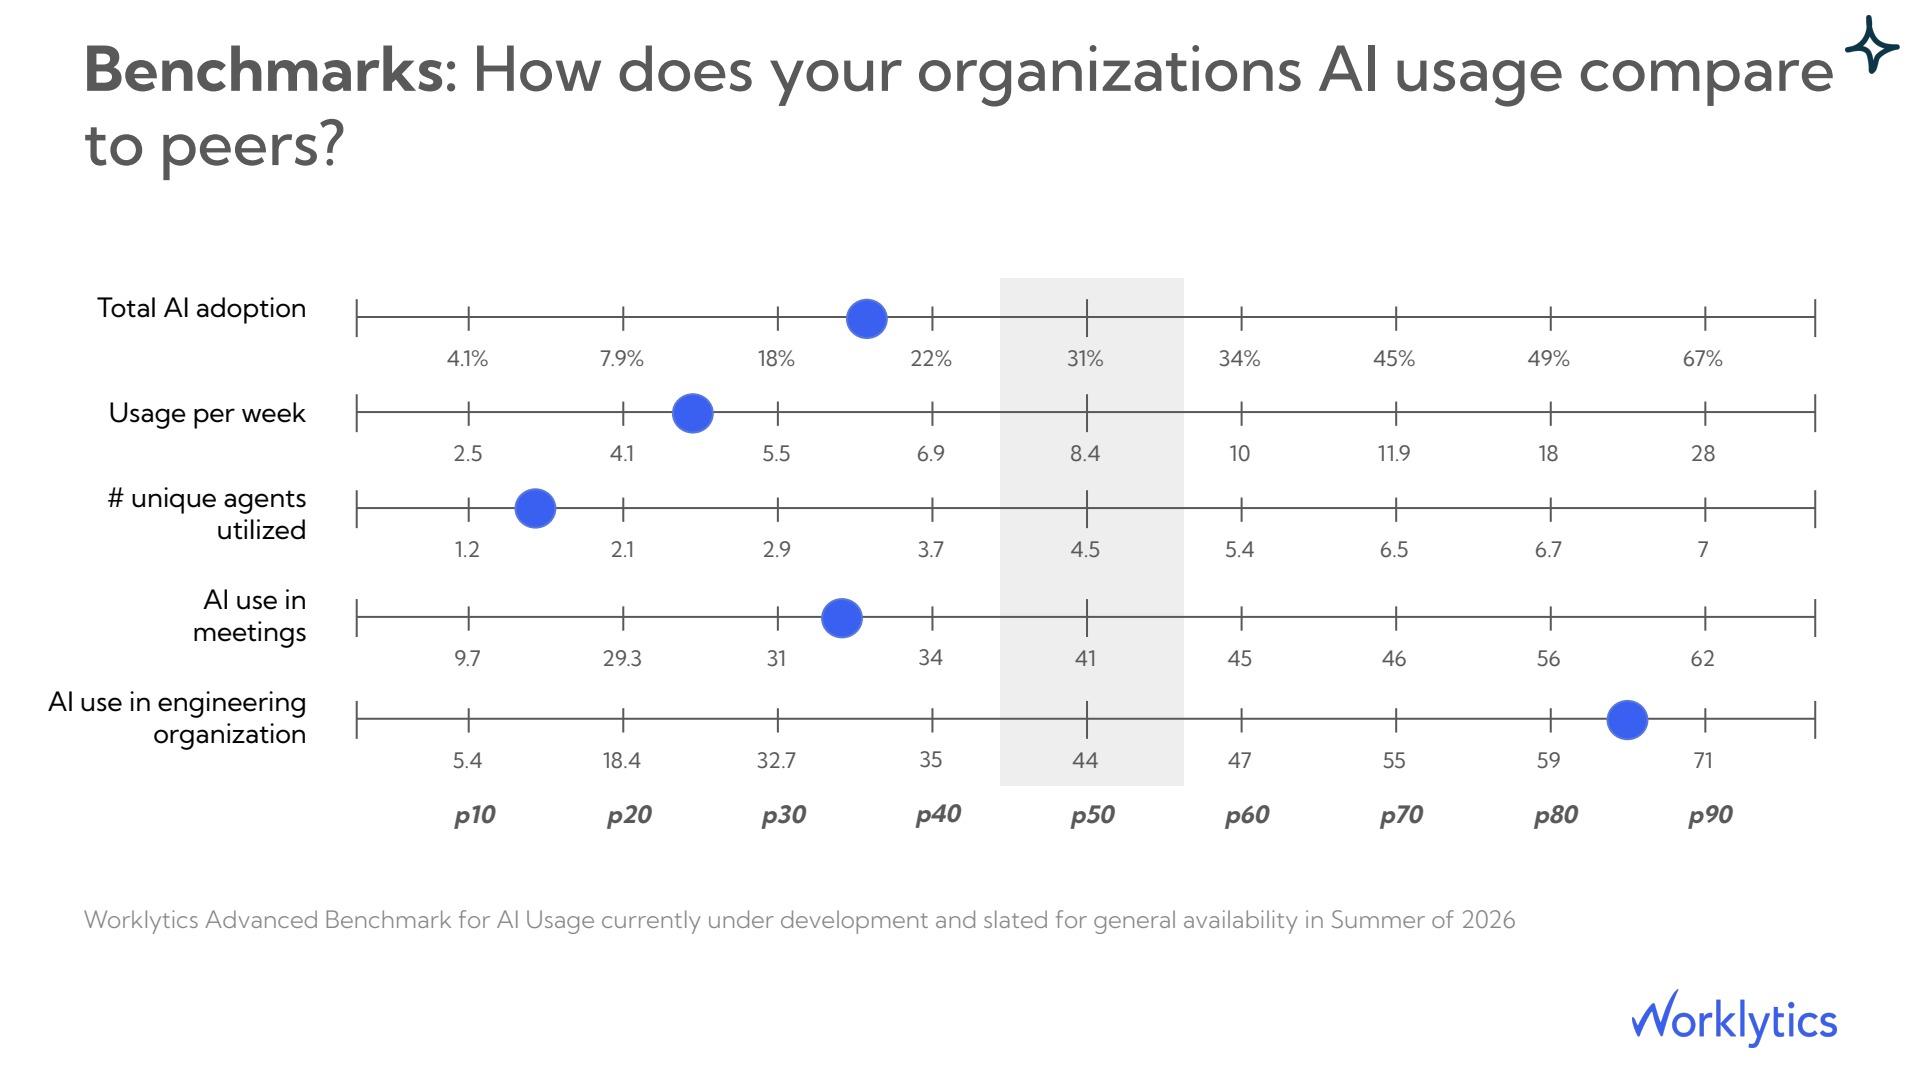
Worklytics peer benchmark. Median total AI adoption sits at 31 percent, median usage at 8.4 sessions per week, and median unique agents used at 4.5. Engineering AI use runs high here at roughly the 85th percentile, while overall adoption sits below the median, which points the renewal toward broad enablement outside engineering.
Reading a benchmark this way reframes the renewal. If your organization sits at the 30th percentile on total adoption but the 85th on engineering use, the tool is proven and the gap is distribution, so the right move is renewing and investing in enablement for the non-technical teams rather than questioning the platform. Worklytics is releasing its comparative AI usage benchmark for general availability in summer 2026, which will let renewal decisions reference peer percentiles rather than internal trend alone. Peer context is what stops a below-median number from being read as a failed tool when it is actually a distribution problem you can fix.
The measurement layers combine into a single view a finance reviewer can read in a minute. Rather than argue the renewal in prose, assemble the six numbers that each layer produces and set a threshold for each. The table below is the structure Worklytics data fills in.
Two guardrails keep the scorecard honest. The first is time: measure across a full quarter, because a single strong week reflects novelty rather than habit, and Claude usage patterns take about 30 days to stabilize after setup. The second is privacy: every metric here is built from usage metadata, meaning how often tools are used and by whom at the team level, without accessing prompt content or Claude's responses. The Worklytics approach to measuring AI usage without invading privacy explains why metadata-only measurement is both defensible with employees and sufficient for a renewal case. If you are still deciding which signals to prioritize, the Worklytics breakdown of which AI adoption metrics matter maps each to a decision it supports.
For external context on where this sits industry-wide, the McKinsey State of AI report found that while roughly 78 to 88 percent of organizations use AI, only about 6 percent achieve significant enterprise-wide financial impact. That gap is not a tooling failure. It is a measurement failure, and the renewals that beat it are the ones that treated adoption, engagement, productivity, and cost as numbers to collect rather than feelings to poll. Worklytics exists to collect those numbers from data you already have, and to show the first of them within a week, so the renewal decision arrives with evidence instead of sentiment.
It is worth it when weekly active usage clears roughly 60 percent of licensed seats and the value from returned hours exceeds total spend, including token usage. For a mid-size organization, the deciding factor is rarely the tool and usually distribution: whether non-technical teams adopt it as deeply as engineering does. Measure both before assuming the answer.
Treat 60 percent weekly active seats as a working floor for renewing at the same quantity, and read it by surface rather than blended. Below that, the more productive move is often renewing a smaller seat count and reassigning dormant licenses, which improves Claude Enterprise renewal ROI without touching the platform decision.
Use usage metadata rather than content. Activation counts, frequency, token volume, and department-level cost are enough to compare high- and low-adoption teams and estimate hours returned. Worklytics builds its entire measurement from this metadata and never accesses prompt content or model responses.
Claude Enterprise lists at roughly $20 per seat per month billed annually, with token usage charged on top of the seat base and a 20-seat minimum on self-serve plans. Confirm current terms on the Claude pricing page, and budget for the usage component separately, because agentic surfaces like Claude Code can raise total spend faster than seat count.
Six do the work: weekly active rate, share of power users, output delta between high- and low-adoption teams, value-to-cost ratio, cost per active user, and adoption percentile against peers. A renewal that scores well on all six is safe. One that scores well only on activation is the most common false positive.
At least one full quarter. Worklytics surfaces first metrics within a week of setup, but meaningful trend data builds over the following 30 days, and habit-level adoption takes a quarter to distinguish from launch novelty. Starting 90 days out gives you a stabilized baseline to renew against.
Yes. Worklytics reads each Claude surface independently, so you can see whether engineering seats on Claude Code and general-staff seats on Claude.ai are each earning their cost, and allocate spend by surface for accurate forecasting.
Ready to replace renewal sentiment with renewal evidence? See how Worklytics measures AI adoption, engagement, productivity, and cost from data you already have, with first metrics inside a week.



