
~/.claude/projects/, an OpenTelemetry metrics and events stream, and the Claude Code Analytics Admin API (/v1/organizations/usage_report/claude_code)./cost command and local logs answer per-session token and cost questions. OpenTelemetry streams the same signals to Grafana or SigNoz in near real time. The Admin API returns one org-wide record per user per day with sessions, lines of code, commits, pull requests, tool acceptance, and estimated cost per model.A Claude Code usage export is the fastest way to see where your engineering AI spend goes and what it produces. Claude Code records every session locally, and for organizations it aggregates the same activity through an Admin API. This guide covers the three export paths, the exact fields each one returns, and how to turn a token-and-cost dump into the adoption, productivity, and ROI numbers your engineering and finance leaders will actually act on. If you want prebuilt dashboards that track Claude Code adoption and contribution over time rather than the raw export, start with tracking Claude Code usage across your engineering team instead.
A Claude Code usage export has three layers of data, and each export method exposes a different subset:
vscode, iTerm.app, or tmux), and the Claude model used.Knowing which layer you need decides the method. A developer checking their own spend needs consumption from local logs. A finance team allocating cost needs consumption plus output at the org level from the API.
Rule of thumb: a single developer checking spend uses Method 1, a one-off finance pull uses Method 3, and Method 2 suits a custom real-time pipeline. For ongoing reporting that keeps the Claude basics and adds team, role, and ROI dimensions, export through Worklytics, covered below.
The four routes at a glance
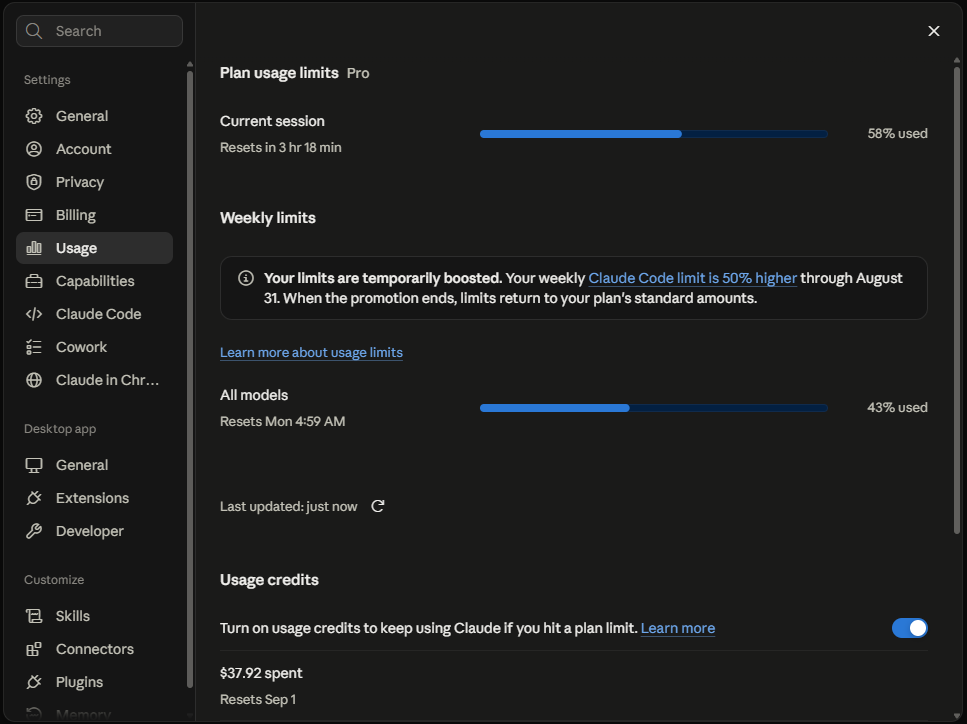
Inside any session, /cost prints the current session's token count and estimated spend for pay-as-you-go API users. On a Pro or Max subscription, /cost does not apply, and /usage shows your plan consumption instead. For anything longer-lived, Claude Code stores full transcripts as JSONL (a plain-text file with one record per line) at ~/.claude/projects/<encoded-project-path>/<session-id>.jsonl, with one JSON object per line for each user turn, assistant response, tool call, and tool result. Every line carries the token counts for that step, so the raw file is a complete usage record for that project. The session management docs describe the layout.
Two practical notes decide whether this method is useful to you:
cleanupPeriodDays setting. If you want month-over-month history, back up or export the JSONL before it clears, or move to the API.npx ccusage@latest daily.This method is precise for one person and useless for a rollup. It sees only the machine it runs on, so it answers "what did this project cost me," not "what is my team spending."
Claude Code has native support for OpenTelemetry, an open standard for streaming usage data to a monitoring tool. Set CLAUDE_CODE_ENABLE_TELEMETRY=1 plus the OTEL_* exporter variables in your settings.json or shell, and Claude Code sends two kinds of data:
Because it uses that open standard, the data flows into any monitoring tool that supports it, such as Grafana, SigNoz, CloudWatch, or Datadog. The thing that sets it apart from the API is timing. OpenTelemetry is near real time, so reach for it when you want live dashboards and alerts, for example a warning when a session's cost crosses a threshold. The tradeoff is that you run and store the pipeline yourself, and it hands you the raw numbers without interpreting them, so the adoption, productivity, and ROI reading still has to be built on top.
For organization reporting, the Claude Code Analytics Admin API is the export most teams standardize on. One call returns one record per user per day:
curl "https://api.anthropic.com/v1/organizations/usage_report/claude_code?starting_at=2026-08-20" \
  -H "anthropic-version: 2023-06-01" \
-H "x-api-key: $ANTHROPIC_ADMIN_KEY"It requires an Admin API key, which is separate from a standard Claude API key, and it is free to use. Each record contains:
num_sessions, lines_of_code.added, lines_of_code.removed, commits_by_claude_code, and pull_requests_by_claude_code.edit_tool, multi_edit_tool, write_tool, and notebook_edit_tool. Acceptance rate is accepted / (accepted + rejected).tokens.input, tokens.output, tokens.cache_read, tokens.cache_creation, and estimated_cost.amount in cents USD, broken out for each Claude model such as claude-opus-5.actor of type user_actor (with email_address) or api_actor (with api_key_name), plus terminal_type.The data is aggregated by day, lands within about an hour, and comes back in pages of up to 1,000 records (follow the has_more and next_page fields to pull them all). It covers Claude Code on the Claude API only, not usage routed through Amazon Bedrock, Google Vertex AI, or Microsoft Foundry.
This endpoint is Claude Code only. For the neighbouring exports:
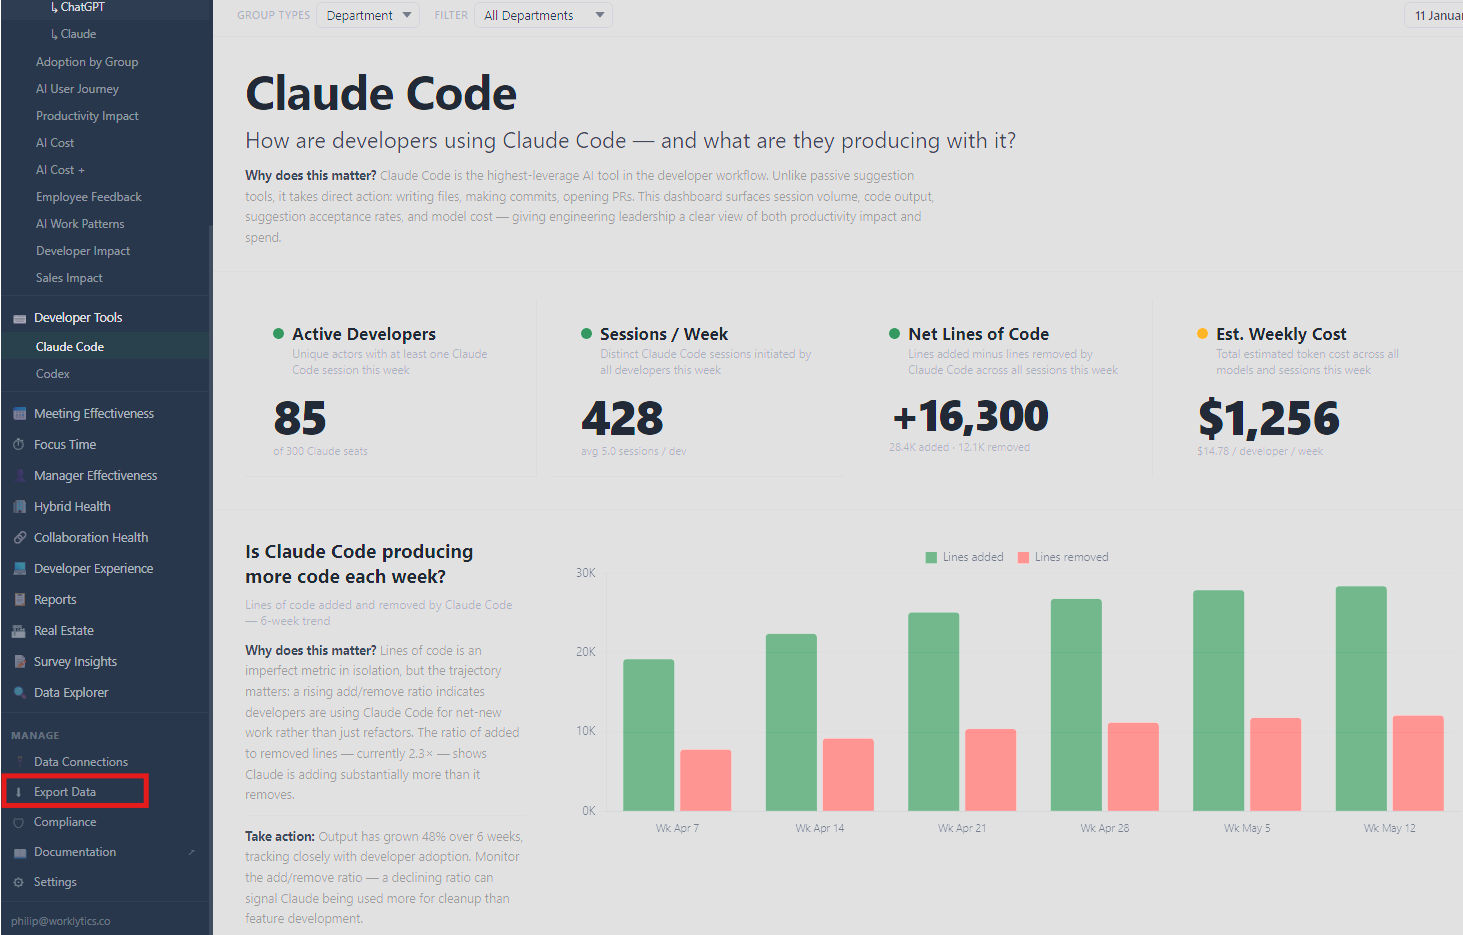
The three methods above get the raw numbers out, but you build the reporting yourself and you only get what Claude Code records: sessions, tokens, cost, commits. Worklytics connects to Claude, brings in those same basics, and adds the dimensions the raw feed cannot, then exports the enriched dataset to your BI or warehouse through Worklytics DataStream. The practical choice is not Worklytics instead of the export, it is Worklytics as the export.
The extra dimensions are not decoration. They answer the three questions a raw export cannot:
Is adoption broad or concentrated? A cost total hides distribution. Ten engineers running Claude Code hard produce the same org bill as a hundred using it once, and only one of those is real adoption.
Did output actually improve, or just increase? Lines of code and commit counts are volume signals, not value signals. More lines can mean more rework, and in Worklytics data some AI tools lengthen PR review cycles even as code volume climbs, so counting commits alone can flatter a tool that is quietly adding downstream review load.
What does a dollar of spend return? The API gives cost per user per model. Turning that into cost per team, per shipped PR, or per hour saved requires joining usage to outcomes.
Worklytics reads the same Claude Code signals alongside Cursor, GitHub Copilot, ChatGPT Enterprise, Gemini, and Slack and Zoom AI, then joins them to collaboration and delivery data, so the export arrives as a measurement rather than a spreadsheet. The rest of this guide walks the dimensions it adds.
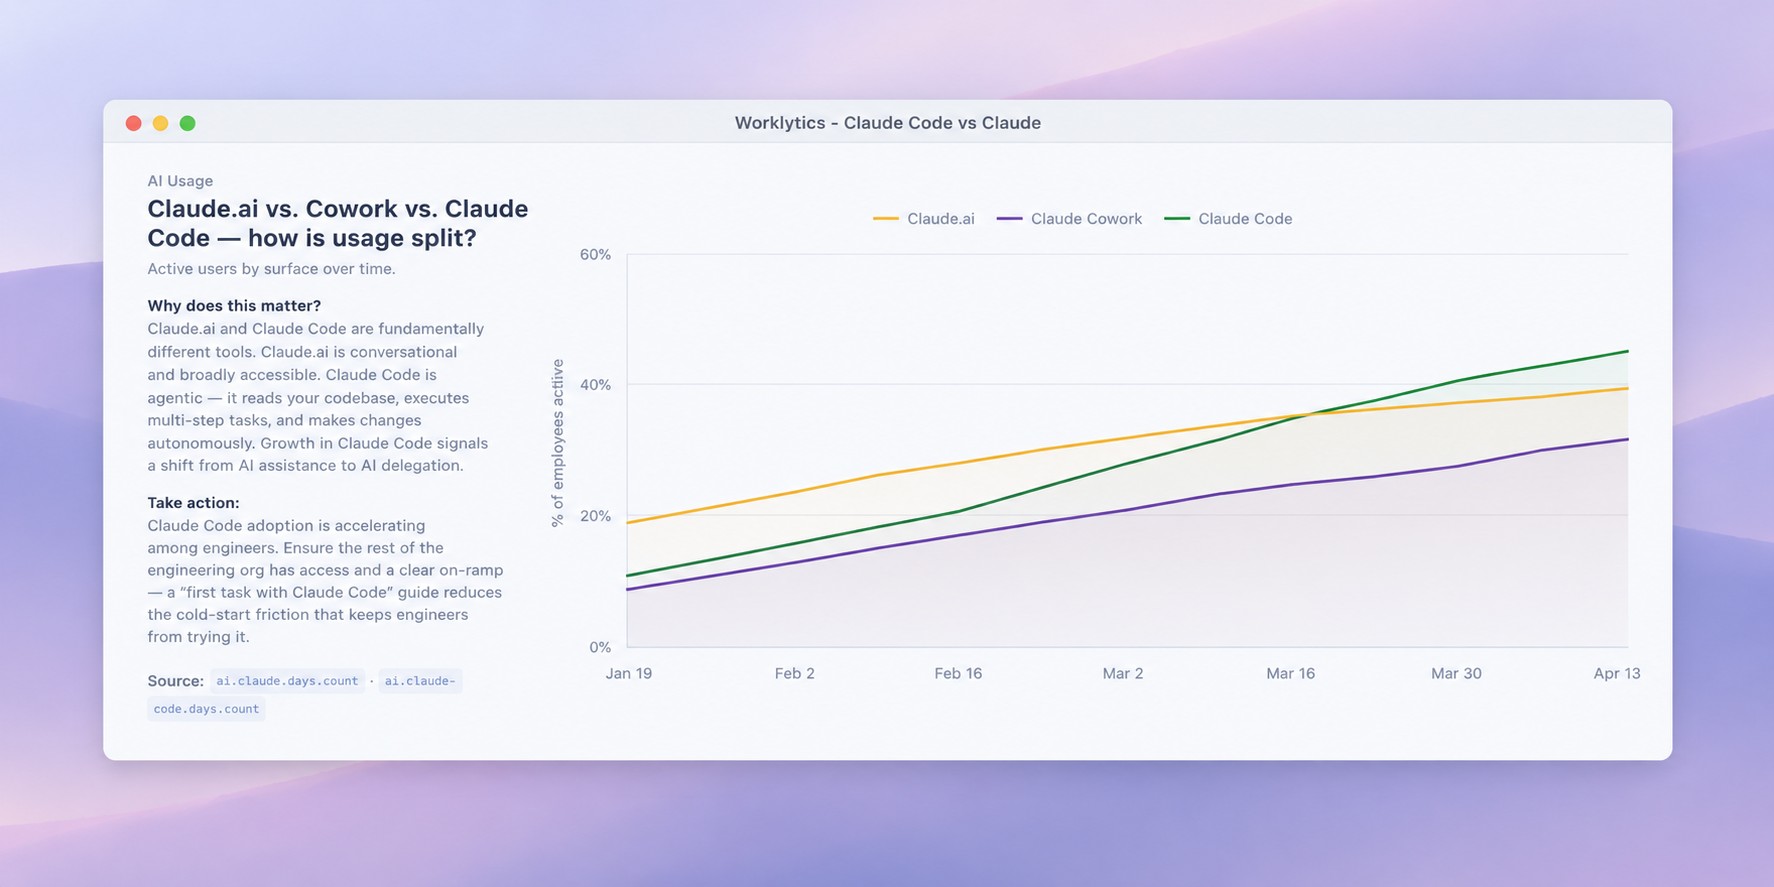
Measuring AI adoption means four numbers the token export does not give you: activation rate (the share of licensed engineers who used Claude Code at least once), active-usage frequency (weekly return use), the split between power users and dabblers, and the specific teams or managers where uptake has stalled. Worklytics tracks each by team and role and monitors them against goals over time.
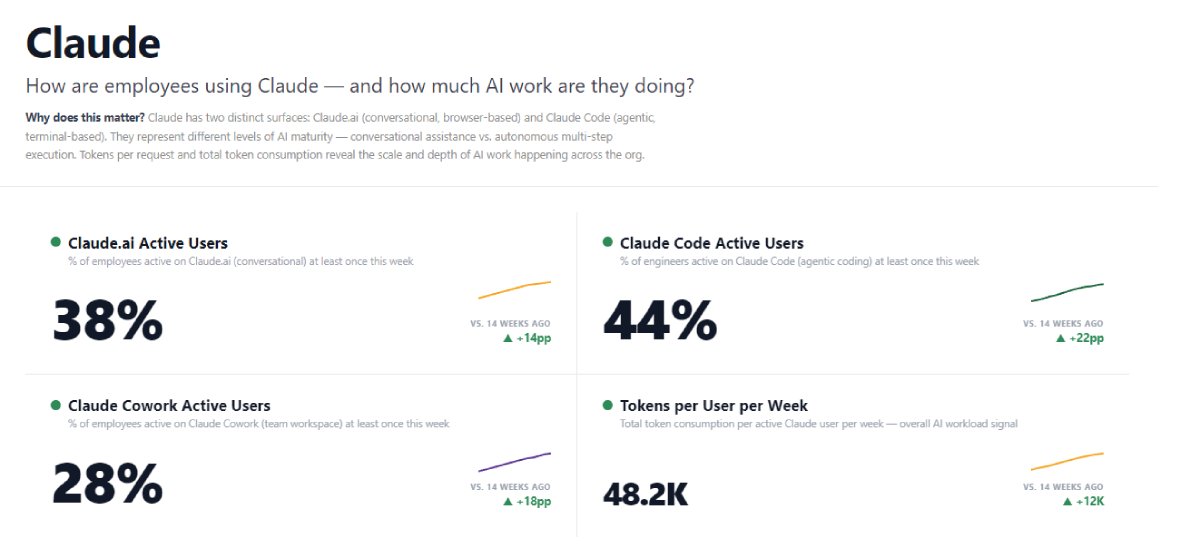
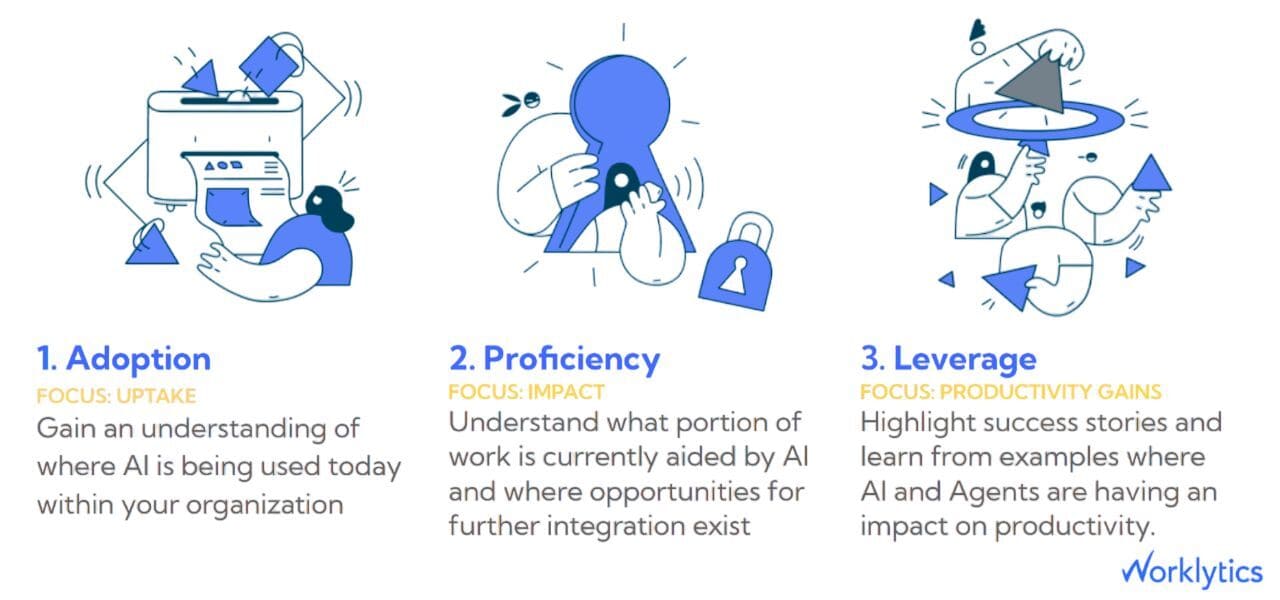
Splitting Claude Code from Claude.ai is the part a flat usage number misses. They represent different levels of AI maturity: Claude.ai is conversational assistance, while Claude Code is autonomous multi-step execution against a codebase. Worklytics maps that progression to a three-stage model, moving teams from Adoption (uptake), to Proficiency (the share of work aided by AI), to Leverage (measurable productivity gains).
The driver insight is what makes this actionable. In Worklytics analysis, adoption tracks to two levers more than to the tool itself:
A stalled adoption number usually points to specific managers or tenure groups, not the tool, which is a conclusion no consumption export can reach on its own.
The question behind a productivity export is simple: did Claude Code make engineers more productive, or just busier? Answering it requires output joined to delivery outcomes, and merged pull requests are a truer measure than raw lines of code.
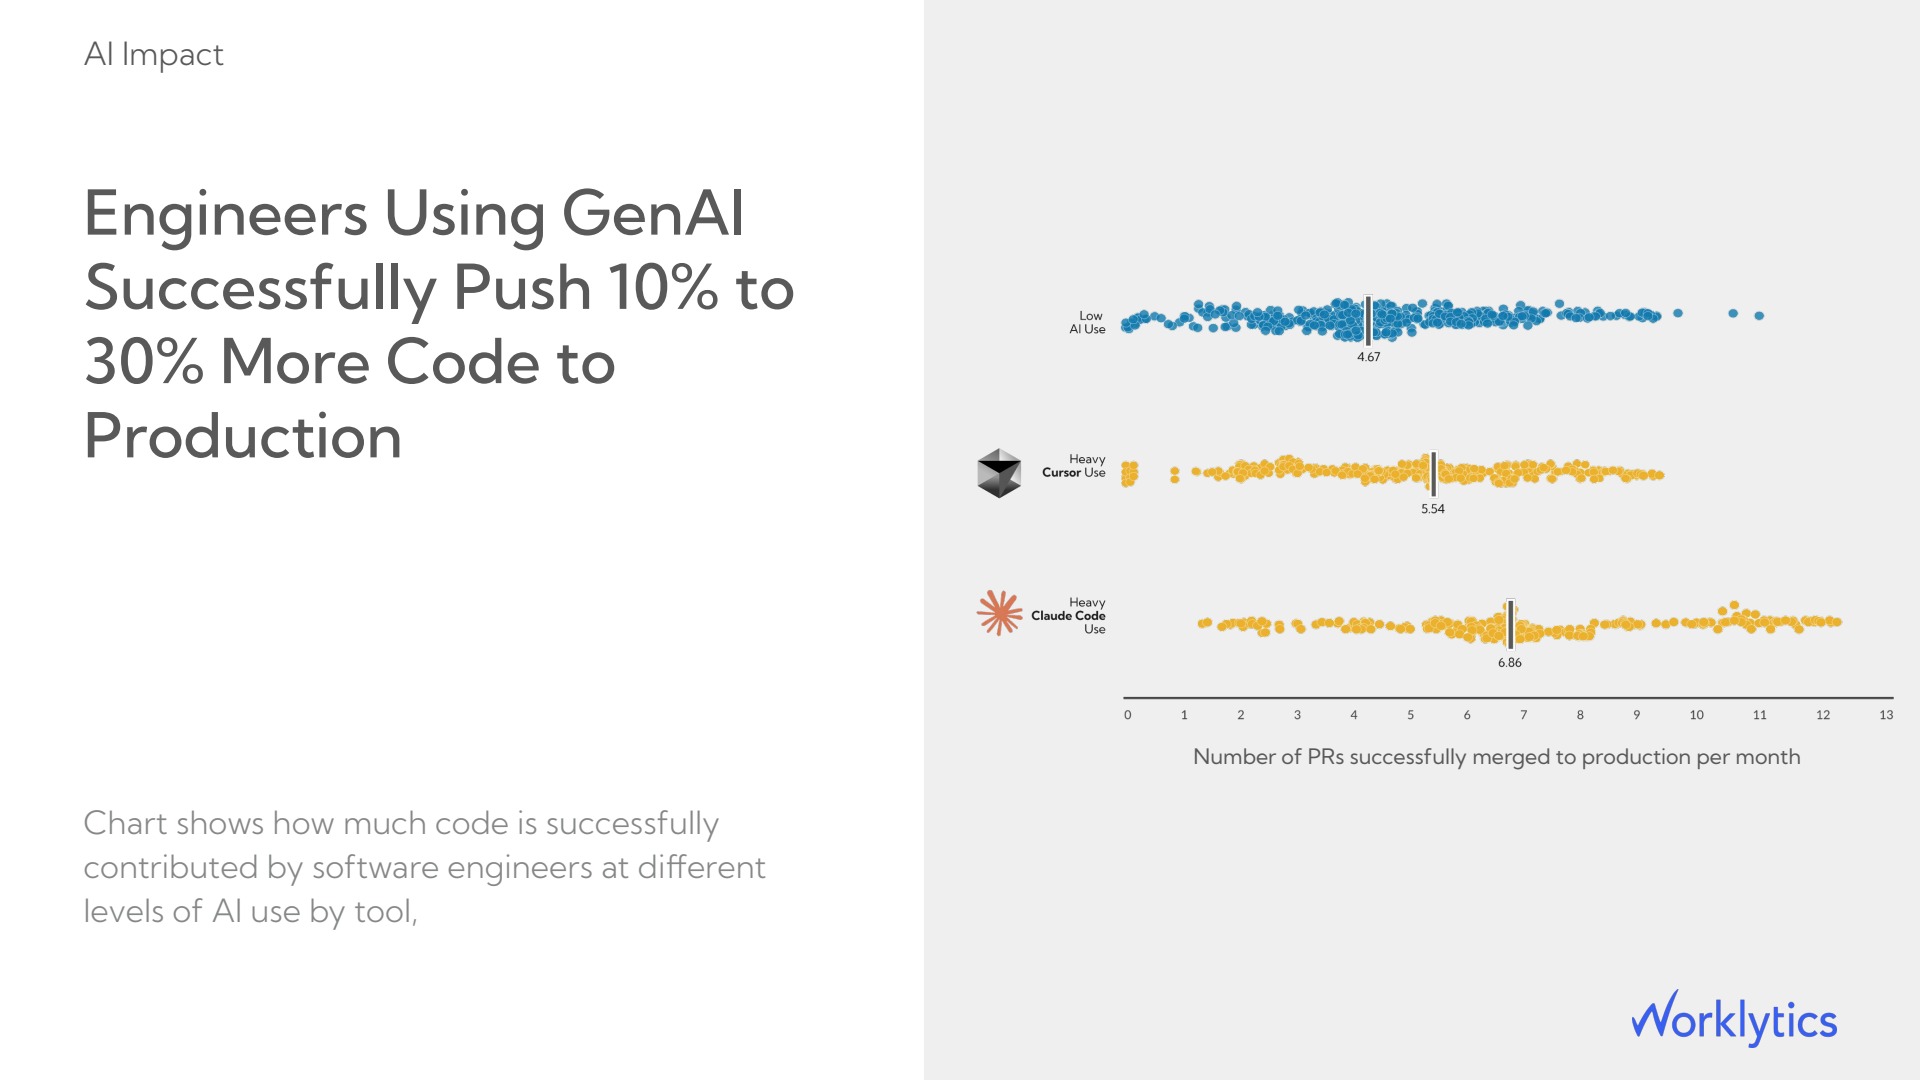
Two things make this a measurement rather than a vanity metric. First, it counts code that reached production, so it separates throughput from output. Second, Worklytics tracks PR review cycle time alongside volume, so when a tool raises commit counts but also lengthens review, that hidden cost surfaces instead of being scored as a win. Worklytics also observes AI tools shortening new-hire ramp, which you can quantify directly by measuring time-to-first-PR across AI-usage cohorts. Measuring developer productivity this way is what turns a Claude Code export into an engineering-velocity story.
Heavier AI usage changes how time is spent, and left unmanaged it can either protect focus time or add fragmentation. A usage export cannot see calendars or collaboration, so this reading needs a work graph rather than a log file.
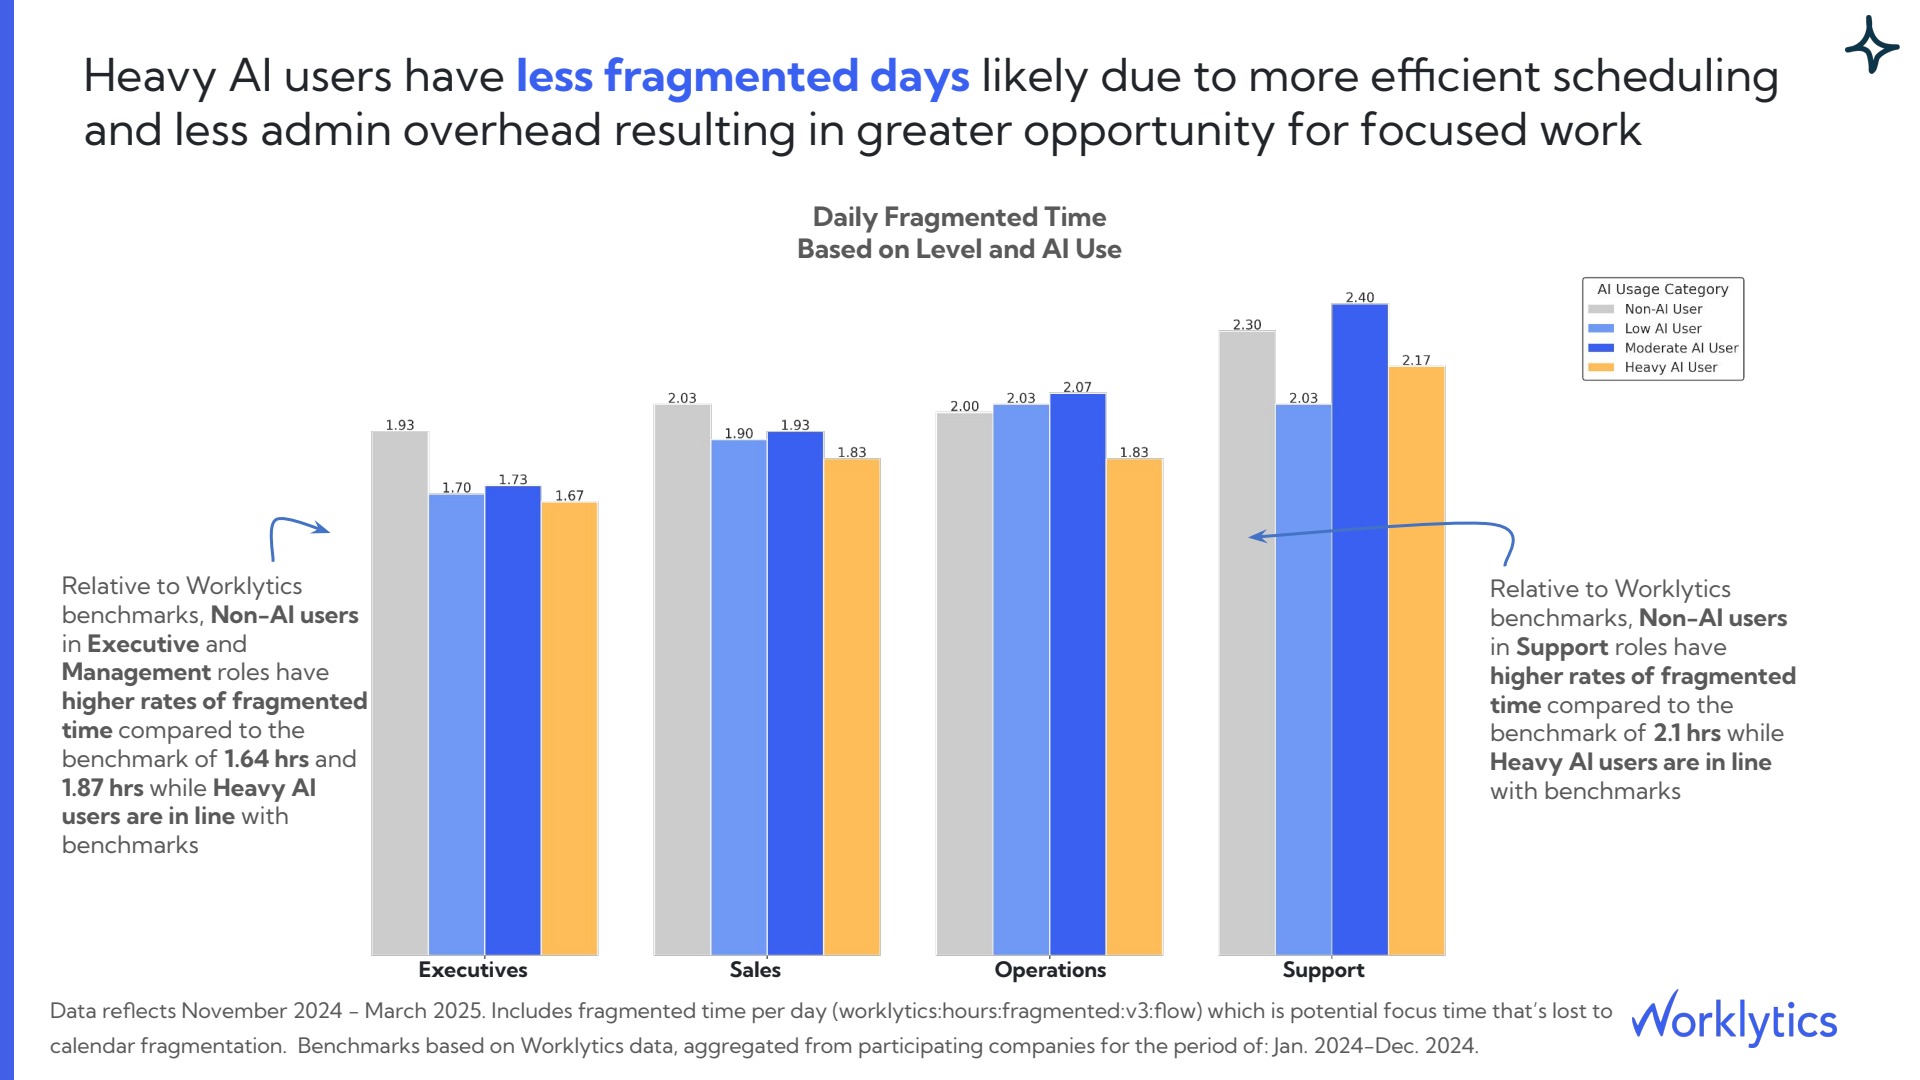
Less fragmentation points to more protected focus time and less admin overhead, which is a well-being signal a cost report will never contain. Worklytics also finds heavy AI users tend to have smaller working groups, about 9 strong collaborators versus 13 for non-AI users, and its organizational network analysis (a map of who collaborates with whom) shows whether that concentration is healthy focus or early isolation risk. Tracking engagement and well-being next to AI usage is how you catch the difference before it becomes attrition.
ROI is the value of outcomes produced minus the fully loaded cost. The Claude Code export supplies the cost side cleanly through estimated_cost.amount. The value side has to be modeled from time saved and output shipped, which is where a measurement platform earns its place.
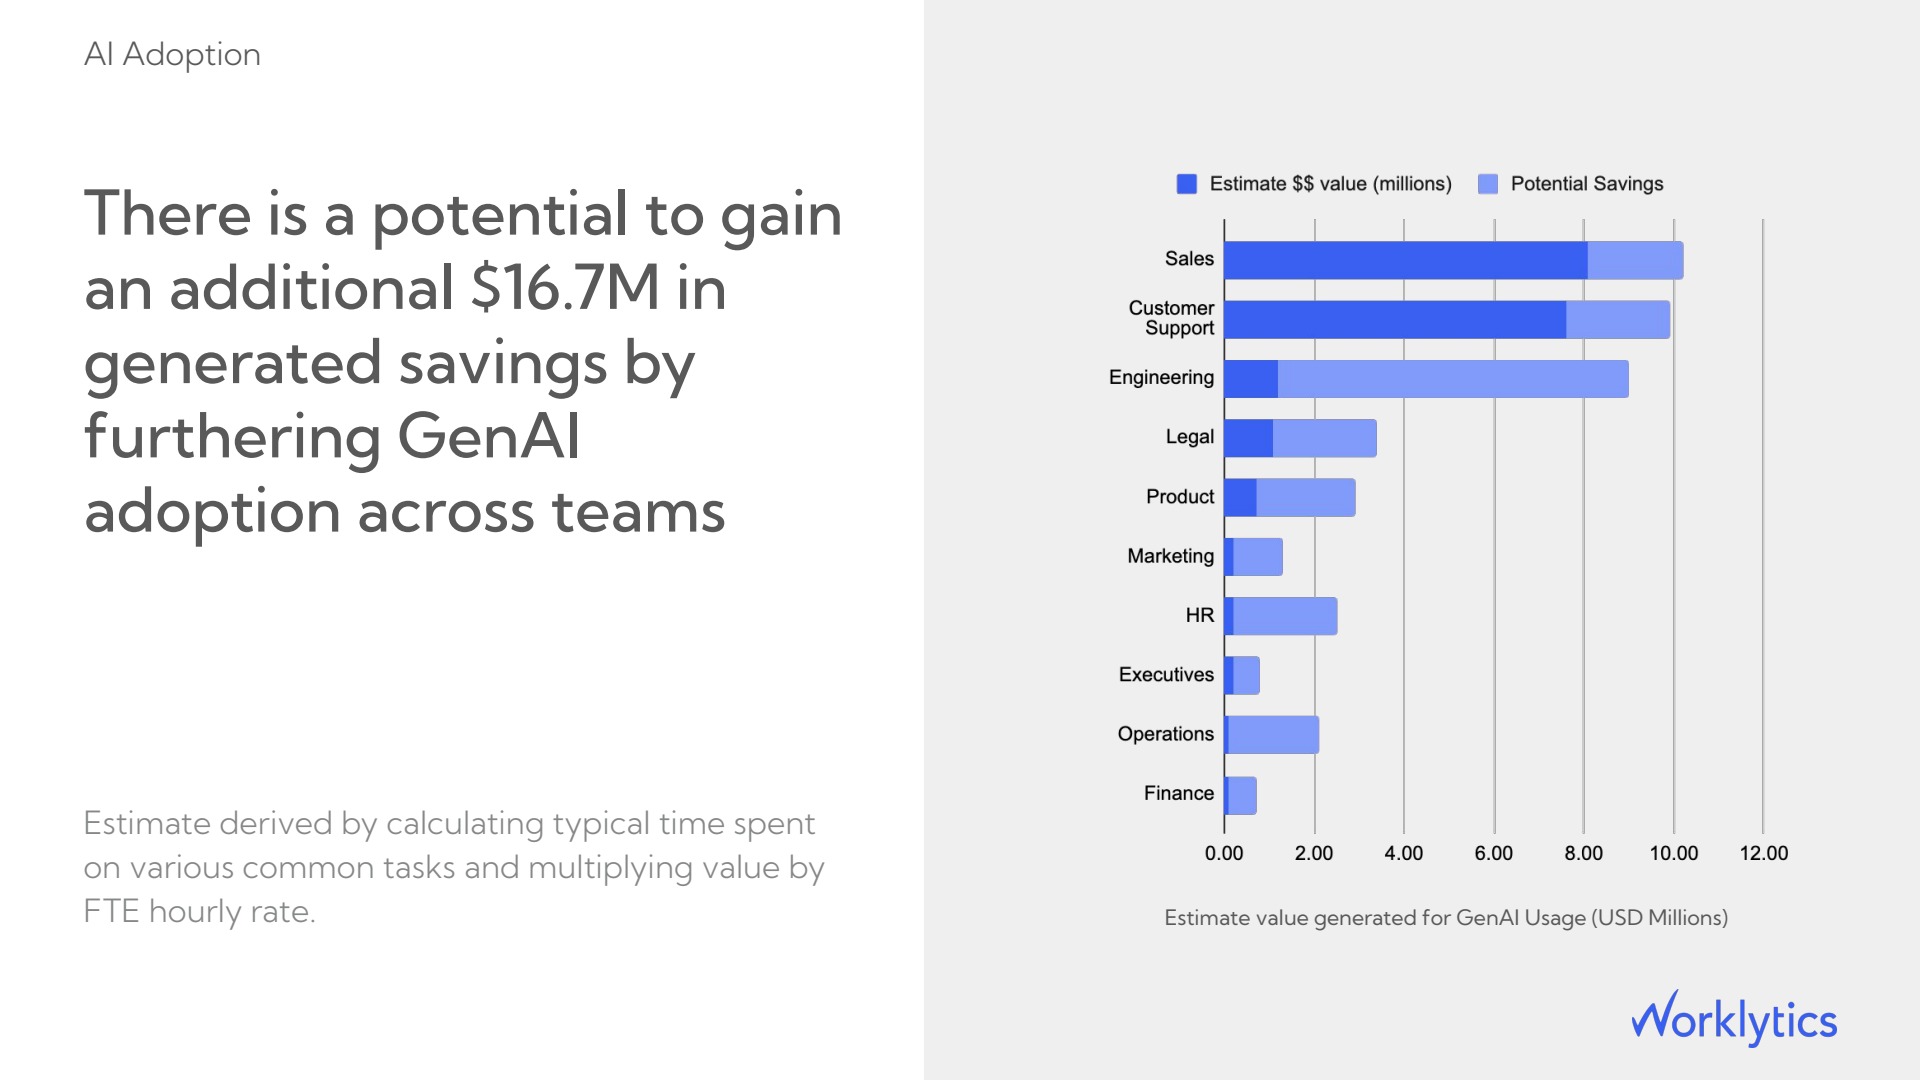
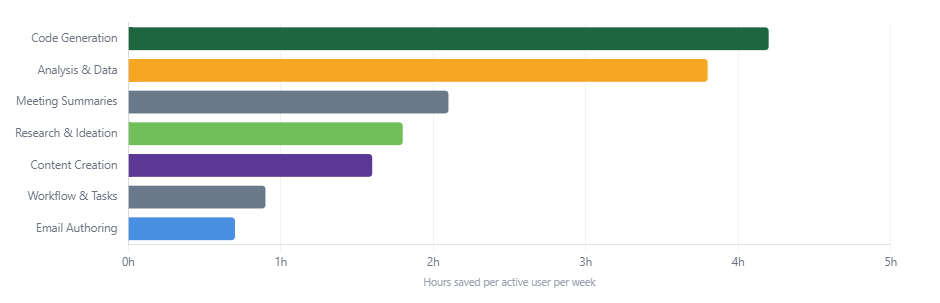
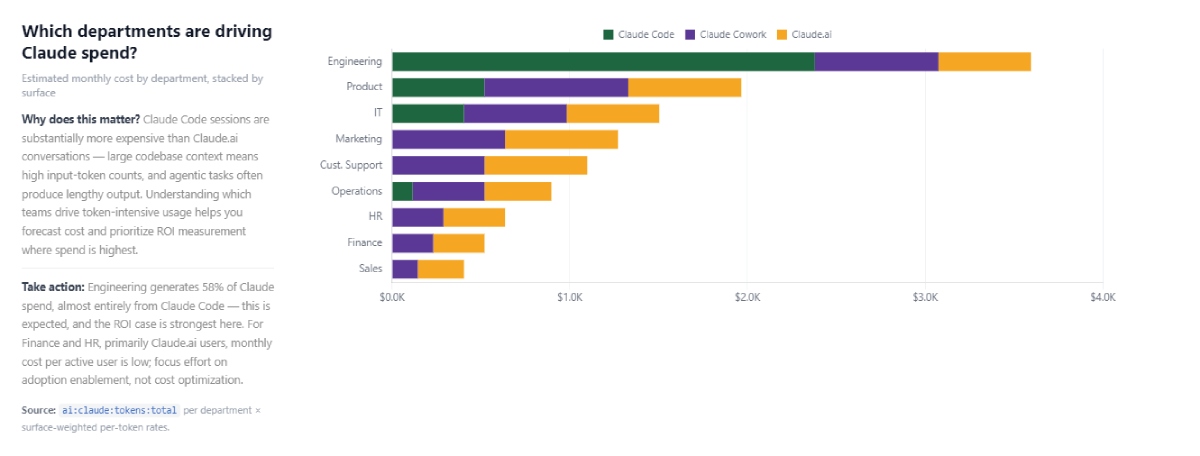
In a companion Worklytics view, code generation is the single largest time-saving task at roughly 4.2 hours per active user per week, which is the category Claude Code sits in. Because Worklytics ties spend to team and to task category, finance can allocate Claude Code cost to the teams and outcomes that drive it, the same way the department view shows Engineering at 58% of Claude spend. That closes the loop from export to accountability: the Measure AI platform reports cost and generated value side by side, so an AI budget line stops being a cost center and becomes a return you can defend.
How do I export Claude Code usage data?
Three ways. Read local JSONL logs at ~/.claude/projects/ (or run /cost in a session), stream metrics through OpenTelemetry, or pull org-wide daily records from the Claude Code Analytics Admin API.
Where are Claude Code session logs stored?
At ~/.claude/projects/<encoded-project-path>/<session-id>.jsonl, one JSON object per line. Claude Code deletes them after 30 days by default, so raise the cleanupPeriodDays setting or export them if you need longer history.
Does the Claude Code Analytics API include cost?
Yes. Each per-user daily record includes estimated_cost.amount in cents USD and a full token breakdown per model. It covers Claude Code on the Claude API only, not Bedrock, Vertex, or Foundry.
What is the difference between the /cost command and the Analytics API?
/cost reports one session on one machine in real time. The Analytics API returns aggregated daily activity for every user in the organization, including commits, PRs, and cost per model.
Can I export Claude Code usage without an API key?
Yes. The local JSONL logs and the ccusage CLI read usage directly from your machine with no API key and no network call. Org-wide export through the Admin API does require an Admin API key.
How do I measure Claude Code ROI, not just cost?
Join the exported cost to outcomes. Worklytics multiplies measured time saved by the fully loaded hourly cost of an employee and sets it against Claude Code spend, producing value per team and per task instead of a raw bill.
How is Worklytics different from the built-in Claude Code dashboard?
The built-in dashboard reports Claude usage only. Worklytics unifies Claude Code with Cursor, Copilot, ChatGPT, Gemini, and other tools, then adds the adoption, productivity, engagement, and ROI layers an export cannot produce on its own.
Can I export Claude Code usage data through Worklytics?
Yes. Worklytics connects to Claude and brings in the same session, token, commit, and cost basics, then adds dimensions like team, role, task type, and benchmarks. Read it in prebuilt dashboards, or stream the enriched dataset to your BI or warehouse with Worklytics Data Stream.
How is Claude Code usage export different from Claude Enterprise usage export?
They are two different surfaces. Claude Code usage export covers the developer CLI through local session logs, OpenTelemetry, and the Claude Code slice of the Analytics API. Claude Enterprise usage export covers claude.ai chat and Projects across the whole organization through a CSV report and the Enterprise Analytics API, which is walked through in how to export and analyze Claude Enterprise usage data. Use that guide for chat usage and this one for the coding side.



