


Return-to-office mandates are creating a perfect storm for HR and Corporate Real Estate leaders. While executives push for higher occupancy rates to justify real estate investments, employees resist with their feet—and their resignation letters. The challenge isn't just about getting bodies in seats; it's about predicting and preventing the talent exodus that often follows RTO announcements.
Traditional approaches rely on badge swipes and occupancy sensors, but these metrics tell you what happened, not what's about to happen. (5 Metrics That Matter More Than Badge Swipes) The solution lies in passive Organizational Network Analysis (ONA)—a data-driven approach that reveals the hidden collaboration patterns that predict employee flight risk before it's too late.
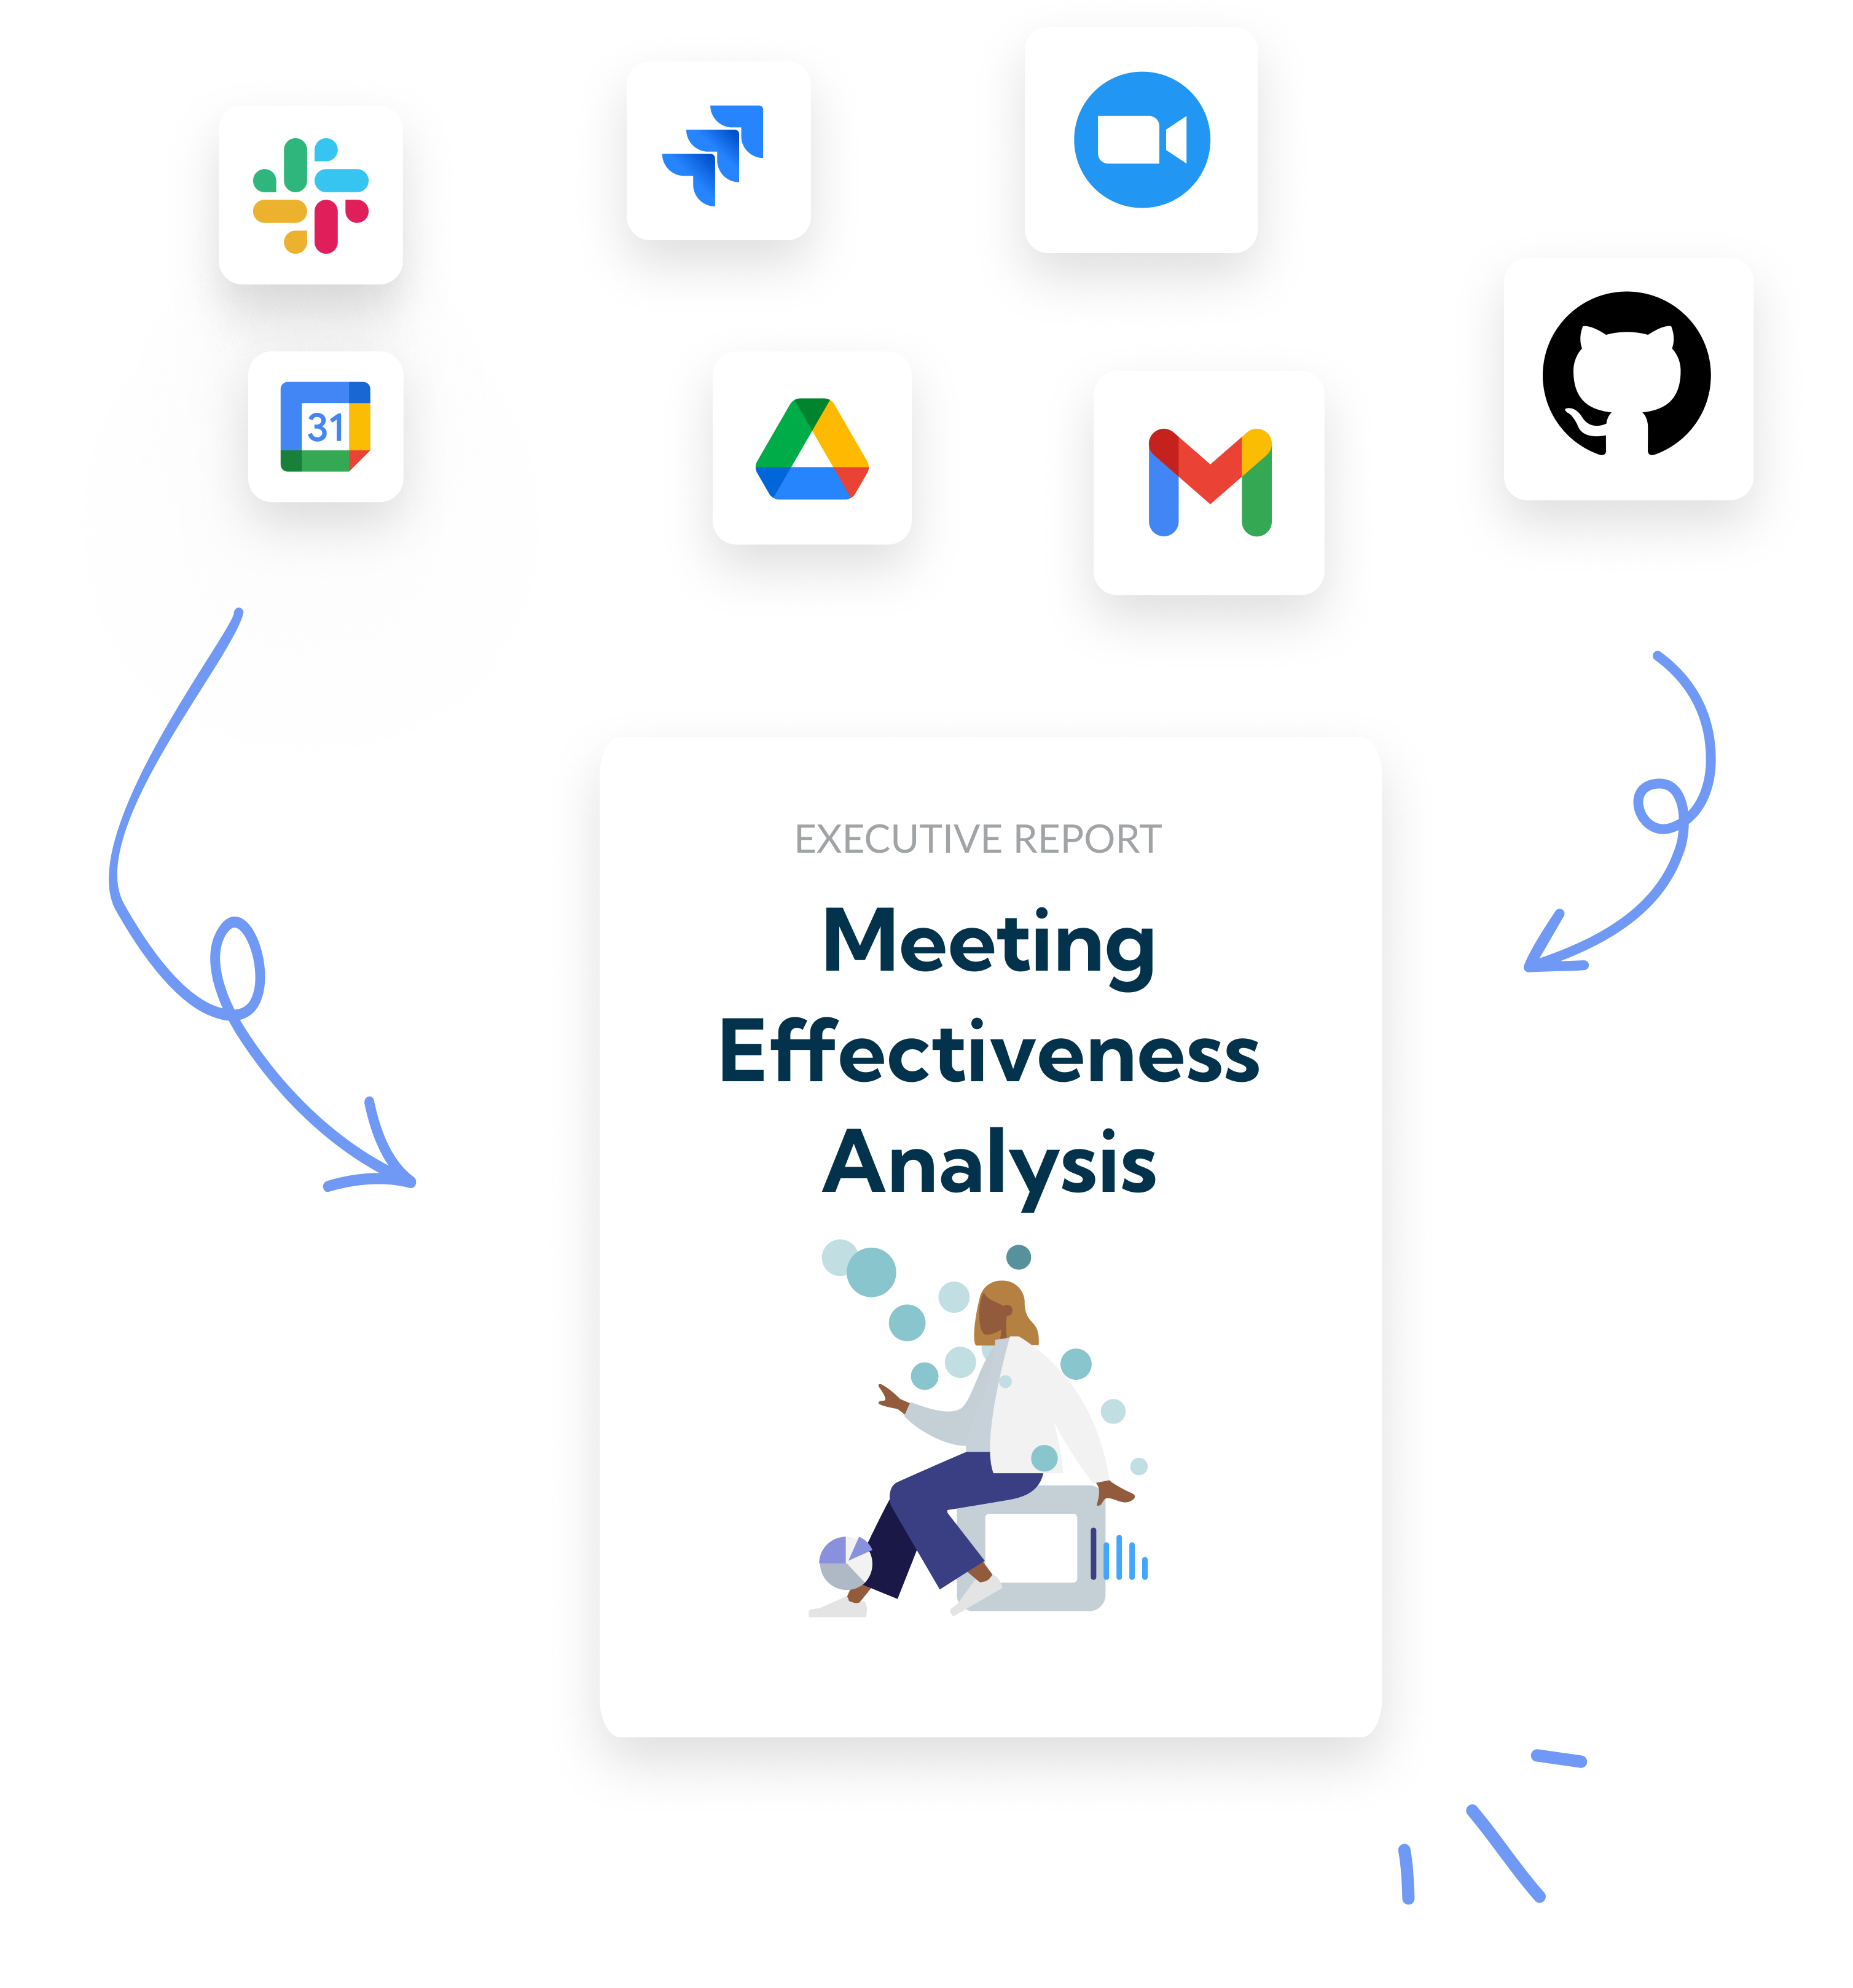
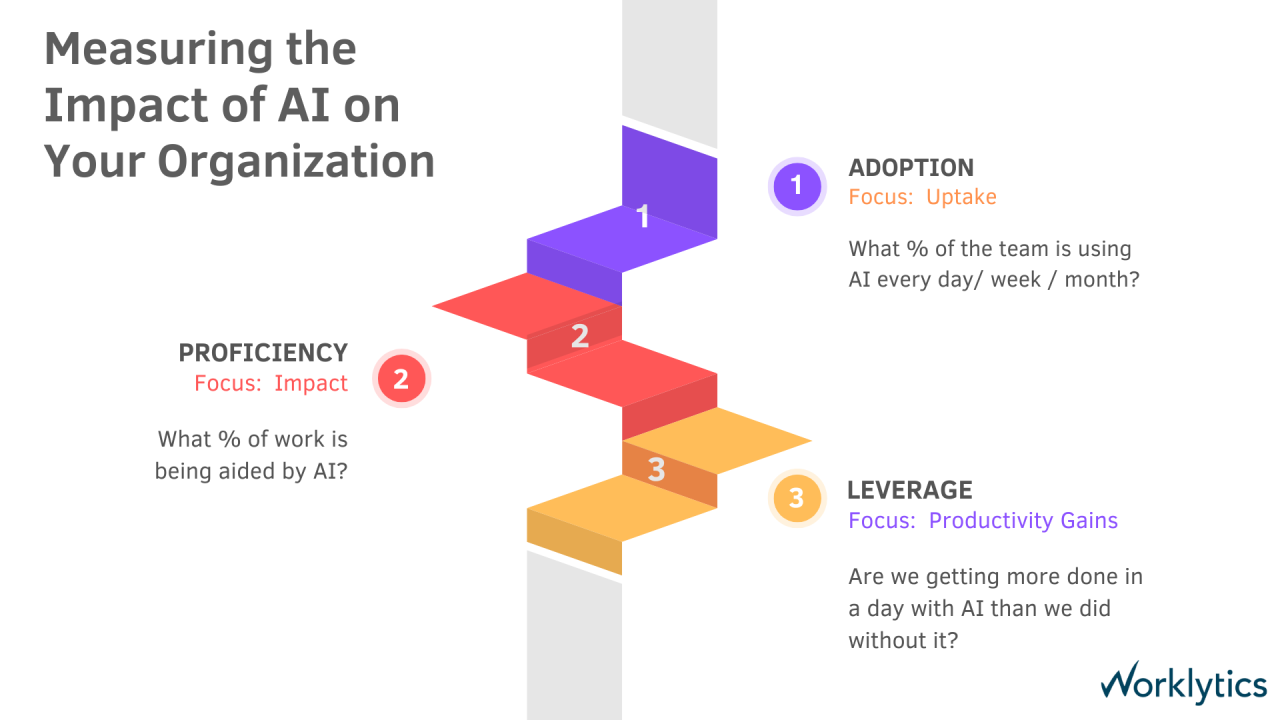
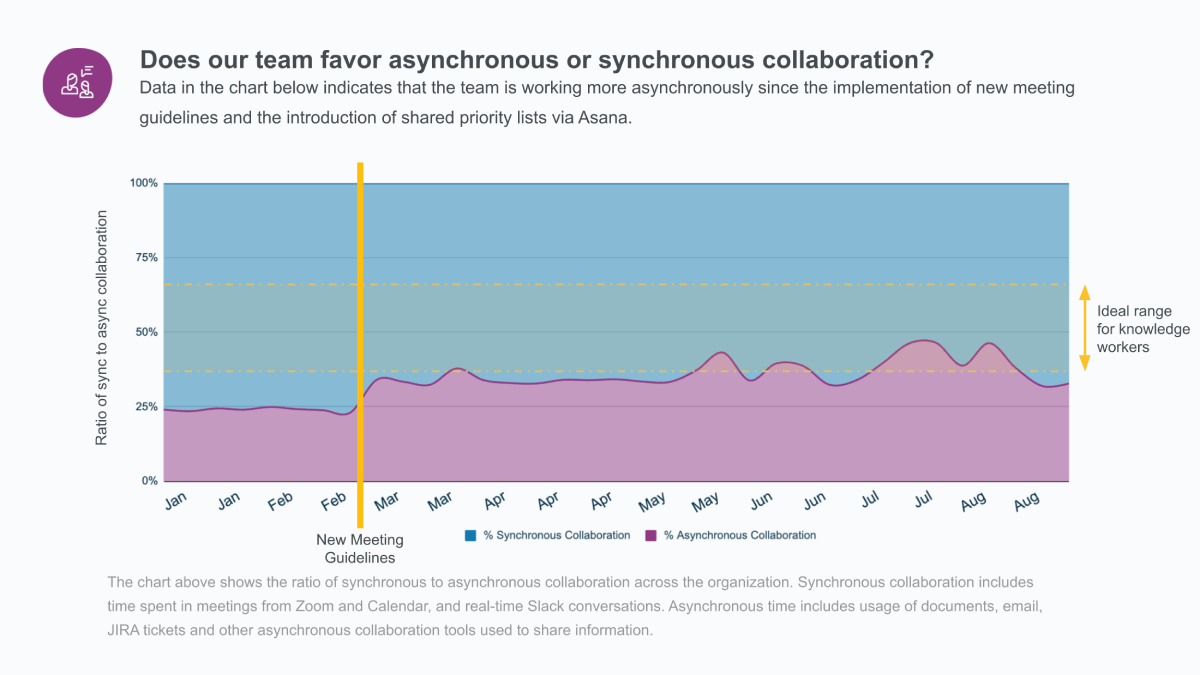
Passive Employee Listening measures work patterns in data from collaboration and communication tools, providing insights without relying on surveys that employees often ignore or game. (The Importance of Passive Listening) This approach analyzes metrics like hours in Zoom meetings per day, the size of collaborative networks, the frequency of 1-on-1 meetings with managers, and the amount of focus time people have outside of collaboration.
When companies announce return-to-office mandates, the immediate focus shifts to compliance rates and desk utilization. But the real damage happens in the shadows—through the gradual erosion of the collaborative networks that keep organizations functioning. Research shows that Individual Contributors (ICs) have seen approximately 40% fewer close collaborators when they've tried returning to the office. (Redesigning Your Spaces to Enable a Smooth Return to Office)
This isn't just about productivity; it's about retention. When employees lose their collaborative connections, they become more likely to leave. The challenge is that traditional HR metrics—engagement scores, performance ratings, even exit interviews—don't capture this network degradation until it's too late.
Most organizations measure RTO success through physical presence: badge swipes, desk bookings, and meeting room utilization. But onsite density is one of the single strongest predictors of employee resistance to returning to the office. (Why Your Employees Don't Want to Return to the Office) When offices feel overcrowded or when employees can't find the collaborative value they expect, resistance increases exponentially.
The metrics that matter more than badge swipes include network connectivity, meeting effectiveness, and cross-departmental collaboration patterns. (5 Metrics That Matter More Than Badge Swipes) These indicators reveal whether your RTO strategy is building the collaborative culture you want or inadvertently driving talent away.
Network shrinkage occurs when employees' collaborative circles contract, often as a precursor to disengagement and eventual departure. Passive ONA can detect this pattern by analyzing communication frequency, meeting participation, and cross-functional project involvement.
Key Metrics to Track:
• Collaborative Network Size: The number of unique colleagues an employee interacts with weekly
• Network Diversity: The spread of connections across departments and hierarchical levels
• Communication Frequency: The cadence of meaningful interactions (not just email CCs)
• Project Participation: Involvement in cross-functional initiatives and strategic projects
When these metrics decline simultaneously, it often signals that an employee is either overwhelmed by RTO requirements or has mentally checked out. Early detection allows for targeted interventions—perhaps adjusting their hybrid schedule, connecting them with new projects, or addressing specific concerns about office dynamics.
Meeting-location entropy measures the unpredictability and distribution of where collaborative work happens. High entropy indicates a healthy mix of in-person, virtual, and hybrid interactions. Low entropy—especially when skewed heavily toward virtual meetings despite RTO mandates—can signal resistance or practical barriers to office collaboration.
Entropy Indicators:
• Location Distribution: Percentage of meetings held in-office vs. remote vs. hybrid
• Spontaneous Interactions: Frequency of unscheduled, in-person conversations
• Meeting Effectiveness: Quality metrics like participation rates and follow-up actions
• Collaboration Timing: When productive work happens (during office hours vs. off-hours)
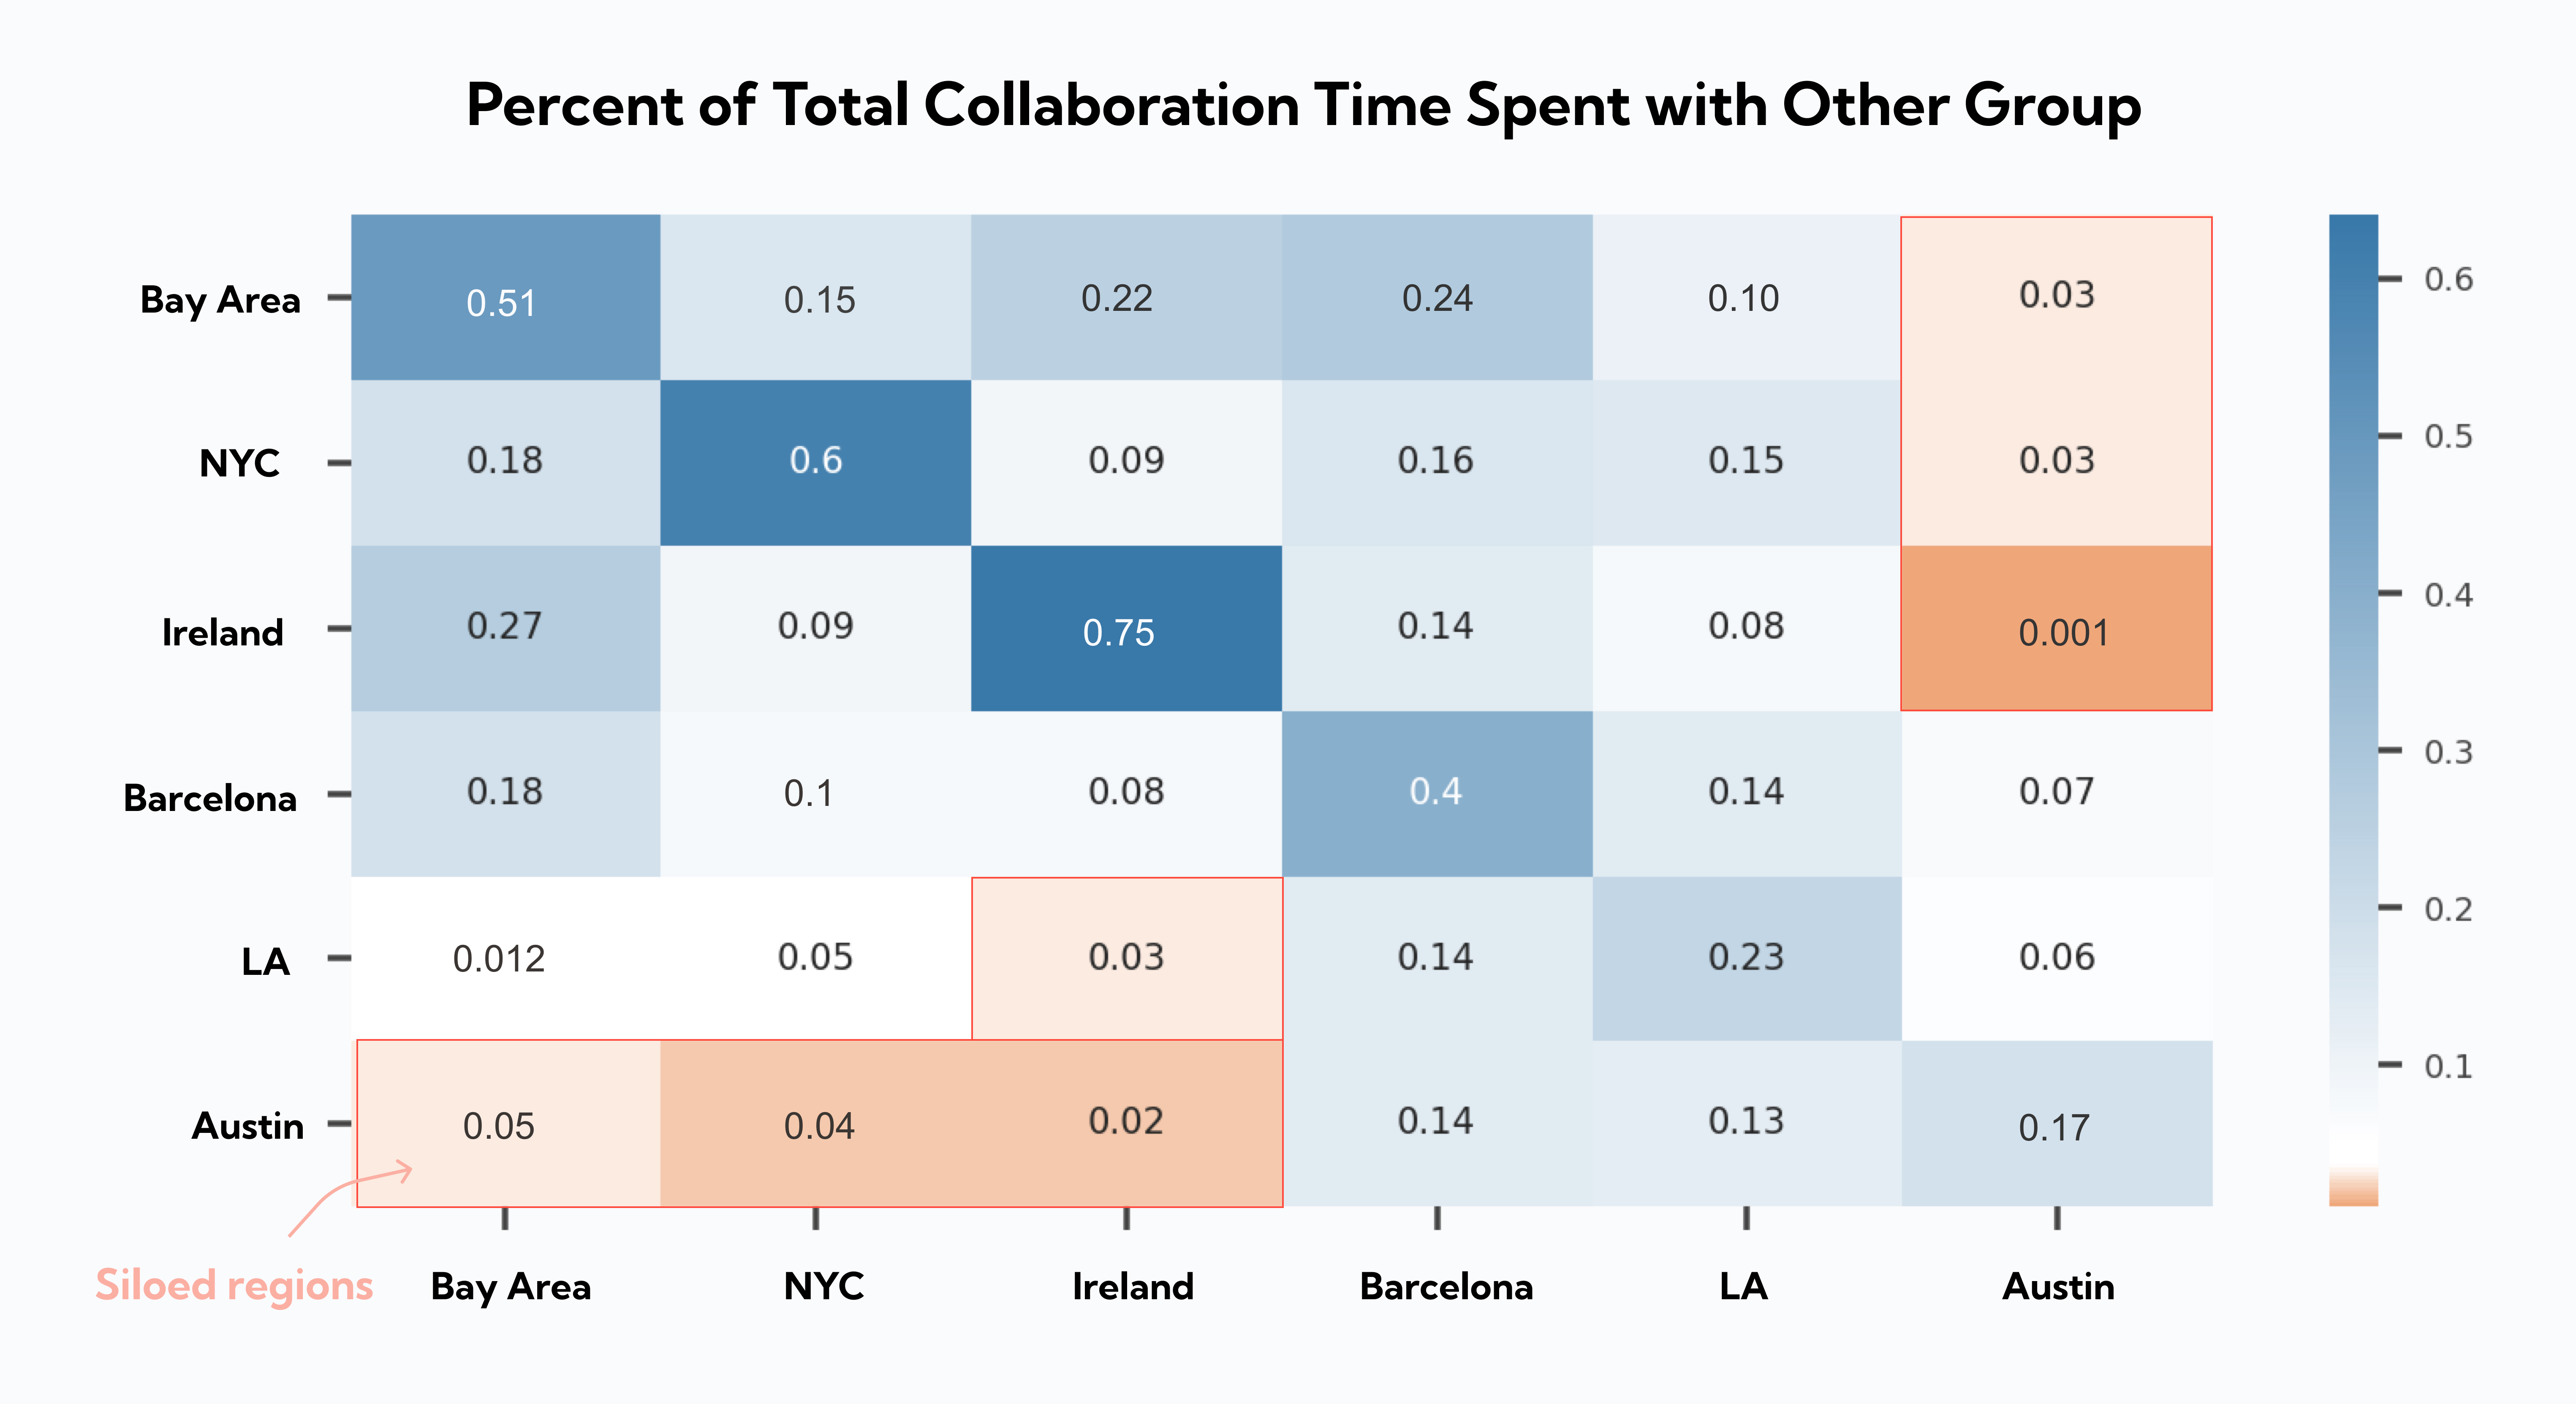
A healthy return-to-office would bump collaboration between departments up approximately 10%. (Redesigning Your Spaces to Enable a Smooth Return to Office) When entropy analysis shows that cross-departmental collaboration isn't improving despite increased office presence, it indicates that your space design or policies may be hindering the collaborative benefits you're trying to achieve.
Every organization has informal leaders—people whose opinions and behaviors disproportionately influence their peers. When these key influencers resist RTO mandates or show signs of disengagement, the ripple effects can be devastating. Passive ONA identifies these individuals and tracks their collaboration patterns to predict broader organizational sentiment.
Influence Metrics:
• Communication Centrality: How often others initiate contact with this person
• Meeting Leadership: Frequency of running or driving meeting agendas
• Cross-Department Bridging: Connections that span organizational silos
• Response Influence: How quickly others respond to their communications
Michael Arena found that bridging connections between departments deteriorated when companies first went remote at the start of the pandemic. (Could Workplace Nudges Help Fix ONA's Biggest Problem) Tracking whether your key influencers are rebuilding these bridges—or further withdrawing—provides early warning signals about the cultural impact of your RTO strategy.
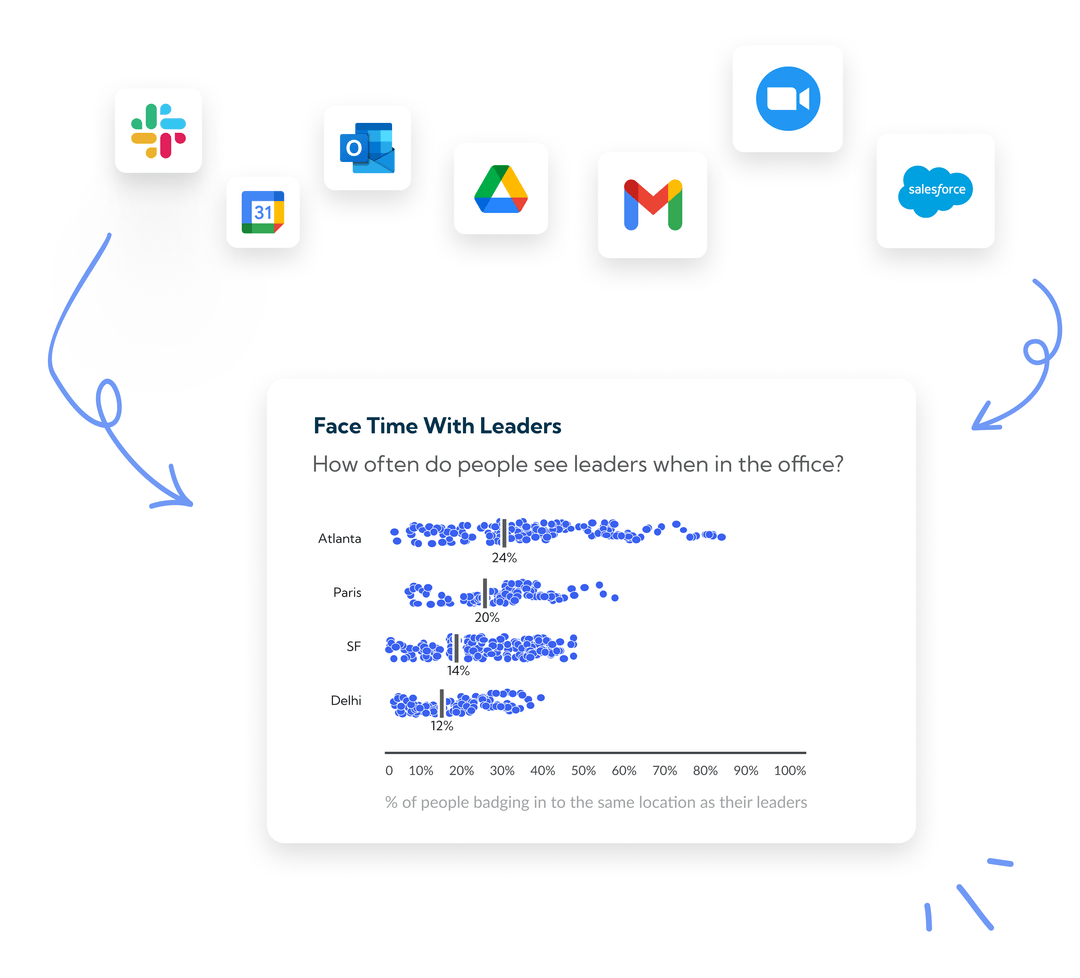
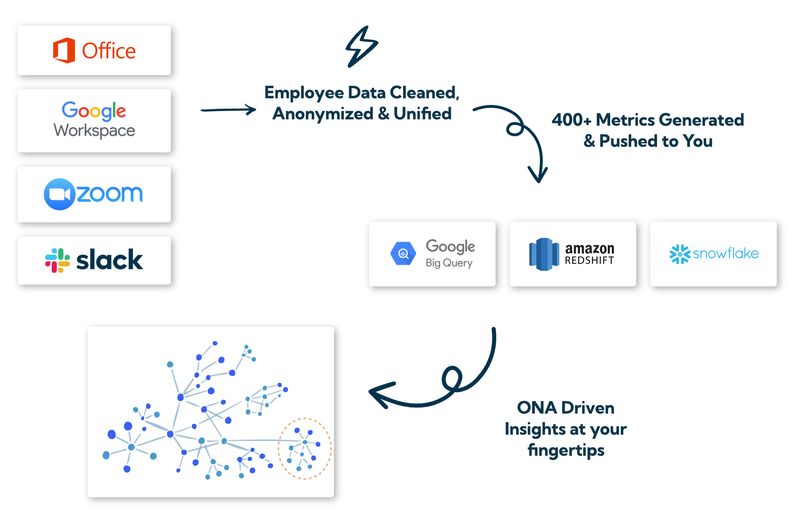
Building an effective passive ONA system requires integrating data from multiple collaboration platforms. Modern workplace analytics platforms can analyze team work and collaboration both remotely and in the office by connecting to over 25 common collaboration tools. (Worklytics Integrations)
Core Data Sources:
• Email and Calendar Systems: Meeting patterns, response times, and communication frequency
• Video Conferencing Platforms: Participation rates, meeting duration, and engagement metrics
• Collaboration Tools: Document sharing, project participation, and async communication
• Badge and Space Systems: Physical presence and space utilization data
• HR Systems: Organizational structure, role definitions, and performance data
The key is using machine learning to clean, de-duplicate, and standardize these datasets into actionable insights. (Get Started with Worklytics) This ensures that your ONA metrics reflect genuine collaboration patterns rather than data artifacts or system quirks.
Once you have clean data flowing, the next step is building predictive models that can flag retention risks before they become resignation letters. This involves establishing baseline metrics for healthy collaboration and setting thresholds that trigger intervention workflows.
Risk Scoring Framework:
Risk LevelNetwork ShrinkageMeeting EntropyInfluencer ProximityIntervention RequiredLow<10% declineHigh diversityStrong connectionsMonitor onlyMedium10-25% declineModerate skewWeakening tiesManager check-inHigh25-40% declineLow diversityIsolated patternsImmediate interventionCritical>40% declineVirtual-onlyDisconnectedRetention conversation
This framework allows you to prioritize interventions based on data rather than gut feelings. Employees in the "High" or "Critical" categories need immediate attention, while those in "Medium" might benefit from proactive manager engagement or schedule adjustments.
Data without action is just expensive reporting. The most successful passive ONA implementations include automated workflows that trigger specific interventions based on risk scores. These might include:
Automated Interventions:
• Manager Alerts: Notifications when direct reports show concerning patterns
• Schedule Optimization: Suggestions for hybrid schedules that maximize collaborative value
• Project Assignments: Recommendations for cross-functional projects that rebuild networks
• Space Recommendations: Guidance on which office spaces or days optimize collaboration
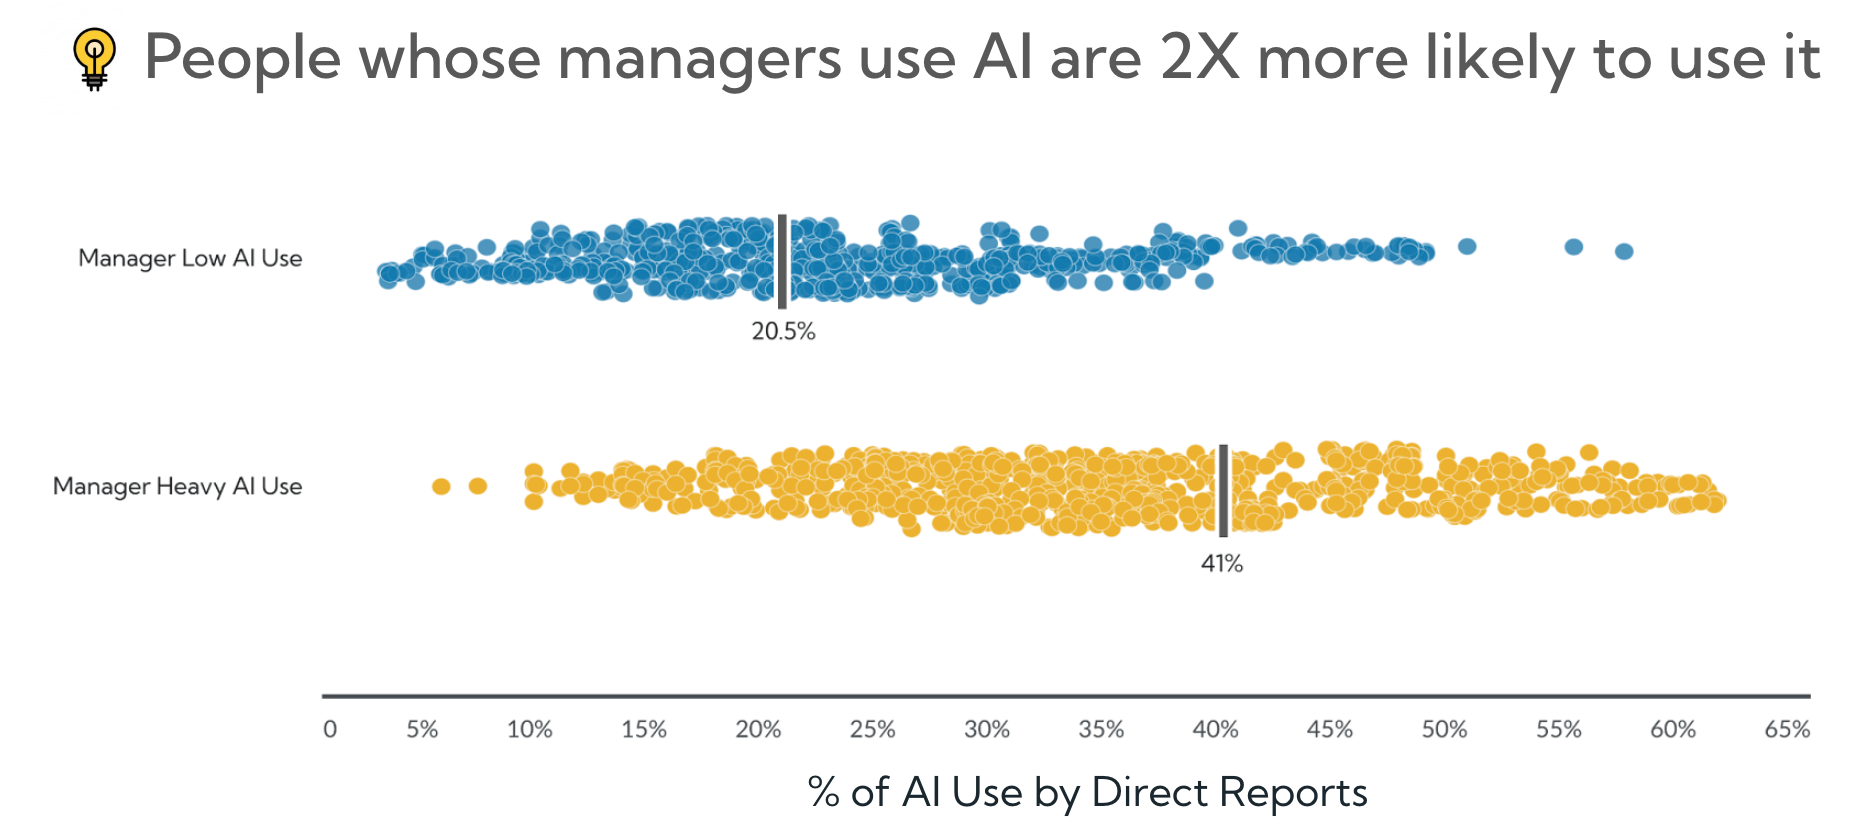
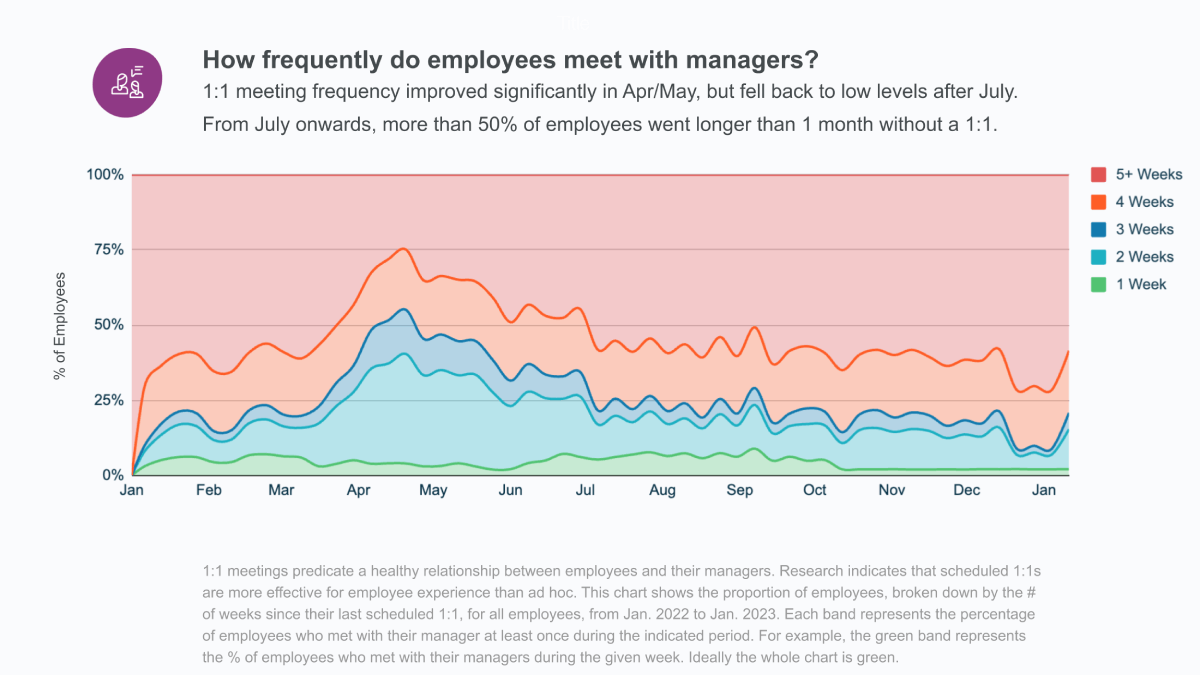
Managers having more frequent 1-on-1s can lead to a 20% higher score in eNPS. (The Importance of Passive Listening) When your ONA system detects network shrinkage, automatically scheduling additional manager touchpoints can prevent small issues from becoming resignation triggers.
While traditional HR analytics focus on lagging indicators (turnover rates, exit survey results), passive ONA reveals leading indicators that predict attrition weeks or months in advance. This predictive capability is crucial for RTO planning because it allows you to adjust policies before losing critical talent.
Leading Indicators by Timeline:
4-6 Weeks Before Departure:
• Dramatic reduction in cross-departmental meetings
• Shift from meeting leadership to passive participation
• Decreased response rates to collaborative requests
• Reduced engagement in strategic planning sessions
2-4 Weeks Before Departure:
• Minimal new project initiation or ownership
• Shortened meeting participation (joining late, leaving early)
• Reduced informal communication (Slack, Teams chat)
• Increased focus on documentation and knowledge transfer
1-2 Weeks Before Departure:
• Withdrawal from future planning discussions
• Reduced calendar availability for new meetings
• Shift to primarily one-on-one communications with manager
• Decreased participation in team social interactions
Not all employees respond to RTO mandates the same way. Passive ONA allows you to segment your workforce into cohorts based on collaboration patterns and track how different groups respond to office requirements.
High-Risk Cohorts:
• Remote-First Hires: Employees hired during fully remote periods who lack office relationships
• Cross-Timezone Collaborators: Workers whose key partnerships span multiple time zones
• Deep Work Specialists: Roles requiring extended focus time that office environments may disrupt
• Caregivers: Employees whose personal responsibilities benefit from flexible schedules
Low-Risk Cohorts:
• Relationship-Dependent Roles: Sales, customer success, and partnership roles that benefit from face-to-face interaction
• Mentorship-Heavy Positions: Senior roles involved in training and developing others
• Creative Collaborators: Teams whose work benefits from spontaneous brainstorming and ideation
• Office-Tenure Veterans: Long-term employees with established office relationships and routines
By tracking these cohorts separately, you can tailor your RTO approach to minimize risk while maximizing collaborative benefits. For example, you might offer more flexible arrangements to high-risk cohorts while encouraging more office time for roles that genuinely benefit from in-person collaboration.
Traditional RTO success metrics focus on physical presence, but passive ONA enables measurement of collaboration quality—the real reason organizations want people back in the office.
Collaboration Quality KPIs:
MetricCalculationTarget RangeBusiness ImpactNetwork DensityConnections per employee / Total possible connections15-25%Innovation and knowledge sharingCross-Department BridgingInter-department connections / Total connections30-40%Silos reduction and alignmentMeeting Effectiveness Score(Follow-up actions + Decisions made) / Meeting hours70-85%Productivity and decision speedSpontaneous Interaction RateUnscheduled conversations / Total interactions20-30%Serendipitous collaborationFocus Time ProtectionUninterrupted work blocks > 2 hours / Total work time40-60%Deep work and productivity
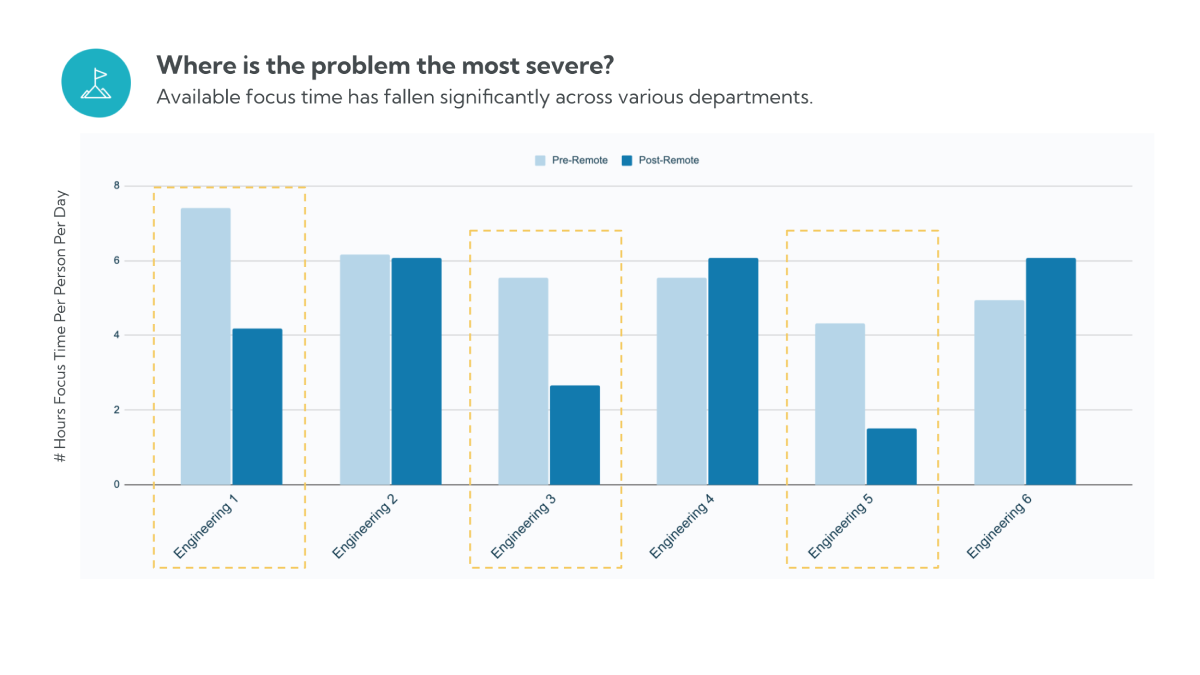
Knowledge workers with less than 3.5 hours of focus time report having more difficulty getting things done. (4 New Ways to Model Work) Your RTO strategy should improve collaboration without destroying the focus time that enables individual productivity.
The ultimate test of your passive ONA system is its ability to predict and prevent unwanted turnover. Track these metrics to validate your model's effectiveness:
Prediction Accuracy Metrics:
• True Positive Rate: Percentage of predicted departures that actually occur
• False Positive Rate: Percentage of retention alerts that don't result in departures
• Intervention Success Rate: Percentage of high-risk employees retained after intervention
• Time to Prediction: How far in advance the system identifies at-risk employees
A well-tuned system should achieve 70-80% accuracy in predicting departures 4-6 weeks in advance, with intervention success rates above 60% for employees who receive targeted support.
To justify investment in passive ONA capabilities, calculate the ROI based on retention improvements and space optimization:
Cost Savings:
• Prevented Turnover: (Average replacement cost × Retained employees) - System cost
• Space Optimization: (Reduced real estate costs × Improved utilization) - Infrastructure investment
• Productivity Gains: (Improved collaboration efficiency × Employee hours) - Implementation time
Typical ROI Ranges:
• Year 1: 150-250% ROI from prevented turnover alone
• Year 2+: 300-500% ROI including space optimization and productivity gains
• Payback Period: 6-12 months for most implementations
Week 1-2: Data Audit and Integration Planning
• Inventory existing collaboration tools and data sources
• Assess data quality and integration requirements
• Establish privacy and compliance frameworks
• Define success metrics and baseline measurements
Week 3-4: Platform Selection and Setup
• Evaluate workplace analytics platforms that support passive ONA
• Configure data connections and ensure proper anonymization
• Set up initial dashboards and reporting structures
• Train core team on platform capabilities and interpretation
Workplace insights platforms can connect to existing data warehouses or visualization tools, making integration with existing business intelligence infrastructure straightforward. (Get Started with Worklytics)
Week 5-6: Pilot Group Selection
• Identify 2-3 representative departments for initial testing
• Establish baseline collaboration patterns and network maps
• Begin collecting passive ONA metrics and validating data quality
• Create initial risk scoring models based on pilot data
Week 7-8: Intervention Testing
• Implement basic intervention workflows for pilot groups
• Test manager alert systems and response protocols
• Gather feedback on dashboard usability and metric relevance
• Refine risk thresholds based on pilot results
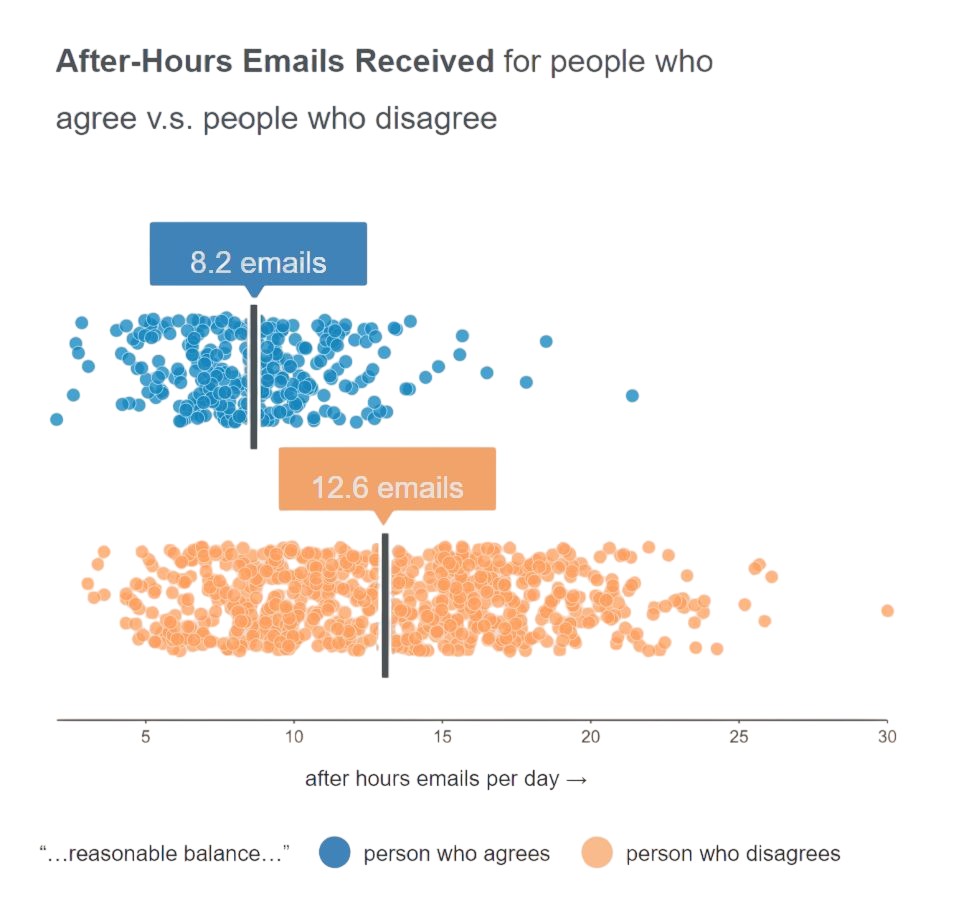
Improving workday hours via communicating guidelines on work-life balance and managers avoiding after-hours communications can lead to a 15% higher eNPS score. (The Importance of Passive Listening) Use your pilot to test which interventions have the highest impact on both collaboration and employee satisfaction.
Week 9-10: Organization-Wide Rollout
• Extend passive ONA monitoring to all departments
• Deploy automated intervention workflows
• Train managers on interpreting ONA insights and taking action
• Establish regular reporting cadences for leadership
Week 11-12: Optimization and Scaling
• Analyze initial results and refine prediction models
• Expand intervention options based on what works
• Integrate ONA insights into broader HR and real estate planning
• Document best practices and lessons learned
Training employees on best practices around meeting habits and blocking focus time can lead to a 33% higher score around employees feeling more productive. (The Importance of Passive Listening) Your full deployment should include not just monitoring but also guidance that helps employees optimize their own collaboration patterns.
Passive ONA doesn't just predict who might leave—it also reveals how space should be designed to maximize collaborative value. By analyzing meeting patterns, spontaneous interactions, and focus time requirements, you can optimize office layouts for actual work patterns rather than theoretical ideals.
Space Optimization Insights:
• Collaboration Zones: Where and when teams naturally gather for productive work
• Focus Areas: Spaces that support deep work without interruption
• Flexible Zones: Areas that can adapt to changing collaboration needs throughout the day
• Social Spaces: Informal areas that facilitate the relationship-building that drives retention
Workplace analytics can provide visibility into how physical and digital workspaces are used, supporting strategic decisions in areas like space utilization and occupancy planning. (Worklytics Company Description)
As your passive ONA system matures, machine learning can suggest increasingly sophisticated interventions based on what has worked for similar employees in similar situations.
AI-Enhanced Interventions:
• Personalized Schedule Optimization: AI suggests optimal hybrid schedules based on individual collaboration patterns
• Project Matching: Algorithms recommend cross-functional projects that rebuild weakened networks
• Mentorship Pairing: AI identifies potential mentoring relationships that could re-engage at-risk employees
• Team Composition: Suggestions for team changes that optimize both collaboration and retention
With over 30% of workers potentially seeing half their tasks changed by AI, the integration of AI-powered insights into workforce planning becomes increasingly critical. (12 Highest Impact KPIs 2025 Manager Scorecard Benchmarks)
Passive ONA can power "workplace nudges"—gentle suggestions that help employees optimize their own collaboration patterns without feeling micromanaged.
Effective Nudge Strategies:
• Meeting Optimization: Suggestions for reducing meeting load while maintaining collaboration quality
• Network Expansion: Recommendations for connecting with colleagues who could enhance their work
• Focus Time Protection: Alerts when calendar patterns threaten deep work capabilities
• Collaboration Balance: Guidance on balancing individual productivity with team engagement
Workplace nudges could help fix ONA's biggest problem by making network insights actionable at the individual level. (Could Workplace Nudges Help Fix ONA's Biggest Problem) Rather than just measuring collaboration patterns, nudges help employees actively improve them.
Return-to-office mandates don't have to be a zero-sum game between executive occupancy targets and employee satisfaction. Passive ONA provides the missing link—predictive insights that allow you to optimize for both physical presence and collaborative value while preventing the talent exodus that often accompanies poorly executed RTO strategies.
The organizations that succeed in 2025 will be those that move beyond badge swipes and occupancy sensors to understand the deeper patterns of how work actually gets done. (5 Metrics That Matter More Than Badge Swipes) By tracking network shrinkage, meeting-location entropy, and key-influencer proximity, you can predict retention risks weeks in advance and take targeted action to address them.
The three-pillar framework outlined here—network shrinkage detection, meeting-location entropy analysis, and key-influencer proximity tracking—provides a comprehensive approach to de-risking your RTO strategy. Combined with predictive analytics and automated intervention workflows, passive ONA transforms return-to-office from a compliance exercise into a strategic advantage.
As hybrid work continues to evolve, the organizations with the best data on how collaboration actually happens will be the ones that can design policies, spaces, and experiences that truly serve both business objectives and employee needs. (Return to Office RTO Data Analytics Reporting) The question isn't whether your employees will return to the office—it's whether they'll want to stay once they get there.
Start with the 90-day implementation roadmap, focus on the metrics that predict retention rather than just measure presence, and use the insights to create a workplace that people choose rather than one they simply endure. The data is there—the question is whether you'll use it to build the future of work or just measure its decline.
Passive Organizational Network Analysis (ONA) uses digital collaboration data to map workplace relationships and communication patterns without surveys. It helps predict which employees are at highest risk of leaving when RTO mandates are implemented by analyzing their network connections and collaboration intensity. This allows HR leaders to proactively address retention risks before they become resignations.
Badge swipes only measure physical presence, not productivity or collaboration quality. Research shows that Individual Contributors see approximately 40% fewer close collaborators when returning to office, indicating that mere attendance doesn't guarantee effective teamwork. Passive ONA provides deeper insights into actual work patterns, relationship strength, and collaboration effectiveness that badge data cannot capture.
Passive listening through digital collaboration tools reveals employee sentiment and engagement patterns without intrusive surveys. It identifies early warning signs of disengagement, such as reduced communication frequency or weakened network connections, allowing leaders to intervene before employees decide to leave. This approach provides continuous, real-time insights into how RTO policies are actually affecting team dynamics and individual satisfaction.
Critical metrics include collaboration network density, cross-functional interaction frequency, meeting effectiveness scores, and digital work intensity patterns. These metrics reveal whether employees are actually engaging productively when in office, not just showing up. Workday intensity, measured as time spent on digital work as a percentage of overall workday span, helps identify optimal hybrid schedules that maximize both presence and productivity.
Hybrid work has elongated the workday span and changed work intensity patterns, with employees often being more productive during non-traditional hours. Digital collaboration tools show that effective teamwork can happen across different time zones and schedules. RTO policies that ignore these evolved work patterns risk disrupting established productive rhythms and driving away top performers who have adapted to flexible arrangements.
AI tools can process vast amounts of collaboration data to identify patterns invisible to human analysis, such as predicting which teams will struggle most with RTO transitions. With over 30% of workers expecting AI to change half their tasks, understanding how AI adoption varies between remote and in-office work becomes crucial for RTO planning. Machine learning can clean and standardize collaboration datasets to provide accurate insights for evidence-based RTO strategies.
1. https://worklytics.co/blog/4-new-ways-to-model-work
2. https://worklytics.co/get-started
3. https://worklytics.co/integrations
4. https://worklytics.co/resources/12-highest-impact-kpis-2025-manager-scorecard-benchmarks
6. https://www.worklytics.co/blog/could-workplace-nudges-help-fix-onas-biggest-problem
7. https://www.worklytics.co/blog/redesigning-your-spaces-to-enable-a-smooth-return-to-office
8. https://www.worklytics.co/blog/the-importance-of-passive-listening
9. https://www.worklytics.co/blog/why-your-employees-dont-want-to-return-to-the-office
10. https://www.worklytics.co/hr-department-data-analytics-software
11. https://www.worklytics.co/return-to-office-rto-data-analytics-reporting-worklytics


