Improve Your Organization's Productivity with Worklytics

Learn How

Generative AI and Workforce Productivity: What the Research Shows and How to Measure It

Why generative AI speeds up single tasks but barely moves company output, and how to measure its real productivity impact in your own teams.
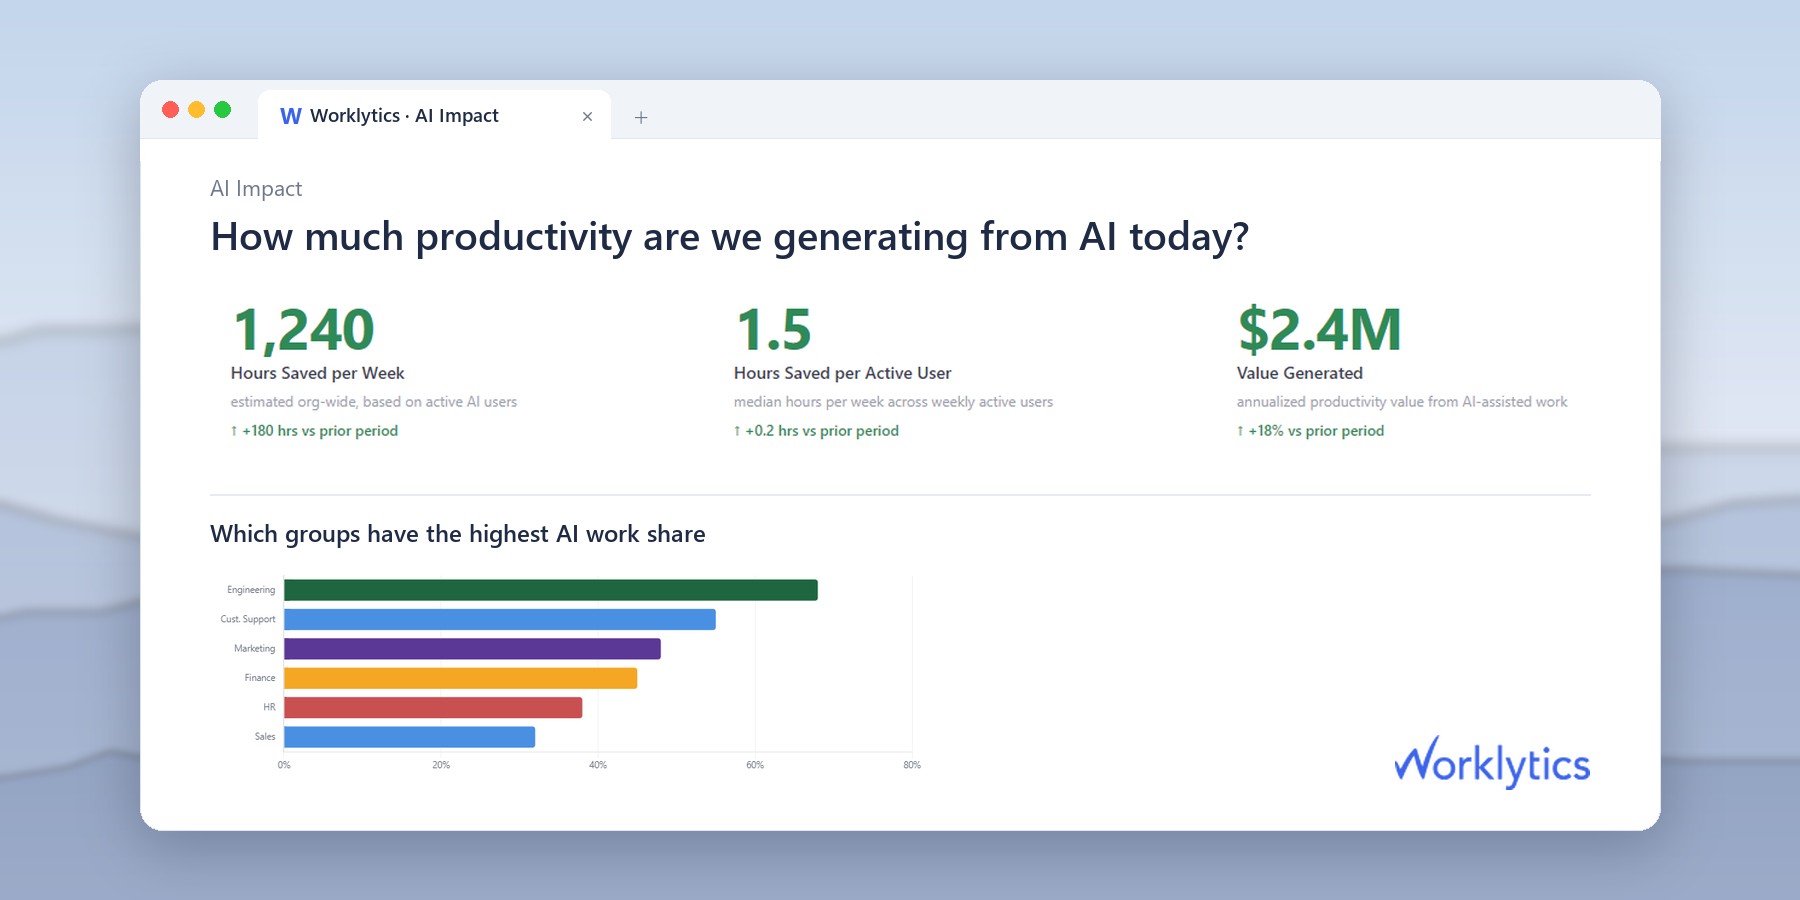
Worklytics sample report in a browser window: hours saved per week, hours saved per active AI user, value generated, and AI work share by team.

TLDR: Generative AI makes specific tasks faster, but the gain shrinks a lot by the time it reaches company-wide output. Measure it on your own work instead of trusting averages:

  • Why big task gains look small overall: a task gain is diluted by how much of the week the task takes, how many people use AI, and how much saved time becomes output. In a made-up example below, 40% faster drafting ends up as about 1% more team output.
  • What to measure: two or three countable tasks per team, a baseline before rollout, and a similar team that has not started yet.
  • What to check: quality and rework as well as speed, and a range of results instead of one number.
  • What usage data adds: who uses AI, how often and for how much of the workday. It shows where to look, not whether output improved.

Your AI vendor's dashboard says each user saves several hours a week. Your finance team sees the same headcount producing about the same output. Both can be true at once.

This guide is for HR, people analytics, operations and IT leaders who need to know whether generative AI is paying off. It covers what the research agrees on, why task gains shrink at company level, and how to measure the effect in your own teams.

What the research agrees on

Studies of generative AI at work fall into two groups, and they point in different directions.

  • Controlled studies of single tasks find real gains. When some people get AI and similar people do not, the AI group usually finishes writing, customer support and coding tasks faster, often with equal or better quality.
  • Newer and less experienced workers tend to gain the most. AI hands them some of what experienced colleagues already know, so the gap between workers narrows.
  • Results are uneven. On some tasks AI helps little, and on work people already know well it can slow them down, because checking and fixing its output takes time.
  • Company and country data move much less. Measured effects on total output, pay or hours are small so far, and some studies find none.

For coding tools in particular, see how to measure the real impact of GitHub Copilot on your team.

Forecasts run far ahead of results. In June 2023, McKinsey estimated that generative AI could add $2.6 trillion to $4.4 trillion a year across the 63 use cases it analyzed. That is potential, not measured output. In October 2024, a BCG survey of 1,000 executives in 59 countries found that 74% of companies had not yet shown tangible value from AI. For the cost side, see how to track and prove ROI from AI investments.

Company comparisons need care too. PwC's yearly AI Jobs Barometer, for example, compares companies by how exposed their work is to AI. A comparison like that can show a link between AI exposure and productivity growth, but not that AI caused it.

Why task gains shrink at company level

A study of one task measures that task under good conditions. Your company's output depends on every task, every person and what people do with the time they save. Three things shrink the gain on the way up.

  • The task is only part of the week. If drafting takes 10% of someone's hours, making drafting 40% faster saves 4% of their week, not 40%.
  • Not everyone uses it. If half the team uses AI in a given week, the team saves half as much.
  • Saved time is not output. Time saved becomes value only if it goes into more or better work. It can also go into longer breaks, extra meetings or lower-value tasks.

A worked example with made-up numbers

StepMade-up numberWhat is left of the gain
AI makes drafting faster40% less time per draftDrafting takes 40% less time
Drafting's share of each user's week10% of hours4% of each user's week saved
Share of staff who use AI in a given week50%2% of all team hours saved
Saved time that goes into more outputHalfAbout 1% more team output

A 40% gain on one task ends up as about 1% more output for the team. That is why task studies report big numbers while company data barely moves, and why both can be right. The numbers are made up to show the arithmetic. Put your own task shares and usage rates into the same four steps.

Why the numbers you read disagree

  • Different tasks. AI helps with some work and not with other work, and the line moves as tools improve.
  • Different people. Newer workers tend to gain more than experienced ones.
  • Different measures. Some studies count time taken, some count tasks completed, some score quality, and some rely on what workers say.
  • Different tools and dates. A result from tools that are a year or two old may not hold today.
  • Self-reports are not measurements. What people say AI saves them is an estimate. Where you can, measure time and output from records.

Questions to ask before you trust a productivity number

  • Which task was measured, and how much of a normal week does it take?
  • Who was measured: new hires, experts, or a mix?
  • Was time measured from records, or reported by the workers?
  • Who was the comparison group, and were they similar before AI arrived?
  • Which tool and which version, and when?
  • Was quality checked, or only speed?

A number that cannot answer most of these questions is a claim, not evidence.

How to measure the productivity impact of generative AI in your own company

You do not need a research team. You need a few specific tasks, a baseline and a fair comparison.

  • Step 1. Pick two or three tasks per team. Choose work you can count, such as support tickets closed, code changes merged, reports drafted or sales calls prepared. Record today's time, output and quality, either before rollout or for a group that has not started yet.
  • Step 2. Track real use, not licenses. Count how many people use AI each week, how many days they use it and which tools they use, from tool logs rather than surveys.
  • Step 3. Compare like with like. Compare AI users with similar non-users, or teams that started earlier with teams that start later. Do not compare enthusiasts with everyone else, because they may have been faster anyway.
  • Step 4. Check quality and side effects. Look at rework, errors, review time and customer outcomes. A speed gain that comes back as rework is not a gain.
  • Step 5. Report a range and repeat. Show a low and a high estimate, say what you could not measure, and repeat every quarter, because tools and habits change.

For a deeper method, see how to measure employee AI productivity accurately. To test whether the time saved is real, see is AI actually saving time in your company.

Worked example: estimating the effect for one team

Here is the arithmetic for one comparison, with made-up numbers. Two support teams of similar size handle the same kinds of tickets. Team A starts using an AI assistant in March. Team B starts in June, so from March to May it is the comparison group.

MeasureTeam A (uses AI from March)Team B (starts in June)
Tickets closed per agent per hour, January to February5.04.8
Tickets closed per agent per hour, March to May5.85.1
Change+0.8+0.3
Tickets reopened within 7 days, March to May9%8%

Team B improved by 0.3 tickets an hour without AI, perhaps from a quieter season or better ticket routing, so that part of Team A's gain would have happened anyway. The AI effect is the difference between the two changes: 0.8 minus 0.3, or 0.5 tickets an hour, about 10% of Team A's starting level.

Check two things before you report it. First, quality: Team A's reopen rate is a point higher, so some of the speed may come back as rework. Second, noise: repeat the comparison on other months or teams and report a range, such as 6% to 14%, rather than one number.

Three levels to track

Measure in three layers, from who uses AI to whether more gets done. The first two come from usage data. The third needs data from the systems where the work happens. For the metrics behind each level, see which AI adoption KPIs actually matter.
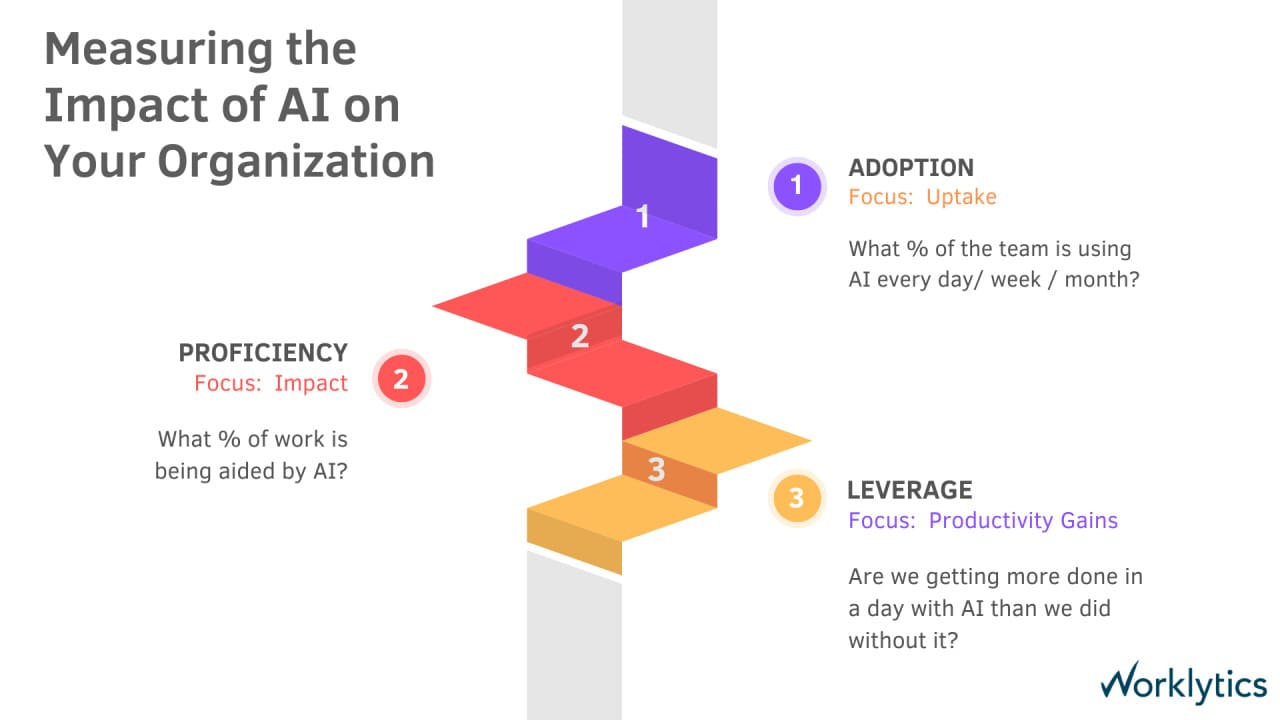
Three-step model for measuring the impact of AI: adoption, proficiency and productivity gains, each with the question it answers.
Worklytics model for measuring AI impact: adoption (uptake), proficiency (how much work AI aids) and productivity gains (whether more gets done).
LevelQuestion it answersExample measuresWhat can mislead you
1. AdoptionHow many people use AI?Share of people using AI each week, days used per week, which toolsLicenses bought are not use
2. ProficiencyHow much of their work does AI touch?Share of workday blocks with AI use, number of uses, use by team and tenureHeavy use is not good use
3. Productivity gainsIs more getting done, or done better?Time to finish a standard task, output per person, rework, customer resolution timeA gap between users and non-users can have other causes
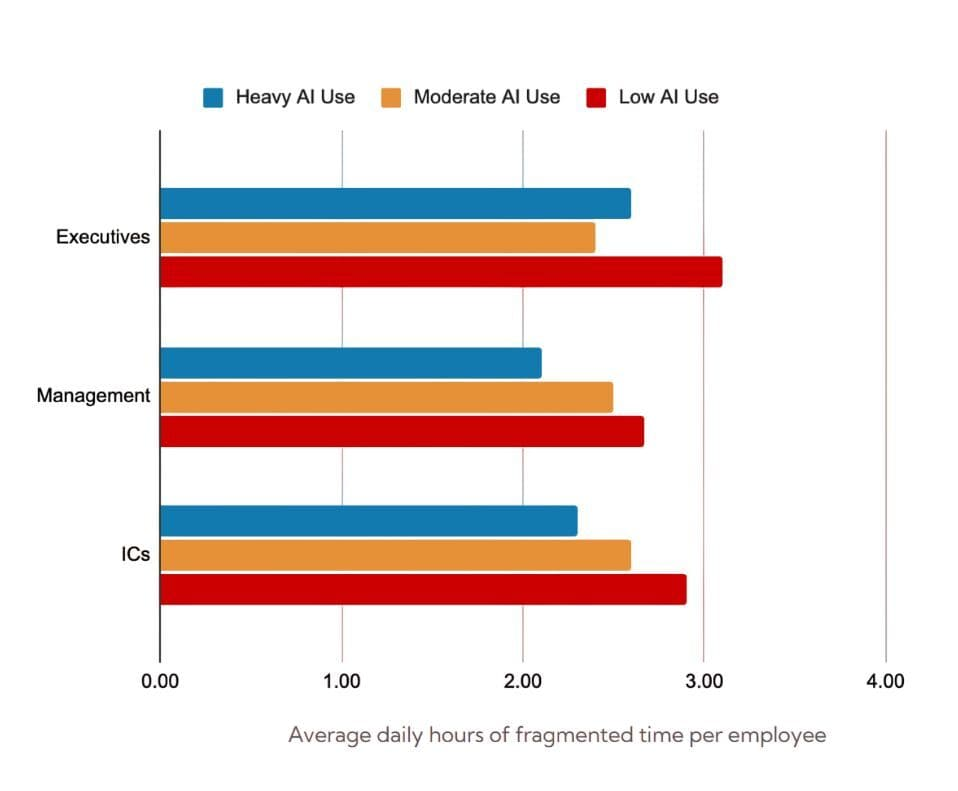
Bar chart of average daily hours of fragmented time for executives, managers and individual contributors with heavy, moderate and low AI use.
Illustrative example: average daily hours of fragmented time by job level and level of AI use. Illustrative data, and a pattern like this is a correlation, not proof that AI caused it.

AI productivity analytics: what usage data can and cannot show

Usage logs from AI tools can show who uses AI, how often, with which tools, and how that differs by team, role and tenure, without reading anyone's prompts or documents. Worklytics is one example. It reads usage and log data from corporate AI tools such as ChatGPT, Claude, Gemini, GitHub Copilot, Cursor and Microsoft 365 Copilot. Its metrics include days AI was used, number of uses and the share of workday blocks with AI use, by type of tool. Worklytics says it pseudonymizes the data, reports at group level and does not store or analyze work content. The AI usage checker shows what a team-level view looks like.
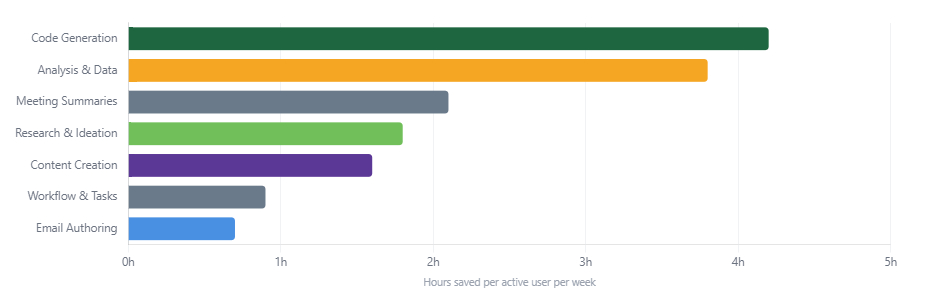
Sample report bar chart of estimated hours saved per active AI user per week by type of task, from code generation to email authoring.
Sample report with illustrative data: estimated hours saved per active AI user per week, by type of task.

Usage data also has limits. It cannot show whether the output was good, whether saved time became useful work, or whether AI caused a change. Some tools expose more detail than others. Use usage data to find where to look, then confirm with the five steps above. It does not replace a fair comparison.

Frequently asked questions

How does generative AI increase productivity?

It speeds up or improves specific tasks, such as drafting text, answering support questions, summarizing documents and writing code. How much that adds up to depends on how much of someone's week those tasks take, and on whether the time saved goes into more or better work.

Has generative AI actually increased productivity?

At the task level, controlled studies mostly find that it has. At the company and country level, the measured effect so far is small and harder to see, because a gain on one task is diluted by everything else people do.

Does AI ever decrease productivity?

It can. When checking and fixing AI output takes longer than doing the work, or when people use it on work they already do quickly, tasks can take longer. This is one reason to measure results rather than rely on how fast people feel.

Which workers benefit most from generative AI?

Newer and less experienced workers tend to gain the most on routine, well-defined tasks, because AI gives them some of what experienced colleagues already know. Experienced people often gain less on work they already do well.

How do you measure the productivity impact of generative AI?

Pick specific tasks, record time, output and quality before and after rollout, track real use from tool logs instead of surveys, and compare AI users with similar non-users or with teams that start later. Report a range, check quality and side effects, and repeat each quarter.

How do you measure the ROI of generative AI?

Compare what the tools and rollout cost with the value of the work that was actually completed or improved, not with hours saved on paper. Saved time only counts as value when it turns into output. In an October 2024 BCG survey, 74% of companies had not yet shown tangible value from AI.

How do you measure AI use without reading employee messages?

Use usage and log data from the AI tools, such as how many days people used AI, how many times, and which tools, reported at team level. This shows adoption without reading prompts or documents. It does not show whether the output was good, so pair it with outcome measures from your own systems.

If you want to see these usage measures for your own organization, the AI adoption page shows what Worklytics tracks and how it handles privacy.

Request a demo

Schedule a demo with our team to learn how Worklytics can help your organization.

Book a Demoor take the product tour →