
ChatGPT Usage Dashboard: What to Track in 2026 (with Examples)
ChatGPT has moved from novelty to standard-issue work tool faster than almost any technology before it. OpenAI now reports more than 900 million weekly users and over 50 million paid enterprise seats as of early 2026. Inside most companies, the question has shifted from whether to deploy ChatGPT to whether the deployment is actually working.
A ChatGPT usage dashboard answers that. At its most useful, it aggregates data on who is using ChatGPT, how often, for what kinds of work, and to what business effect, then turns it into something leaders can act on. The landscape has changed in one important way recently: in March 2026, OpenAI launched a refreshed Workspace Analytics dashboard for ChatGPT Enterprise and Edu that ships built-in metrics most organizations used to build themselves. The result is that the question is no longer just "how do I get a dashboard." It is "what do I track that the native dashboard doesn't show me, and how do I turn usage data into adoption and ROI?"
This guide covers the metrics that matter, how the native ChatGPT Enterprise dashboard compares with a custom or third-party setup, and how to use the data to drive real adoption rather than just look at it.
TLDR
Deploying ChatGPT without measuring it is the corporate equivalent of buying a piece of equipment and never checking whether anyone has plugged it in. The reasons to track usage are not just financial, though the financial case is the easiest one to make to a CFO.
ChatGPT Enterprise is not cheap. Tracking active users and prompt volumes against seat allocations is the only way to know whether the licenses you paid for are being used. More importantly, dashboards let you correlate usage with outcomes. If the sales team's ChatGPT use jumped 40% last quarter and proposal turnaround time dropped at the same time, that's a defensible business case, not a hopeful story.
Usage data surfaces early signals of where AI is working and where it is not. A department completing projects materially faster is producing a best practice worth spreading. A department with low adoption is a target for enablement: workshops, internal champions, or a closer look at whether the workflows actually fit the tool. Without a dashboard, both signals are invisible.
Usage broken down by team or role reveals where the workforce needs support building AI fluency. A disparity often means non-technical teams either do not know how AI applies to their work or do not feel confident enough to use it. Dashboards make these gaps visible so HR and L&D can target training where it is actually needed.
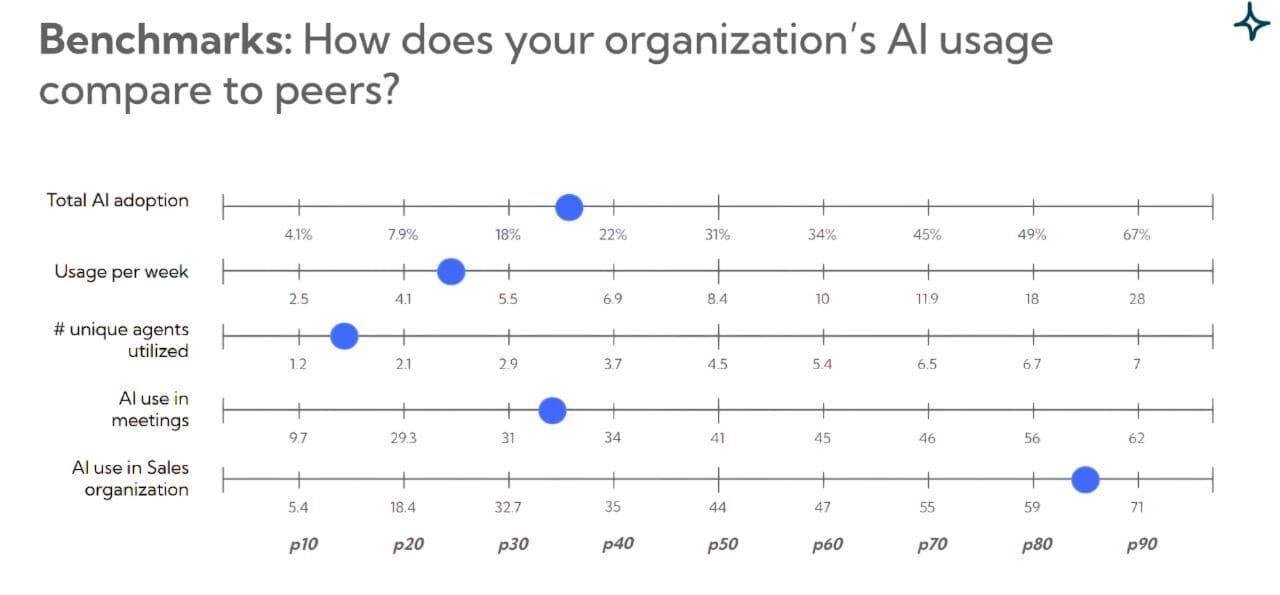
OpenAI's own internal data shows that the highest-adopting enterprises send roughly 6x more prompts than the median company. That gap is what benchmarking surfaces. Some platforms offer anonymous peer comparison; ChatGPT Enterprise's native Workspace Analytics now includes industry benchmarks as well. Either way, knowing where you sit relative to comparable organizations turns a metric into a goal.
Tracking ChatGPT consumption avoids the discovery that a critical workflow has hit a rate limit at 4 p.m. on a Friday. Visibility into consumption patterns lets you reallocate licenses, adjust usage behavior, or upgrade tiers proactively. For API-based deployments, dashboards make cost trends visible before they hit the next budget cycle.
Before designing a ChatGPT dashboard, it is worth understanding what comes out of the box. ChatGPT Enterprise and Edu workspaces now include a native Workspace Analytics dashboard with five main views: Overview, Users, GPTs, Projects, and Task Insights. Out of the box, it reports seat allocation and activation, weekly active users, "power users" (defined by OpenAI as the top 20% of message senders with 75 or more messages per week and 3+ different tools per month), trend lines over time, peer benchmarks, and aggregated task categories.
For most organizations using ChatGPT alone, the native dashboard answers the first wave of questions. Where it falls short is at the edges of what enterprise leaders actually need to know:
Practically speaking, organizations end up in one of three configurations:
A well-designed dashboard refines raw usage logs into a small set of metrics that lead to decisions. The metrics below are the ones that matter; the native ChatGPT Enterprise dashboard covers some of them out of the box and others require additional tooling.
The cleanest opening metric, and the one OpenAI's own Academy guide recommends starting with. If you bought 500 seats and 320 are activated, your activation rate is 64%. Anything well below benchmark suggests an onboarding or awareness problem, not a tool problem. The fix is enablement, not more seats.
Active user counts answer the basic adoption question. Watching weekly active users (WAU) over time is more useful than a snapshot; a climbing WAU curve indicates that ChatGPT is becoming part of how work gets done rather than a one-off experiment. The ratio of WAU to MAU is also informative, since high ratios mean the people who use ChatGPT come back regularly.
Volume separates dabblers from deep adopters. If active users are high but the average user sends only a handful of messages per week, people are experimenting rather than integrating. A rising prompts-per-user trend is one of the strongest indicators of genuine adoption depth.
OpenAI defines power users as the top 20% of message senders who hit 75 or more messages per week and use 3 or more tools per month. Tracking this cohort matters for two reasons. First, power users are where the real productivity gains and use cases are emerging, so they are worth studying. Second, if your power-user share is small and not growing, adoption has plateaued at surface use.
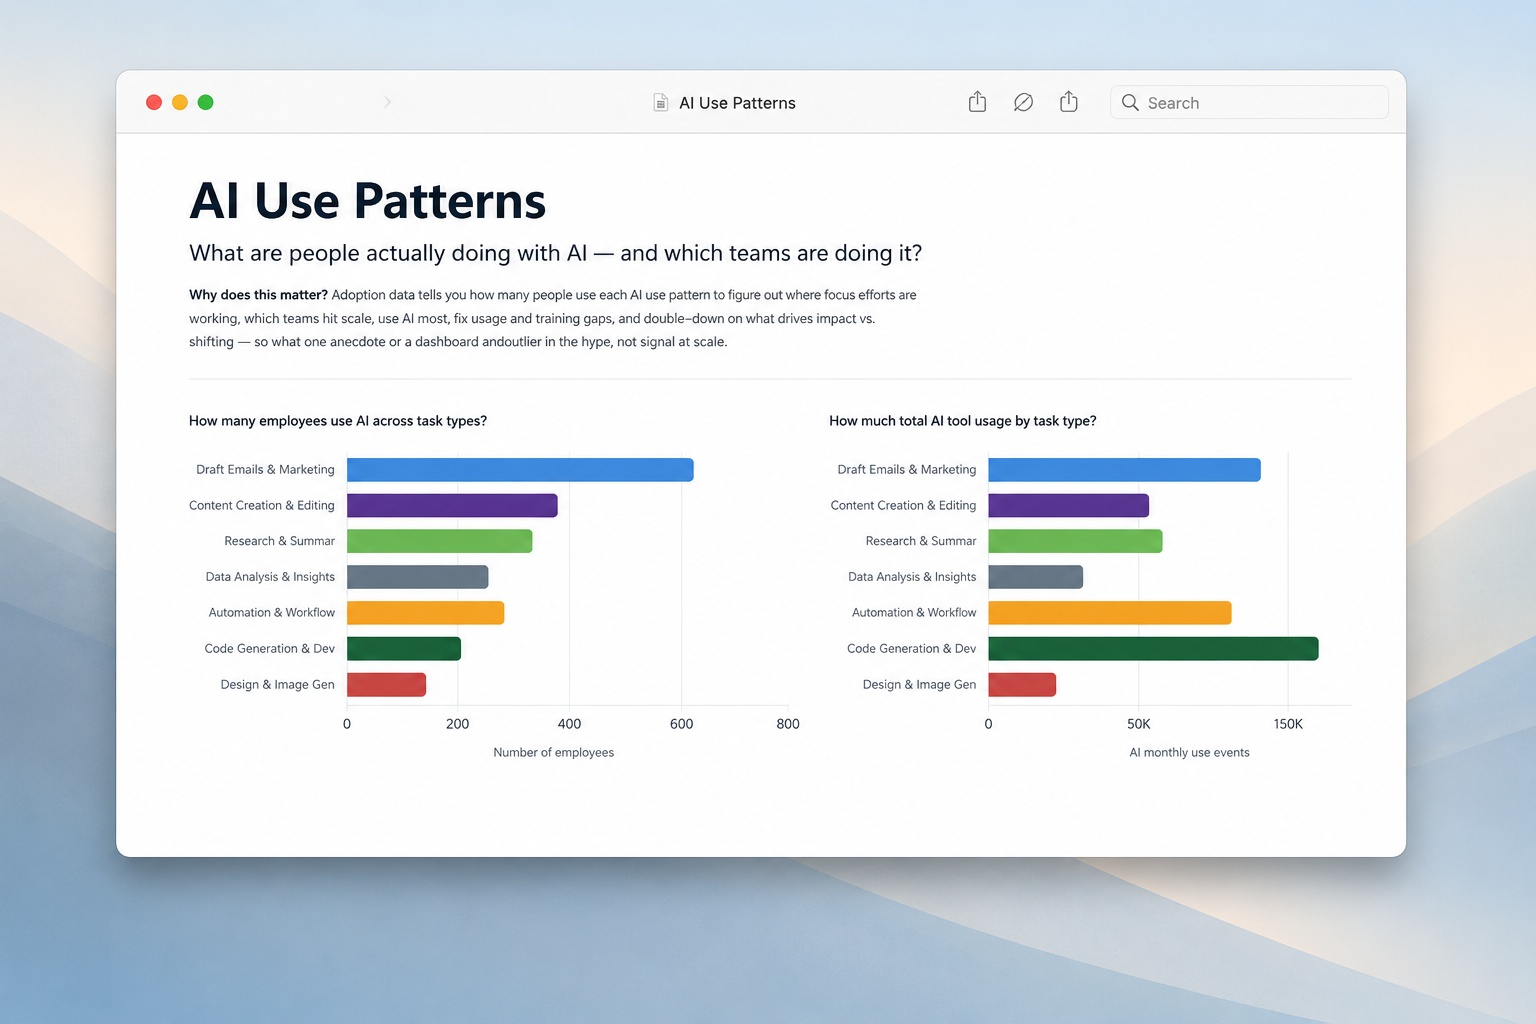
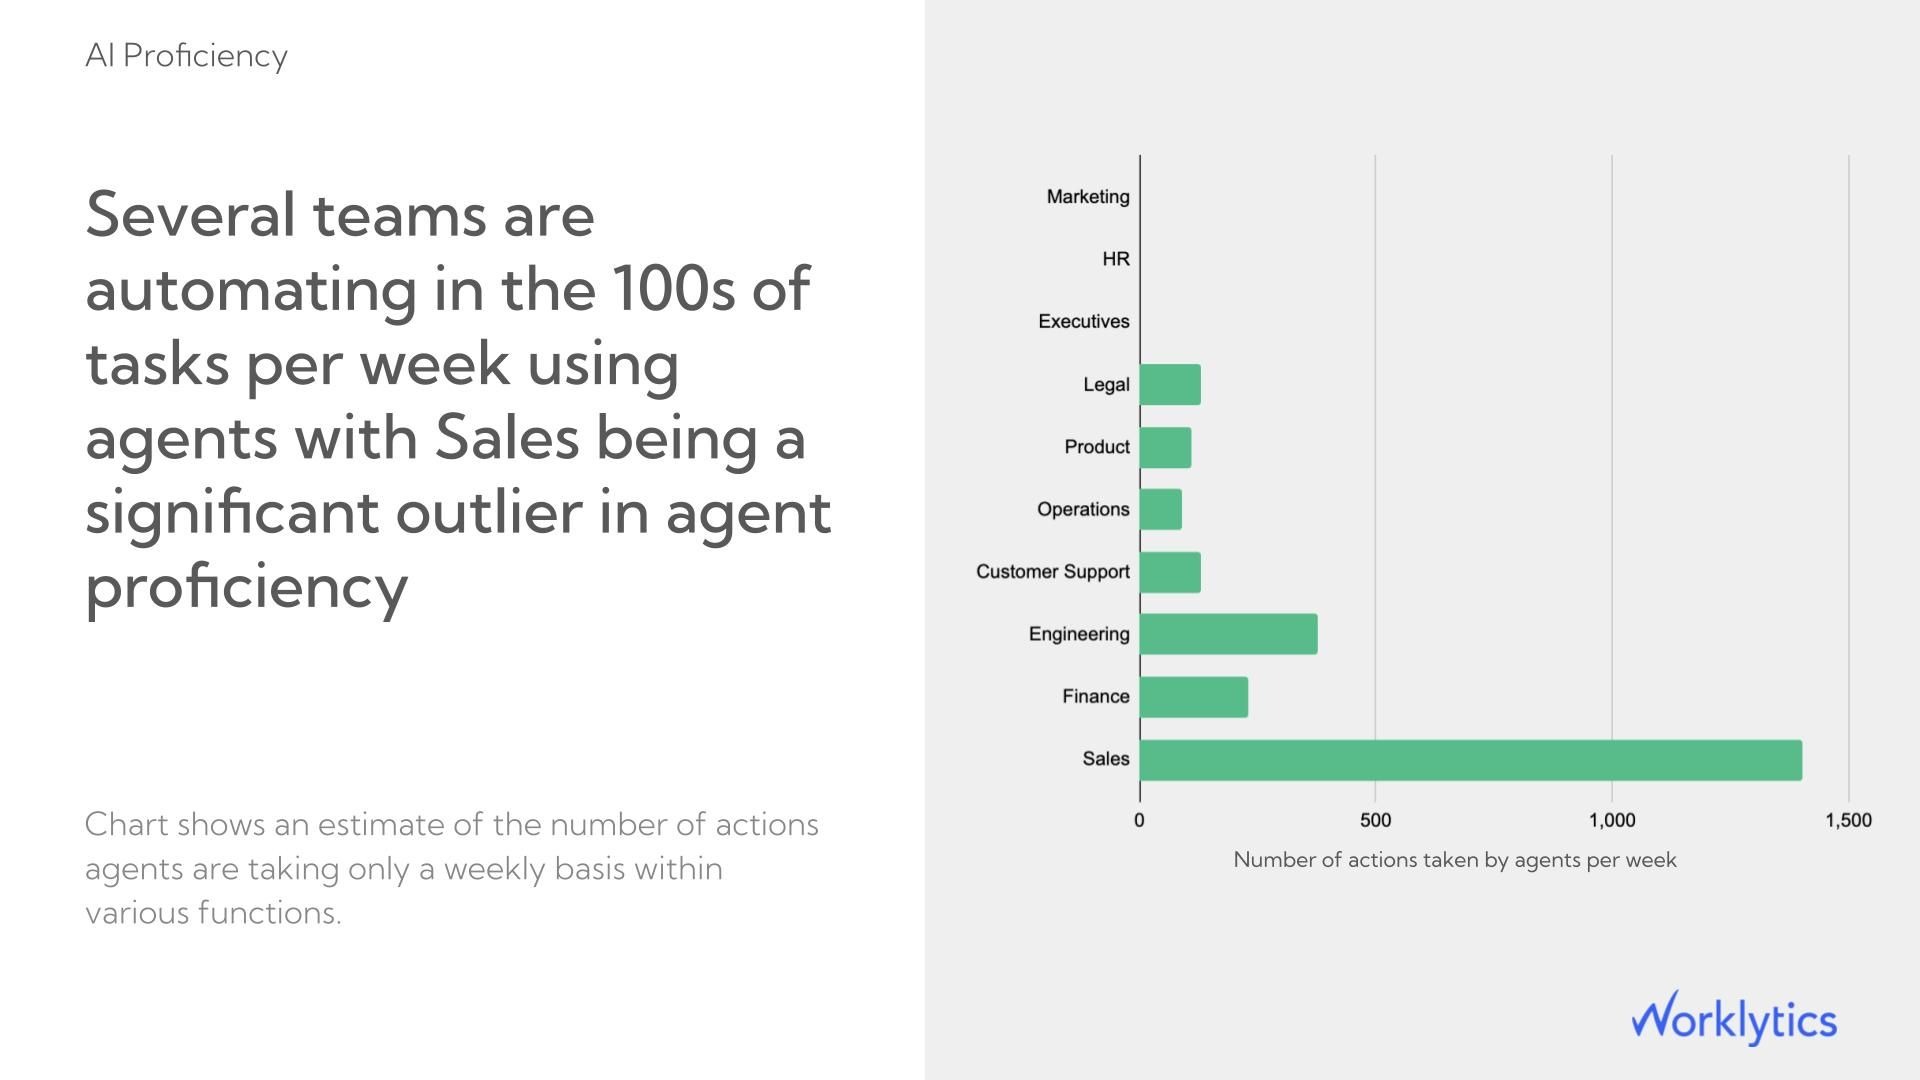
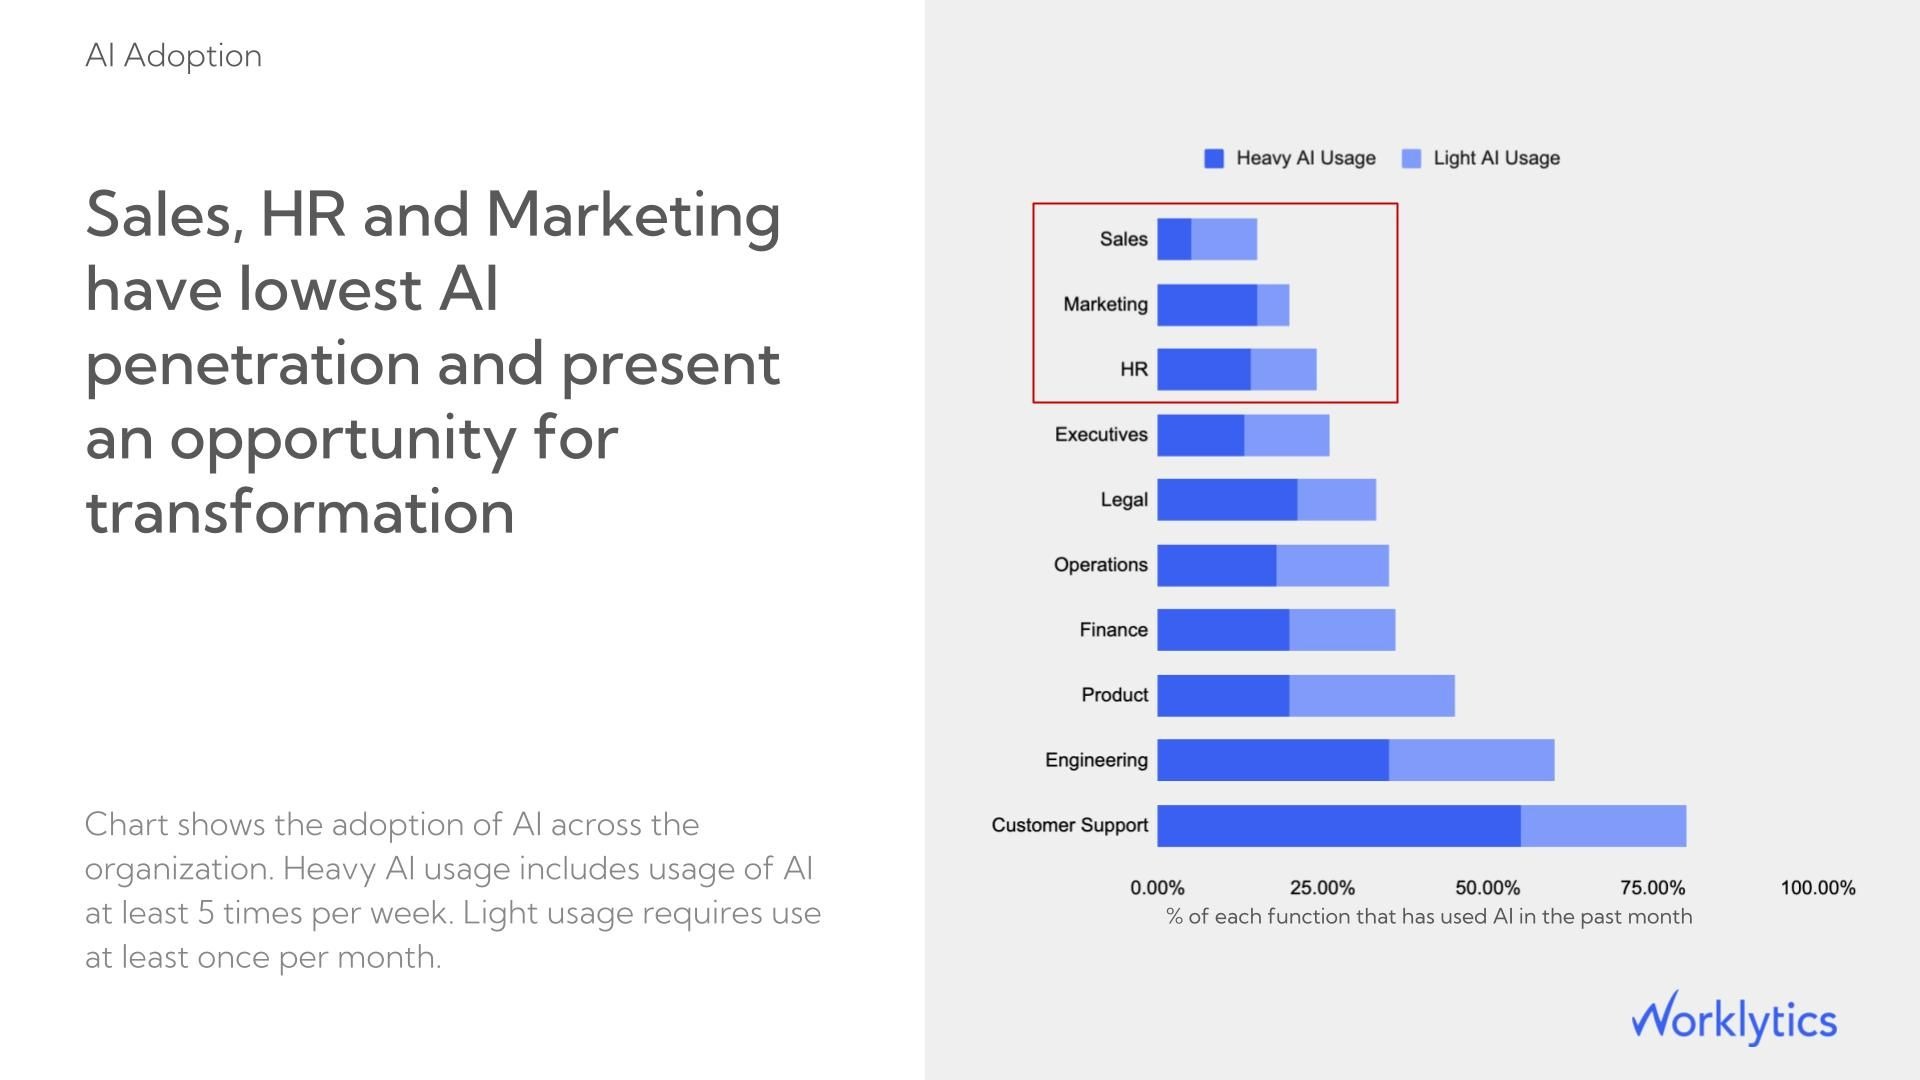
Slicing usage by department, job function, or location surfaces the patterns leaders need to act on. Engineering and customer support typically adopt early; legal, finance, and HR often lag. The interesting question is why. Sometimes the work genuinely has fewer ChatGPT use cases; more often, the issue is awareness or confidence. The breakdown view is what lets you tell the two apart.
OpenAI's Task Insights now classifies conversations into task categories (writing, coding, research, summarization, data analysis, and so on). It tells you not just how much ChatGPT is used but for what. Use-case distribution is where dashboards stop being adoption metrics and start being workflow metrics. If 60% of your sales team's ChatGPT use is content drafting and 5% is data analysis, that says something about both the team's workflow and the gaps in their toolkit.
Tracking cost per active user gives you a defensible number to bring to budget conversations. License efficiency is the related metric: if Team A has 50 seats and 30 active users while Team B has 25 seats and 25 active users, your seat allocation is wrong. For API-based deployments, watch monthly cost against usage volume to spot runaway costs before they become a finance problem.
Benchmarking turns a number into a goal. OpenAI's native dashboard now includes peer benchmarks by industry, and third-party platforms typically offer anonymized cross-company comparison. The benchmark to anchor against, per OpenAI's own data, is that frontier companies send roughly 6x more prompts than the median. If you are sitting at the median, the gap to leadership is large and addressable.
This is the metric category that separates a usage dashboard from a true ROI dashboard, and it is also the one the native Workspace Analytics cannot produce. Connecting ChatGPT usage to KPIs like project cycle time, code review duration, customer satisfaction scores, sales win rates, or meeting load is where measurement starts to inform strategy rather than just describe activity. Doing this requires combining ChatGPT data with data from other systems, which is what an analytics layer above ChatGPT is for.
Building a dashboard is the easy half. The harder half is establishing the cadence and the discipline to act on what it shows. Three habits separate organizations that get value from their ChatGPT investment from those that just have a dashboard.
OpenAI's own guidance is to treat adoption as a sequence: access, first use, repeat use, deeper adoption. If progress slows at one stage, fix that stage before investing further downstream. Adding more licenses when activation is low is a common, expensive mistake. The dashboard tells you where the bottleneck actually is.
Most organizations underuse their dashboards because no one owns them. A monthly review with the AI program lead, IT, HR, and one or two department heads is enough. The agenda is simple: where did the numbers move, what did we learn, what do we do differently next month. Without that cadence, even the best dashboard becomes wallpaper.
Dashboards explain what is happening, not why. When a department's usage drops or a team underperforms benchmarks, the next step is a short, curious conversation with that team. OpenAI Academy specifically recommends leading with empathy rather than a punitive tone, treating low adoption as a friction point to fix rather than a failure to call out. That posture is what keeps a measurement program from drifting into surveillance.
Almost no enterprise runs ChatGPT in isolation. The same employees who use ChatGPT Enterprise also have Microsoft 365 Copilot in their Office suite, Gemini in Workspace, GitHub Copilot and increasingly agentic coding tools like Claude Code, Cursor, and Codex in their IDEs, and Slack AI in their chat threads. Each of these tools has its own native dashboard, each with its own definitions of "active user" and its own taxonomy, and none of them talk to each other.
From a leadership perspective, that is the wrong unit of analysis. The question is not "how is ChatGPT adoption going." It is "how is AI adoption going," with ChatGPT as one component of it. Answering that requires a layer above the individual native consoles.
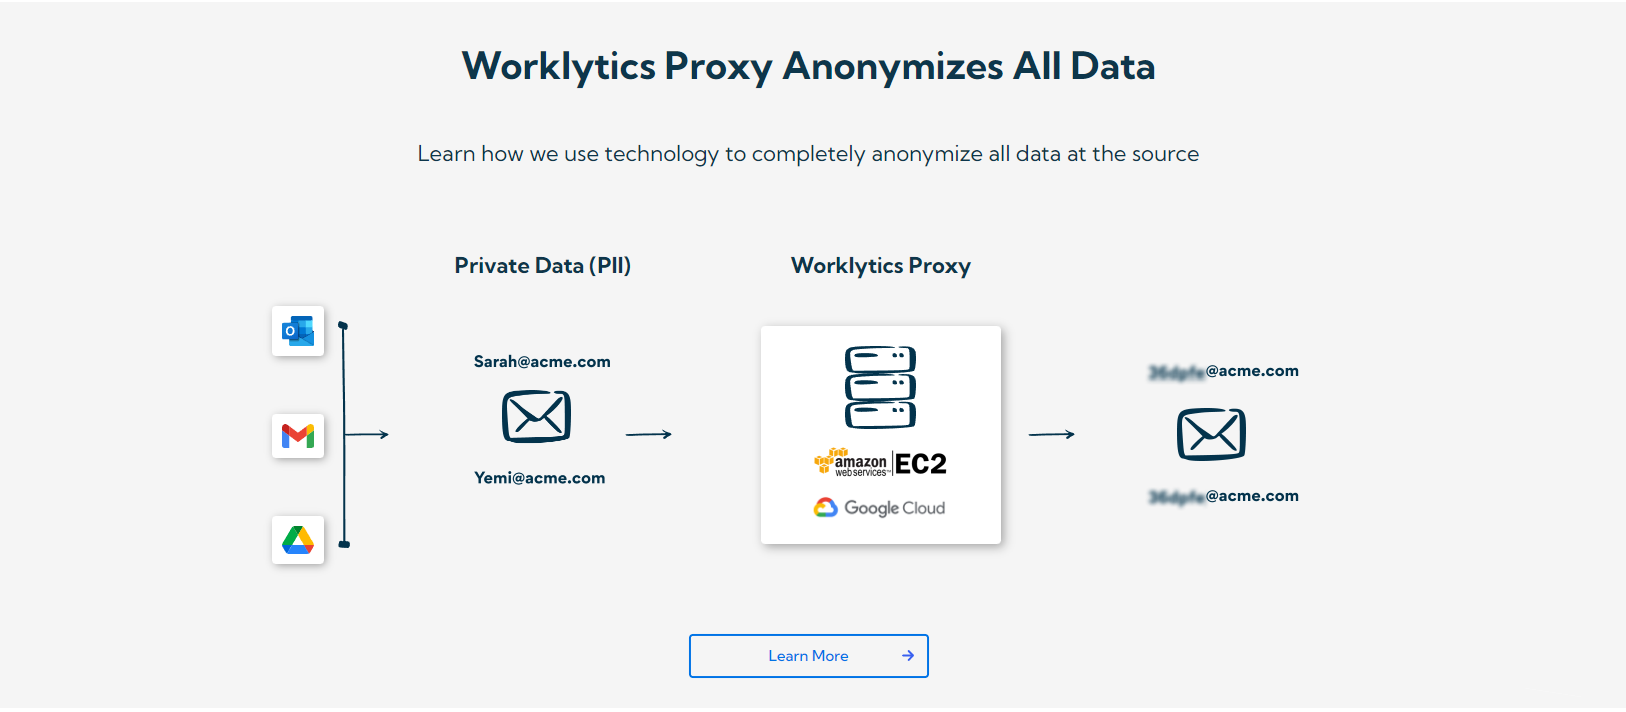
This is the role of an AI adoption analytics platform like Worklytics. It connects to ChatGPT, Microsoft 365 Copilot, Gemini, GitHub Copilot, and Slack AI through their official admin APIs, anonymizes the data at ingestion, and presents adoption metrics at team and department level in one unified view. Where the native dashboards stop, the analytics layer adds three things:
For a deeper walkthrough of the broader category, see our guide on how to measure employee AI usage without invading privacy, and our department-level companion piece on tracking ChatGPT Enterprise usage by department.
Note for the dev team: wrap this section in FAQPage schema. Each H3 is a Question, the paragraph below is the Answer.
Yes. ChatGPT Enterprise and ChatGPT Edu include a native Workspace Analytics dashboard with views for Overview, Users, GPTs, Projects, and Task Insights. It tracks seat activation, weekly and monthly active users, power users (defined as the top 20% of message senders with 75+ messages per week and 3+ tools used per month), task categories, and peer benchmarks by industry. ChatGPT Plus and consumer accounts do not have an equivalent admin dashboard. ChatGPT Team has a more limited workspace analytics view.
At a minimum: activation rate, weekly active users, usage volume per active user, power-user concentration, department or team breakdown, task and use-case distribution, cost per active user, and benchmarks against peers. Mature deployments add correlation with business outcomes (project cycle time, customer satisfaction, sales metrics, meeting load) by combining ChatGPT data with other systems.
No. ChatGPT Enterprise's Workspace Analytics is an aggregated analytics experience and does not expose message text, file contents, or item-level records. Raw conversation logs are only accessible through the separate Compliance API, which is intended for legal, security, and investigation workflows, not routine performance management.
Without ChatGPT Enterprise or ChatGPT Edu, your options are narrower. You can use network or firewall logs to detect connections to chat.openai.com and capture connection-level metadata. You can use anonymous employee surveys to capture self-reported personal-account use. For API-based deployments, you can route all calls through a corporate gateway and log them. For a fuller walkthrough of these options, see our guide on how to track if employees use ChatGPT.
A third-party analytics layer is most valuable when your organization runs multiple AI tools (ChatGPT plus Microsoft 365 Copilot, Gemini, GitHub Copilot, Slack AI) and you want a unified view, or when you want to correlate AI usage with business outcomes from your CRM, project management, or calendar data. The native dashboard sees only ChatGPT activity in isolation. If you run only ChatGPT and only need basic adoption metrics, the native dashboard is often enough on its own.
Monthly is the right cadence for most organizations. The review should include the AI program lead, an IT or admin contact, an HR or L&D representative, and one or two department leaders. The standing agenda is what moved in the numbers, what we learned, and what we do differently next month. Quarterly is fine if the program is mature and stable; weekly is overkill unless you are actively launching a major rollout.
The question is no longer whether to measure ChatGPT usage. OpenAI's own dashboard makes the first layer of measurement table stakes. The questions worth asking now are sharper. What does the native dashboard not show you? How does AI use across your full stack compare team-by-team? Where is usage producing measurable business outcomes, and where is it just activity? A well-built dashboard answers all three.
If you want to see what cross-tool AI adoption analytics looks like in practice, you can explore the Worklytics AI adoption dashboard or book a demo to see ChatGPT usage and the rest of your AI stack in one view.


