Implementing cutting-edge technology, such as Salesforce's Agentforce, is an exciting move for any company. Agentforce promises to offload routine tasks to AI agents and boost productivity. For an overview of what Salesforce's AI products do today, see Salesforce AI and Agentforce: what they mean for employee productivity.
But after rolling it out, how do you know if your employees are actually using it? The short answer: start with Salesforce's own Agentforce Analytics and usage data, then look at adoption by team alongside your other AI tools.
Ensuring adoption is crucial; even the most powerful AI tool delivers no value if it sits unused. In this blog, you'll learn why tracking Agentforce usage matters, how to measure it, and strategies to encourage widespread adoption.
Tracking whether employees are using Agentforce isn't about micromanaging or playing Big Brother. It's about ensuring a valuable tool is delivering value. You can't manage what you don't measure. Without visibility into usage, companies risk investing in AI capabilities that employees either underutilize or struggle with silently. Here are several key reasons why measuring Agentforce adoption is so important:
Agentforce likely represents a significant investment (in licensing, implementation, and training). Tracking usage data helps justify that the investment is paying off. If only 5% of your staff are using the AI agent when 100% have access, you’re not getting the full ROI. Leadership can also quantify how broadly the tool is being adopted and whether it’s saving as much time as expected.
Usage metrics can highlight teams or departments with low adoption rates. If one department barely uses Agentforce while others use it daily, that's a flag. Perhaps those employees lack confidence in the AI, or they are unsure of its capabilities. Tracking which teams use Agentforce (and which don't) lets you target follow-up efforts, such as a refresher workshop or sharing best practices, to the groups that need it most.
On the flip side, data will reveal high-adopting teams. These teams can be invaluable resources. For example (hypothetical numbers), if most reps on your customer support team in Region A use the AI every week while Region B's team lags behind, you can ask Region A to share their tips and workflows. Recognizing teams that embrace the tool also boosts morale and encourages others to follow suit. In essence, usage tracking helps propagate internal success stories.
Usage patterns show whether Agentforce meets employees' needs. If workers try it but abandon it, or certain tasks have low use, the AI's performance or scope may need adjusting. Salesforce introduced Agentforce Command Center with Agentforce 3 in June 2025 to track adoption, feedback and success rates; the product is now called Agentforce Observability. Measuring usage creates feedback loops: Are response times too slow? Which requests fail? These insights help you tune the AI or add resources, so Agentforce improves workflows instead of frustrating employees.
At a higher level, executives and HR can use adoption data in workforce planning. If only a fraction of the workforce uses a tool that's supposed to be enterprise-wide, that might call for a change management initiative. Alternatively, if adoption is high and yielding measurable productivity gains, that success can justify further AI investments or expansion to new use cases. In board meetings or QBRs, hard numbers make the impact of your digital transformation tangible, for example a line such as "Agentforce usage grew from 20% to 60% of frontline staff this quarter" (example numbers).
In short, tracking usage of Agentforce is about ensuring people + AI actually equals productivity. It provides the clarity and control to turn a fancy new capability into sustained business results.
So, how can you actually tell if and how employees are using Agentforce? There are a few approaches, from the analytics Salesforce provides to broader work analytics:
Salesforce's built-in option is Agent Analytics, a set of dashboards powered by Tableau Next. Admins open it from Agentforce Studio: select Agents, then Analytics under Observe & Optimize (Trailhead, Monitor Agent Metrics and Scores).
For adoption, the most useful view is the Usage tab, which shows Unique Users, Unique Sessions, Unique Interactions and Average Interactions Per Session. Other tabs cover effectiveness (deflection, escalation, abandonment and task resolution rates), quality scores, health (error rate and session duration) and trust. Quality and trust metrics only appear after you turn on Audit and Feedback in Setup. For employee-facing agents there is also an Employee Agent dashboard with user satisfaction (thumbs up and thumbs down counts).
Agent Analytics is part of Agentforce Observability, formerly Agentforce Command Center, which adds session tracing, health monitoring with alerts, and credit consumption per agent. In Service Cloud, Salesforce also shows agent activity in real-time wallboards for contact center supervisors (Salesforce, Agentforce 3 announcement).
A good starting point: make sure your admins and team leads can open these dashboards, check Unique Users to see how many employees have used an agent, and watch the trend week over week.

For custom reporting, Salesforce records agent activity as data in Data 360 (formerly Data Cloud):
With this data, an admin or analyst can build reports such as "Agentforce interactions per user per week" or "share of employees who used an agent this month" in Data 360 Reports, Tableau Next or CRM Analytics, and slice them by department, role or region. For credit and billing figures, Salesforce's Digital Wallet remains the source of truth.
Salesforce's reports show Agentforce on its own. To compare it with the other AI tools your teams use, you need a work analytics platform such as Worklytics.
Worklytics does not connect to Agentforce natively. Instead, you can export Agentforce usage events (for example from the AI usage data in Data 360) and load them through Worklytics' generic bulk import of AI work events. Worklytics then reports Agentforce adoption by team and role next to tools it connects to directly, such as ChatGPT, Microsoft Copilot or Gong. Worklytics also captures Salesforce CRM activity, such as accounts created and edited, tasks, logged emails, calls and events, so you can see AI adoption and sales activity for the same teams.
From there you get dashboards that track AI adoption rates over time, help you identify departments that might need extra support or training, and, with peer benchmarking (in beta), compare your AI usage with other organizations.
The benefit of a unified view is context. For example, you might see that a sales team using Agentforce heavily also logs more customer calls and emails in Salesforce and spends fewer hours in internal meetings, which suggests the AI is freeing up time. Another team with low Agentforce usage and unchanged meeting load may need more help getting started. Such cross-tool comparisons are hard to get from Salesforce's dashboards alone.
While not a technical measurement, don’t overlook simply asking employees about their Agentforce usage and experience. Usage logs tell if someone is using the tool, but a quick survey or manager check-in can reveal why or why not.
For instance, if data shows that a particular department’s usage is low, a follow-up survey might uncover that they had issues with the initial setup or didn’t understand how the AI could assist their specific tasks.
Combining the quantitative data (e.g., only 3 out of 10 team members have tried Agentforce) with the qualitative context (e.g., “we need a use-case cheat sheet for our finance team to see how it helps them”) provides a comprehensive picture. Additionally, engaging employees in dialogue demonstrates that the goal of tracking isn’t to penalize anyone, but to help everyone derive more value from the tool.
In practice, you might use a mix of the above. Many organizations begin with the built-in Salesforce dashboards for a quick check on adoption levels, and then progress to more advanced analytics as needed. The key is to ensure that the data is actually reviewed and discussed. Make Agentforce usage a regular topic in relevant meetings. For example, the head of customer service might review AI adoption metrics weekly, just as they review call volumes or CSAT scores.
If you're looking for a robust way to track Agentforce usage and overall AI adoption across your organization, Worklytics offers a strong option. Worklytics is a people analytics platform built to help companies understand how work gets done, by aggregating data from the tools your teams use (Salesforce, Slack, Microsoft 365, project management tools and more) into meaningful insights.
For the challenge of tracking Agentforce usage, Worklytics provides a few key advantages:
Modern workflows span multiple apps. A sales executive might use Agentforce, chat with colleagues in Slack, and draft documents in Microsoft 365, all in one afternoon. Worklytics can bring in activity data from these sources and connect the dots, for example to see whether teams with higher Agentforce usage send fewer internal emails or spend less time in meetings.
Or maybe your engineering team uses GitHub Copilot while your sales team uses Agentforce. Copilot comes in through a native connector and Agentforce through bulk import, so both appear in one AI adoption dashboard broken down by team.
This broad perspective is crucial for people analytics and HR leaders who want to foster digital adoption in general, not just siloed by each application.
If your sales team also runs on Gong, see how to track Gong usage across your sales team.
Worklytics breaks down usage by attributes like department, team, role or location. Instead of a raw log of events, you get views you can act on, for example (example numbers): Marketing Department: 10 Agentforce interactions per user per week (low), Sales Department: 50 interactions per user per week (high).
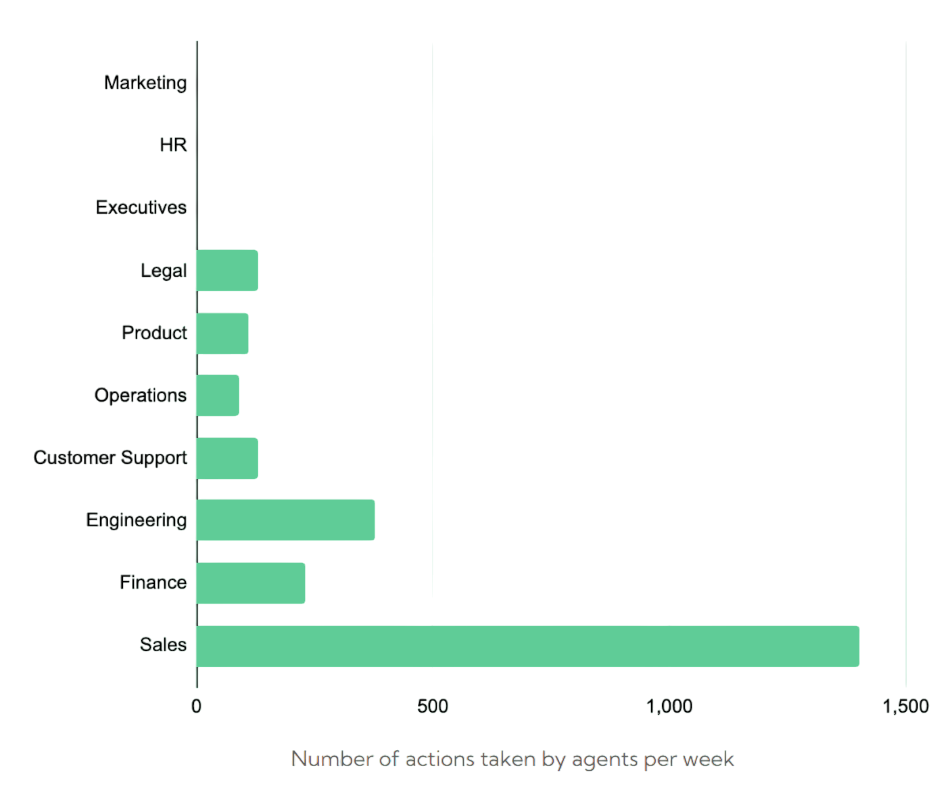
Comparing teams side by side makes gaps easy to spot, so you know which groups to support with training and which teams' practices are worth sharing. Results are shown for groups, not individuals, so the conversation stays about teams and workflows.
Worklytics keeps historical data, allowing you to track trends over time. You can see if the marketing team's Agentforce usage increased after the training session last month, or if it has plateaued.
You can set targets and watch progress (for example, aiming for 70% of customer support tickets to involve Agentforce in some way by next quarter).
Worklytics also offers peer benchmarking, currently in beta, so you can compare your organization's AI usage with other organizations in aggregate. This external frame of reference can show whether your adoption is behind your peers, adding urgency to your efforts, or ahead of them.

A critical aspect of any analytics tool is privacy. HR and executives want adoption data, but not at the cost of employee trust.
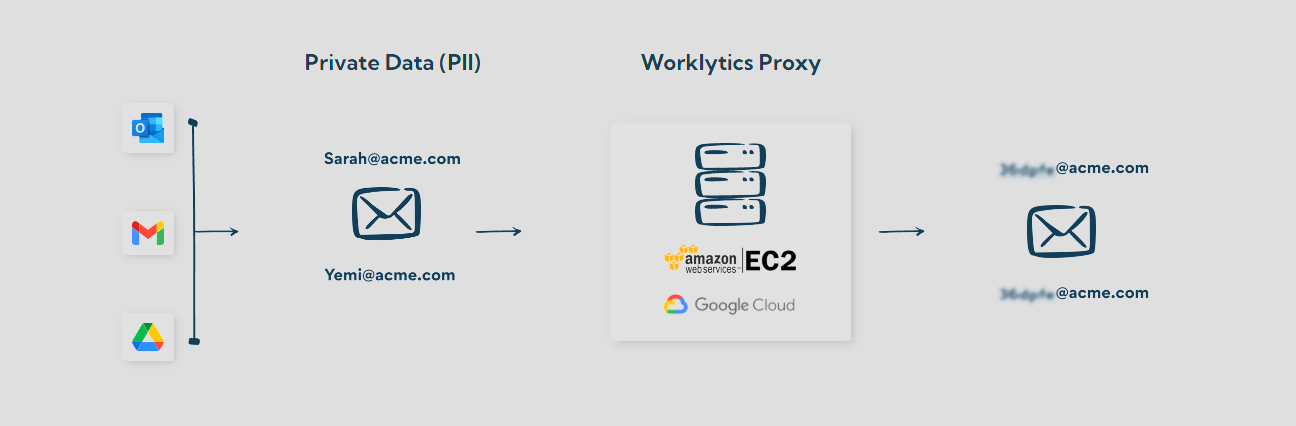
Worklytics is built with privacy by design. Personal identifiers are pseudonymized (hashed with SHA-256) before analysis, and results are only shown for groups above a minimum size (typically 5 to 8 people). You see that a team's Agentforce usage doubled after training, not how many times one named person used the AI today.
The goal is to obtain actionable metrics without compromising personal privacy. By keeping the data at a team or trend level, Worklytics helps companies avoid a "big brother" feel while still getting the benefits of measurement. This aligns with ethical people analytics practices: being transparent, fair, and focused on improvement, not punishment.
By using Worklytics to track Agentforce and other AI tools, companies get a unified, privacy-conscious view of how new technologies are being adopted. Instead of juggling separate reports from Salesforce, Slack and other tools, adoption for every team is in one place with context.
This helps answer the ultimate question: Is our AI tool truly making a difference? Compare Agentforce adoption by team with how that team's work changes over time, such as Salesforce activity, meeting load and focus time. If adoption is low, you have the data to find out why. If it is high, you know where to double down.
In Salesforce, open Agent Analytics in Agentforce Studio and check the Usage tab, which shows Unique Users, sessions and interactions. For per-user detail, the AI Agent Generative AI Usage data model in Data 360 records each interaction with a user ID. To compare adoption across teams and other AI tools, load that data into a work analytics platform such as Worklytics.
Agentforce Command Center launched with Agentforce 3 in June 2025. Salesforce now calls it Agentforce Observability. It includes Agent Analytics, session tracing, health monitoring and credit consumption tracking.
Not natively. You can export Agentforce usage events from Salesforce and bring them into Worklytics through its generic bulk import of AI work events. Worklytics then shows Agentforce adoption by team next to the other AI tools it measures, and it captures Salesforce CRM activity such as tasks, logged emails, calls and events.
Yes. Salesforce's usage data includes the user, so an analyst can group it by department, role or region in Data 360 Reports, Tableau Next or CRM Analytics. In Worklytics, adoption is broken down by team and role automatically using your HR data.
It shouldn't be. The goal is to see whether teams get value from the tool, not to watch individuals. Worklytics pseudonymizes personal identifiers with SHA-256 and only shows results for groups above a minimum size, typically 5 to 8 people.