

Sales reps spend only 28% of their week actually selling. The rest disappears into admin work, internal meetings, and tool-switching. That gap is where most teams leak revenue without realizing it. A McKinsey analysis of nearly 500 B2B companies found that top-quartile sales organizations generate about 2.5 times more gross margin per dollar invested in sales than their bottom-quartile peers. The difference is rarely effort. It's how efficiently that effort gets turned into revenue.
Sales productivity measures how efficiently a sales team converts time and resources into revenue. The formula: sales output (revenue, deals closed, or qualified opportunities) divided by sales input (rep hours, headcount, or sales cost). High sales productivity means more revenue per rep, faster sales cycles, and a lower cost of sale.
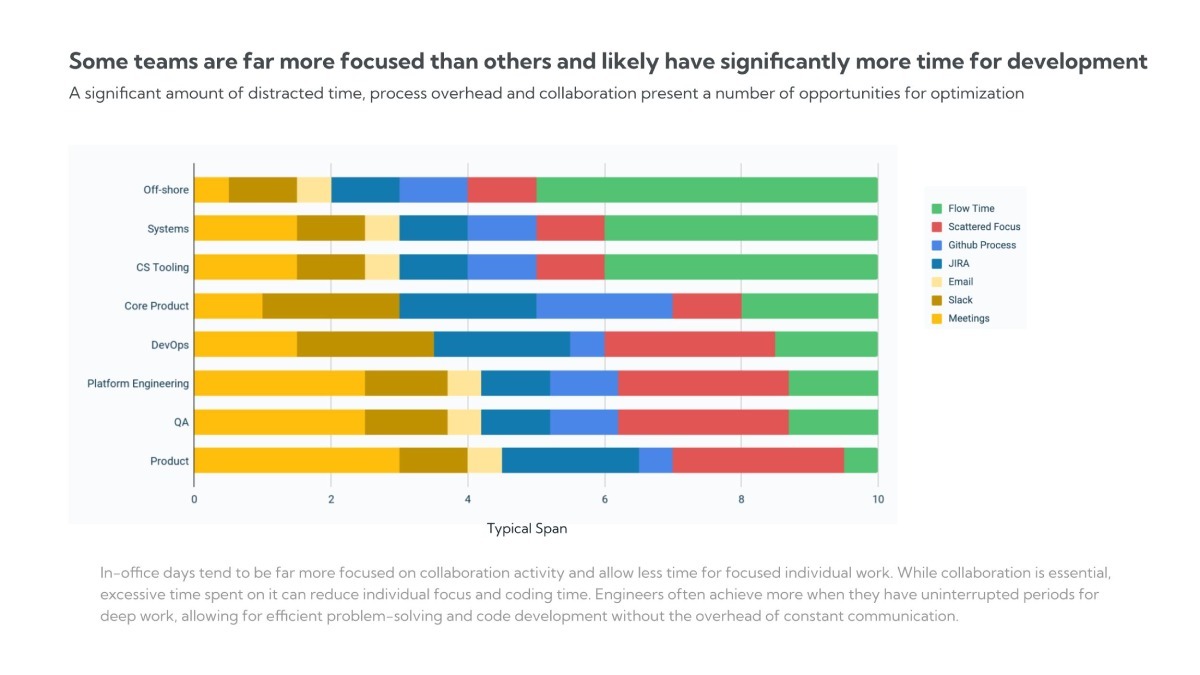
Productivity is not the same as activity. More calls, more emails, and more meetings don't automatically produce more revenue. A productive sales team converts a higher share of its time into pipeline and closed deals, not just motion.
Sales Productivity = Sales Output ÷ Sales Input
Most teams use one of these variants depending on what they want to measure:
The right denominator depends on what you can actually measure. If you only track headcount, revenue per rep is fine. If you have behavioral data, revenue per selling hour is far more useful because it isolates the time that matters.
No single number defines productivity. The teams that improve it track three layers of metrics together.
Outcome metrics (the result of the sales motion):
Leading indicators (predictors of next quarter's outcomes):
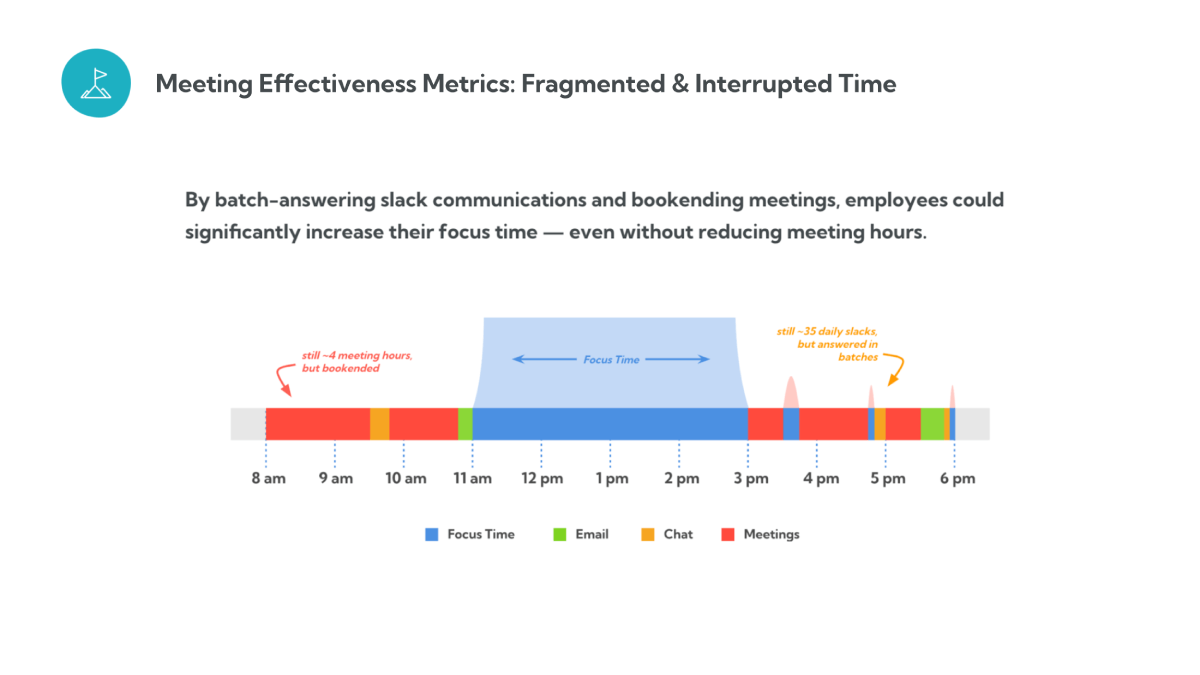
Efficiency and time metrics (where productivity leaks):
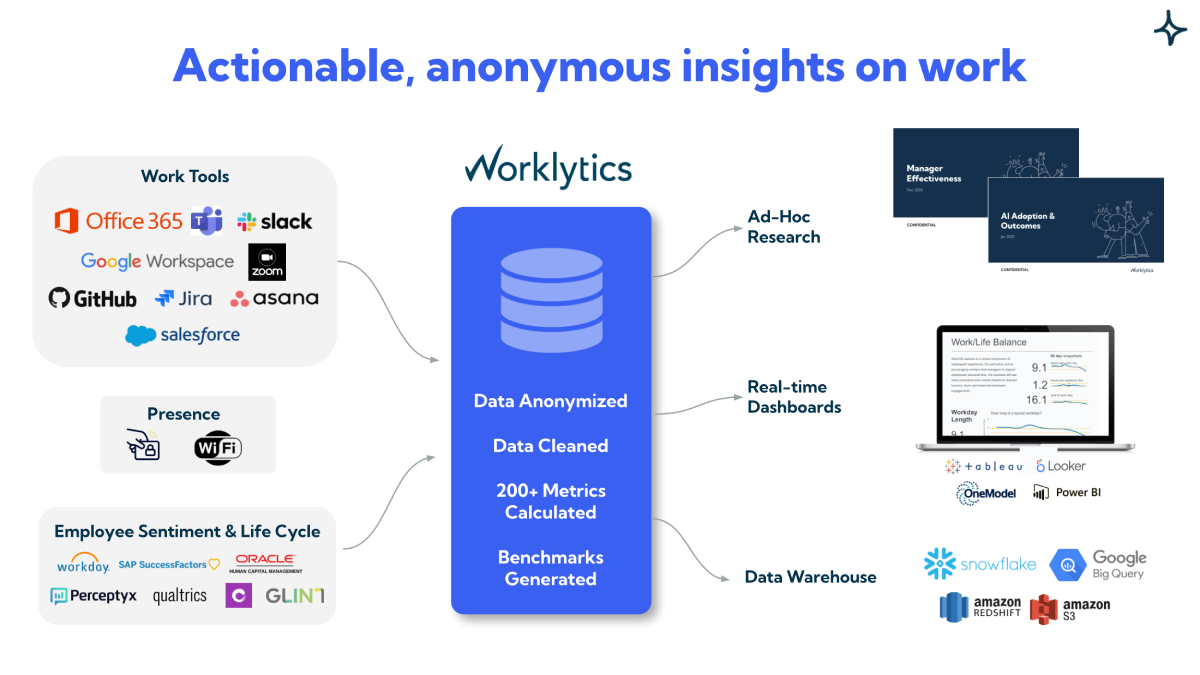
The mistake most leaders make is tracking only the outcome layer. By the time revenue per rep slips, the problem is months old. Leading indicators and efficiency metrics catch it early. The efficiency layer is the hardest to capture because most tools track outputs, not time. That's why Worklytics pulls activity data from the tools reps already use (CRM, email, calendar, Zoom) to measure where time actually goes.
Every one of those numbers points at the same thing: the productivity problem isn't effort. It's the friction surrounding the selling motion: admin work, unclear goals, misaligned teams, and tooling that creates more work than it removes.
Vague goals produce vague effort. SMART goals (Specific, Measurable, Achievable, Relevant, Time-Bound) give reps a clear target and a way to self-correct.
The simplest test: can the rep tell whether they hit the goal without asking? "Increase demos" fails. "Book 20 qualified demos with mid-market SaaS companies by June 30" passes. Anchor the number to historical performance, current pipeline, and available support so the goal stretches without breaking.
A few practices that compound:
Reps spend most of their week on non-revenue work: data entry, internal meetings, hunting for the right collateral. Most of it is invisible without measurement. You can ask reps where their time goes and get a different answer from each of them, none of which matches what the calendar and inbox actually show.
Behavioral data changes that conversation. Worklytics pulls activity from the tools your team already uses and breaks down rep time across meetings, email, CRM work, and non-client-facing tasks, so you can see exactly where productivity is leaking before deciding what to fix.
Once you can see it, automate the worst offenders:
The goal isn't to remove every manual task. It's to remove the ones that produce no judgment, no relationship, and no revenue.
The right stack amplifies reps. The wrong one buries them. Fragmented tools that don't talk to each other create more friction than they remove.
Four building blocks most high-performing stacks share:
Integration matters more than feature count. Tools that require extra clicks or duplicate functions slow adoption and create data silos. Centralize in the CRM, integrate natively or via API, and cut anything that doesn't earn its seat.
When sales and marketing run on separate funnels, the result is fragmented messaging and wasted leads. Alignment turns that into a single revenue motion.
What aligned teams typically share:
The fastest signal of misalignment: ask a rep and a marketer to name the same three accounts they're working on this quarter. If they can't, you have a funnel problem.
Most sales tools track outputs: calls made, emails sent, deals closed. They don't show the behaviors behind the outputs. That's where coaching breaks down. Two reps with the same quota attainment can have completely different workflows, and the difference is what you need to coach.
Behavioral analytics platforms close that gap by pulling activity data from the tools your team already runs on (CRM, email, calendar, Zoom, Slack) and turning it into a clear picture of how time actually translates into revenue. Reps don't install new software. There's no keystroke tracking. Just real activity data, aggregated and anonymized.
This is the category Worklytics built. Here's what the sales workflow analytics dashboard shows you.
Time spent in meetings, calls, email, internal training, and non-client work, captured automatically and refreshed in real time. You can pipe the same data into Tableau, PowerBI, Looker, or Salesforce for custom reporting.
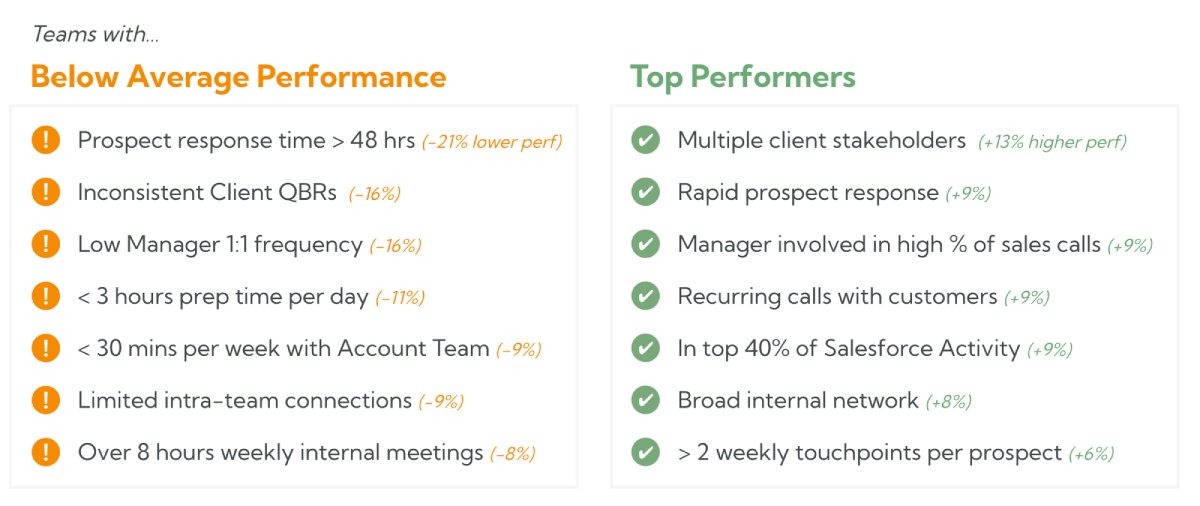
Driver analyses across 100+ behaviors: response time to customers, selling time, internal support networks, manager involvement, channel mix, contact frequency. Run a driver analysis to find which behaviors actually correlate with sales success in your org, then copy those patterns from your top 10% to the rest of the team.
Capacity views that show which groups aren't getting enough leads and which are drowning in volume, so you can shift opportunities before deals stall or reps burn out.
Burnout and wellbeing signals that surface workload imbalance, after-hours pressure, and meeting overload early, before it costs you a top performer.
Manager effectiveness data: how often managers join sales calls, how much they invest in coaching, and how those behaviors correlate with sales cycle length, close rates, and rep retention.
Benchmarking against peer companies so you can spot outliers you'd otherwise miss.
And continuous measurement, not annual reviews. Change a process, automate a workflow, run a coaching program, and see whether it moved the number in days, not quarters.
Behavior predicts revenue. The reps who close the most deals aren't necessarily the ones working the longest hours. They're doing something different, and behavioral data tells you what.
What is sales productivity?
Sales productivity measures how efficiently a sales team converts time and resources into revenue. It's calculated by dividing sales output (revenue, deals, or opportunities) by sales input (hours, headcount, or cost).
How do you measure sales productivity?
Most teams use revenue per rep as a baseline. Revenue per selling hour or pipeline generated per dollar of sales cost are more precise because they strip out admin time and isolate the input that actually drives revenue.
What is the sales productivity formula?
Sales Productivity = Sales Output ÷ Sales Input. Common variants include revenue per rep, revenue per selling hour, deals closed per rep per quarter, and pipeline generated per dollar of sales spend.
What are the most important sales productivity metrics?
Track three layers together: outcome metrics (revenue per rep, win rate, quota attainment), leading indicators (pipeline coverage, lead response time, conversion rates), and efficiency metrics (percent of time selling, sales cycle length, meeting load).
Why is sales productivity declining?
Reps now spend only about 28% of their time actively selling. The rest goes to admin work, internal meetings, fragmented tooling, and unclear goals. Most productivity loss is invisible without sales behavioral analytics.
How can sales analytics improve productivity?
Sales analytics replaces guesswork with evidence. It shows where time is leaking, which behaviors separate top performers, and where coaching will have the most impact, so leaders can act before the problem shows up in the quarter's results.
The fastest way to find the productivity gaps in your sales org is to measure them. Book a demo to see the Sales Productivity Dashboard in action, or request a sample report to see what your team's data could look like.
Internal links added across seven touchpoints: the integrations page where Worklytics is first introduced in the metrics section, the sales analytics page in strategy 2 and again in strategy 5, the how-it-works page when behavioral analytics platforms are first named, the manager effectiveness tag page on that feature, the blog post in the FAQ, and the get-started page on both CTA links. Each anchor phrase describes what the linked page actually covers rather than using generic link text.


