Organizational Network Analysis (ONA) operationalizes knowledge-sharing analytics by measuring how expertise and information flow through actual collaboration relationships. Treat ONA as a measurement system with a decision purpose and a short KPI set.
Surveys and documentation counts do not show whether knowledge reaches the teams that need it, when they need it. ONA fills that gap by modeling collaboration as a network and quantifying cross-team information flow.
Innovation measurement also requires discipline. The OECD Oslo Manual 2018 treats innovation as a measurable activity with consistent definitions and reporting expectations. Use ONA as a leading indicator system explicitly linked to measurable results, not as a visualization exercise.
Define knowledge sharing analytics as indicators that answer three operational questions:
ONA supports all three because it treats knowledge transfer as a flow through relationships. Knowledge sharing improves when cross-boundary links exist, those links are resilient (not dependent on a small set of people), and routing paths between key groups remain short.
Innovation depends on recombining knowledge across different parts of the organization. Research on the “strength of weak ties” is often referenced because it explains why boundary-spanning relationships accelerate the diffusion of information and opportunities.
A practical ONA program uses collaboration metadata that already exists in enterprise systems. The most common signals are:
For knowledge sharing analytics, prioritize completeness of coverage over novelty. If a large portion of cross-team work occurs in a tool that is not included, the network will underestimate boundary connections and misstate broker concentration. Apply basic data hygiene: filter automated or system-generated traffic, distinguish internal from external participants, and keep edge construction rules stable so trends are interpretable across periods.
A usable ONA program starts with four stable modeling decisions. These decisions determine whether the analysis produces comparable signals over time or devolves into one-off diagnostics that cannot support governance or executive decisions. Consistency across these choices is more important than precision at the outset.
Model individuals as nodes, then roll results up to teams, functions, or locations for decisions about operating model and work design. Individual-level modeling is required to capture emergent collaboration patterns that are invisible at aggregate levels. Aggregation should occur only after network measures are computed to preserve structural accuracy.
Define connections using collaboration metadata and state the rule precisely:
Edge definitions determine what the organization considers meaningful knowledge exchange versus background activity. Inconsistent or loosely defined edge rules introduce noise that distorts comparisons across time periods and segments. Choose one edge rule set per business question and keep it constant for a reporting cycle.
Use windows that match how work is managed:
Time window selection directly affects sensitivity versus stability in network measures. Short windows surface rapid shifts but exaggerate volatility, while longer windows smooth noise and reveal persistent structural patterns. Mixing window lengths within the same analysis undermines interpretability.
Segment by the boundaries you manage: function, product line, geography, level, tenure. Segmentation aligns ONA results with real decision rights and accountability structures. Without segmentation, organization-wide averages obscure where knowledge flow is constrained or overly dependent on a small subset of actors.
You do not need dozens of network measures. Use metrics with direct management meaning, then convert them into a small KPI set.
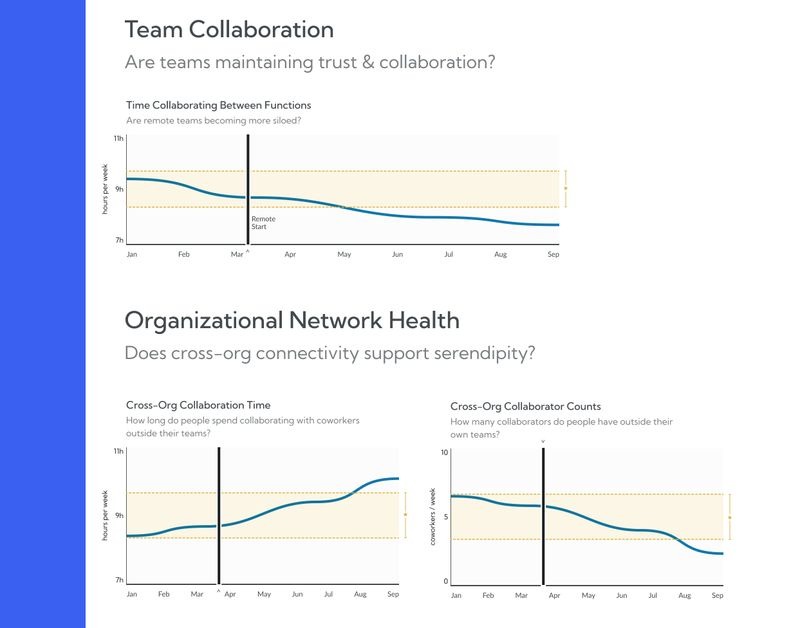
Measure density across key boundaries (function-to-function, region-to-region, product-to-product). Cross-boundary density is where silos show up.
Decision use: low cross-boundary connectivity points to an operating model problem (ownership, interfaces, integration roles), not a communications problem.
Use betweenness-type measures to identify whether cross-boundary flow depends on a small number of brokers. High concentration indicates a single point of failure and a predictable burnout risk.
Decision use: reduce dependency by creating redundancy, formalizing communities of practice, and ensuring critical routes have more than one viable path.
Use path length (or related reachability measures) between priority groups to quantify routing distance to expertise.
Decision use: rising discovery friction indicates degraded discoverability. Interventions include clarifying ownership, simplifying escalation paths, and improving internal findability.
For leadership reporting, keep to three core KPIs. These indicators translate network science into signals that align with operating model decisions and accountability structures. Limiting the KPI set ensures focus on levers leadership can directly influence rather than descriptive analytics.
Each KPI must have a clearly assigned owner, a defined threshold that triggers intervention, and a standardized response playbook. Without ownership and action thresholds, network indicators remain observational and fail to influence organizational outcomes.
ONA measures collaboration structure. Innovation governance evaluates outcomes. Connect the two with a tiered design.
Use indicators you already defend in leadership reviews, such as delivery cycle time, reuse rate of internal assets, and cross-team throughput for work that spans functions.
Interpretation rule: treat ONA as useful when network shifts precede durable changes in these outcomes, not when a network map looks intuitive. If network scores move without any operational decision being taken, the measurement is not yet connected to management.
To convert ONA into an operating rhythm, formalize three elements: cadence, thresholds, and decision ownership.
Cadence
Thresholds
Set numeric thresholds that trigger action, not discussion. A broker concentration index above the defined ceiling triggers a redundancy plan. A boundary connectivity score below the defined floor triggers an operating model review for that interface. A sustained increase in discovery friction triggers a decision on ownership clarity and knowledge infrastructure.
Decision ownership
Assign owners who can change the system: operating model owners, functional leaders, and transformation leads. Knowledge-sharing analytics cannot be improved by reporting alone. It improves when owners execute interventions and you re-measure to verify sustained change.
Knowledge sharing analytics fails when employees experience it as surveillance. Governance must be designed as a foundational control, not a compliance afterthought, to ensure sustained trust and participation. The objective is to measure organizational patterns while explicitly preventing individual-level monitoring or misuse.
Align governance to the NIST Privacy Framework, which treats privacy as an enterprise risk management discipline. This approach ensures privacy risks are identified, assessed, and mitigated alongside operational and security risks. Applying a formal framework also enables consistent decision-making as data sources, analytics scope, and organizational needs evolve.
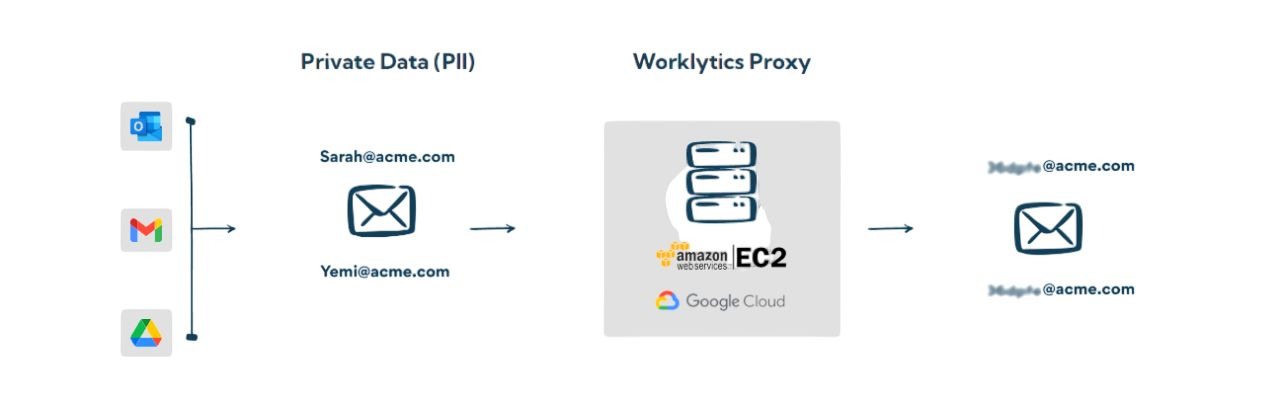
Use only the interaction metadata required to model collaboration patterns. Excluding message content reduces exposure, simplifies governance, and reinforces that the intent is structural analysis rather than behavioral inspection. Retention periods should align strictly with analytic time windows to prevent unnecessary data accumulation.
Pseudonymisation reduces identifiability while preserving analytic value for segmentation and trend analysis. It supports responsible analysis at scale without introducing unnecessary personal data risk. Because pseudonymised data remains regulated personal data in many regimes, purpose limitation, access controls, and documented use cases must remain enforced.
Document allowed uses (organizational design, change management, collaboration health) and prohibited uses (individual performance scoring based on message volume or response latency). This boundary determines whether employees trust the system.
If the priority is operational measurement rather than building and maintaining custom analytics pipelines, Worklytics provides an enterprise-grade platform purpose-built for Organizational Network Analysis at scale. The platform is designed to operationalize knowledge sharing analytics by combining broad data coverage, rigorous privacy controls, and decision-ready network metrics in a single system. This enables organizations to move beyond exploratory analysis and treat ONA as a governed, repeatable management capability.
Worklytics offers pre-built connectors for 25+ work platforms, enabling passive and comprehensive ONA data collection across collaboration systems such as Slack, Google Workspace, Microsoft 365, email, and calendar. This breadth of integration ensures that cross-boundary knowledge flow is captured where work actually happens, reducing analytical blind spots caused by tool fragmentation or partial data coverage.

Worklytics includes built-in anonymization and pseudonymization controls, including the ability to anonymize data at ingestion before analysis and to apply persistent pseudonyms for longitudinal and segmented analysis. These capabilities allow organizations to analyze structural collaboration patterns while maintaining strict safeguards against individual-level monitoring, reinforcing trust and regulatory alignment.
Worklytics supports historical network reconstruction from enterprise collaboration systems, enabling analysis of collaboration patterns over multi-year periods, including up to three years of historical data. This longitudinal perspective is critical for distinguishing structural change from short-term variation, particularly following reorganizations, integrations, or shifts in operating model.
Worklytics computes core ONA metrics such as degree, eigenvector centrality, and betweenness centrality at enterprise scale and surfaces them through continuously updating dashboards. These dashboards are designed for executive consumption, allowing leaders to monitor changes in connectivity, broker dependency, and discovery friction as ongoing operational signals rather than static reports.
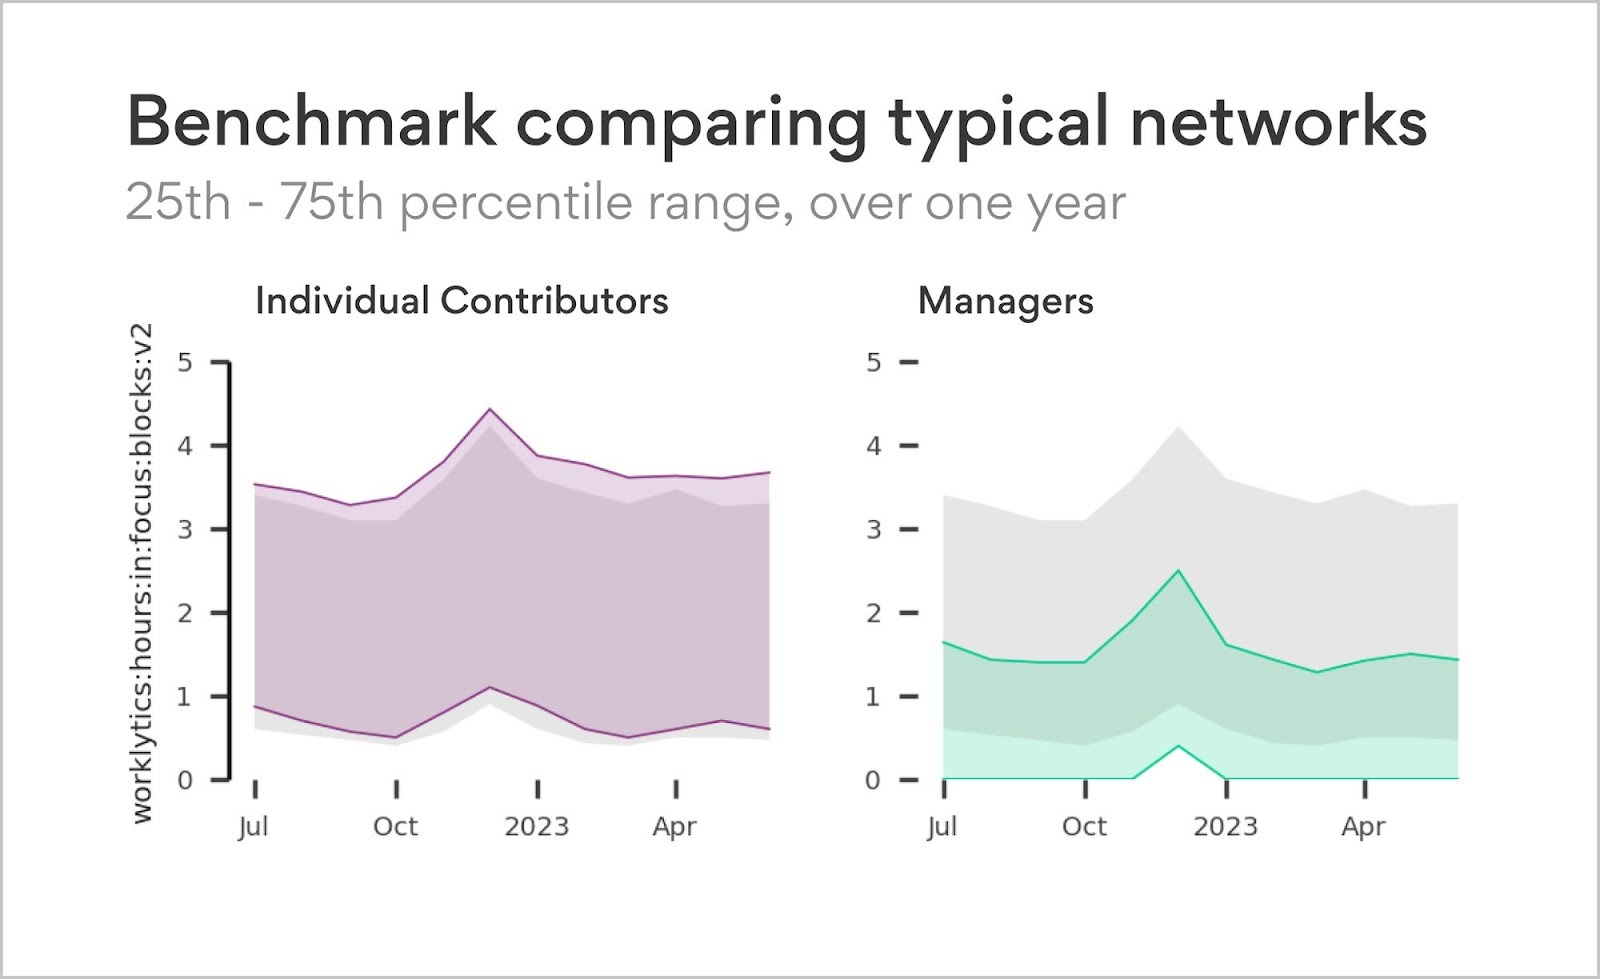
Worklytics provides benchmarking capabilities across roles, functions, and peer organizations, enabling teams to contextualize network measures and set informed performance targets. Benchmarking elevates ONA from descriptive analytics to a comparative management tool, supporting prioritization of interventions where improved knowledge flow will have the greatest organizational impact.
Used effectively, Worklytics enables organizations to institutionalize ONA as a core component of knowledge-sharing analytics. Rather than producing one-off network studies, teams can establish an ongoing measurement system that informs operating model decisions, mitigates collaboration risks, and supports sustained innovation by improving knowledge flow.
What is the difference between knowledge sharing analytics and ONA?
Knowledge sharing analytics is the measurement objective (discovery, diffusion, reuse). ONA is the method that models collaboration relationships and quantifies those objectives.
Do you need message content to measure knowledge sharing?
No. Use interaction metadata to model patterns of collaboration. Content inspection is not required for the KPIs used in organizational decisions.
Which KPIs should leadership review first?
Boundary connectivity, broker concentration, and discovery friction. Together, they cover silos, single points of failure, and expertise routing inefficiency.
How often should the ONA be reviewed?
Review leading indicators monthly. Use quarterly reviews to compare segmentation and make operating model decisions. Use annual views for structural change detection.
Can ONA be used for individual performance evaluation?
Do not use ONA for individual performance scoring. Use it to improve the system of work by reducing bottlenecks and strengthening cross-team connectivity.
How do you keep an ONA program compliant and trusted?
Use purpose limitation, data minimization, pseudonymisation, restricted access, and documented acceptable uses, aligned to a privacy risk framework and regulator guidance.