

Burnout rarely happens overnight. In today’s organizations, it builds up quietly through countless “small” interruptions such as ad-hoc calls that break focus, meetings that fragment the day into 15-minute slivers, and late-night messages that pull people back online. Over time, these moments accumulate into a state of collaboration overload.
Before we dive in, let’s align on what burnout actually is. It’s not a personal weakness; it’s a work-related phenomenon. The World Health Organization classifies burnout in the ICD-11 as a syndrome resulting from chronic workplace stress that has not been successfully managed. See the official ICD-11 definition for details.
With that foundation, this article explores how to measure collaboration overload, how to change it, and how leaders, HR, developers, business analysts, and people analytics teams can work together to prevent burnout by redesigning collaboration itself.
Collaboration overload happens when the volume and velocity of collaborative activity exceed a team’s cognitive bandwidth. In practice, it shows up as:
Recent, large‑scale telemetry from the Microsoft Work Trend Index makes the pattern visible:
People receive heavy volumes of email and chat, a high share of meetings are ad hoc with no invite, and interruptions are measured in minutes, not hours. The report also documents the “triple‑peak” day, with late‑evening spikes in activity.
You do not need a PhD in cognitive science to feel what context switching does to your brain. Jumping between apps and meetings forces your executive function to reconfigure plans, retrieve context, and reset social posture.
That consumes energy, increases error rates, and reduces the time available for deep work. When the collaboration layer is noisy and unpredictable, stress becomes chronic, and the WHO’s three features of burnout appear: exhaustion, mental distance from work, and reduced effectiveness.
You can reduce overload once you can measure it. Start with a simple frame that any analyst can implement:
Collaboration Load = Volume × Velocity × Variability
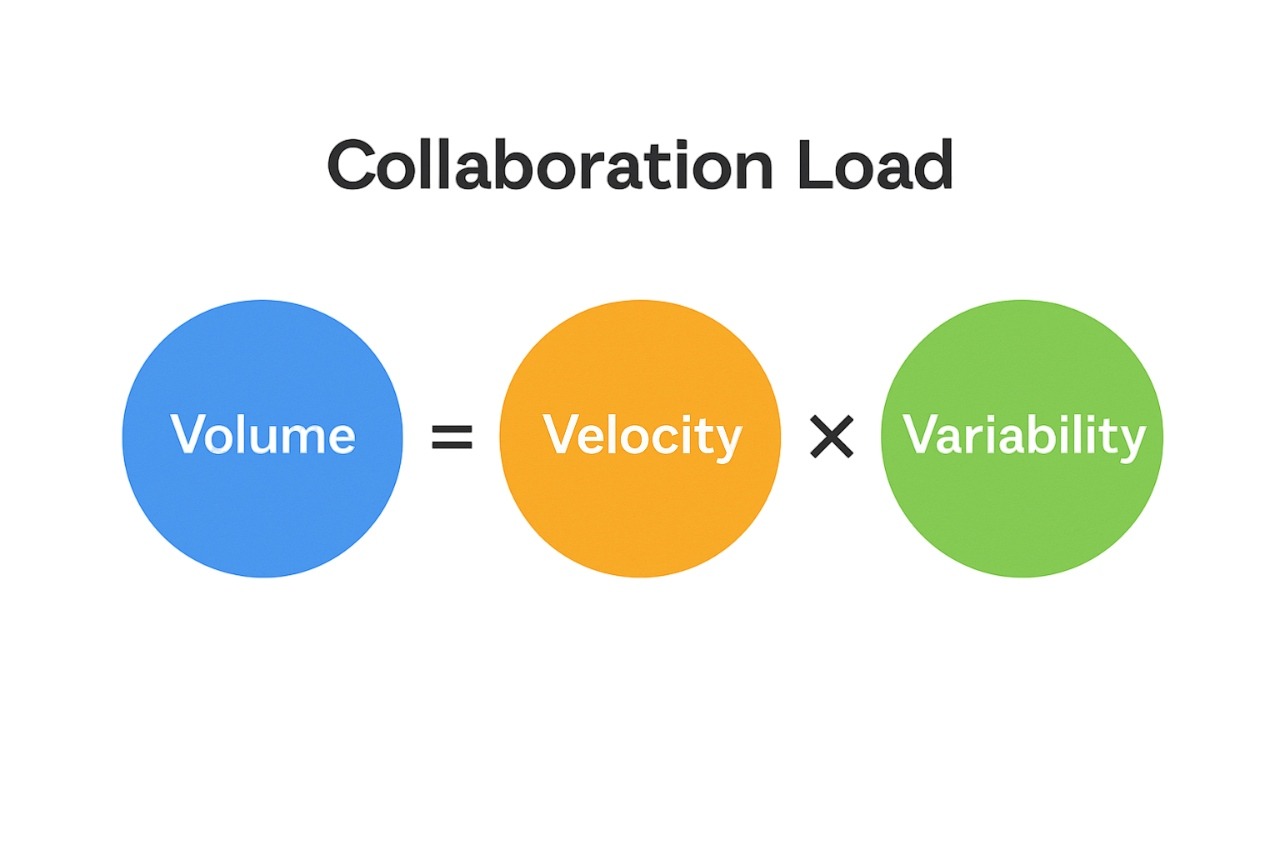
The Work Trend Index provides reference points you can benchmark against for ad‑hoc meeting rates, interruptions, and after‑hours activity.
You do not need a full data science team to begin. Start with seven lightweight indicators you can compute from common workplace systems:
These seven fit into most analytics stacks that already ingest calendar and messaging metadata. They are explainable to executives, actionable by managers, and meaningful to developers who feel the day being chopped into fragments.
1) Protect focus time.
Default to focus blocks in prime windows and move status updates to asynchronous channels. For developers, this can be a team-wide standard, such as “no meetings Tue/Thu mornings,” plus code-review windows in the afternoon.
2) Make working agreements explicit.
Team-level agreements set response-time expectations, define when chat is for asynchronous vs. real-time communication, and clarify when to escalate to a call. Atlassian’s play is a good template that any team can adapt.
3) Redesign meetings.
Meetings are essential for alignment, but they often become the biggest source of wasted time and fatigue. The goal is to make them leaner, more intentional, and easier to recover from. Redesign your meetings through these practical changes:
5) Normalize recovery.
Leaders should model true offline time. Some jurisdictions are moving toward “right to disconnect” policies; even without regulation, internal norms that protect evenings and weekends support well‑being. The APA’s 2024 materials highlight psychological safety as a key cultural pillar.
6) Design for employee well-being
Build systems of work that protect energy, not just productivity. Design collaboration norms, workloads, and communication rhythms that allow employees to recover, focus, and feel supported in how they work—not just how much they deliver.
Healthy collaboration isn’t about constant availability or endless connection. It is about rhythm, clarity, and respect for focus. Teams that collaborate well balance accessibility with protected time for deep work. In practice, it looks like this:
Preventing burnout starts with visibility. Worklytics helps organizations move beyond guesswork by quantifying how collaboration happens across tools like Slack, Google Workspace, Microsoft 365, and Jira. Its analytics platform transforms raw activity data into clear, actionable insights about meeting load, communication flow, and focus time. By surfacing these patterns, Worklytics enables leaders to redesign workflows, rebalance workloads, and create healthier systems of work where employees can stay engaged and productive without burning out.
Worklytics makes it simple to build passive ONA datasets by tapping into more than 25 popular work platforms, such as Slack, Google Workspace, Office 365, and Teams. It anonymizes data at the source and uses metrics like in-degree, betweenness centrality, and network density to illustrate how information flows across teams and where bottlenecks or silos might be limiting productivity.

In hybrid or remote environments, keeping tabs on work habits is essential. Worklytics gives leaders visibility into how the workday actually unfolds — how much focus time is available, how often distractions creep in, and what patterns show up when people reach their mental limits. With this visibility, teams can redesign collaboration norms and reclaim cognitive space.
Rather than relying solely on retrospective surveys, Worklytics uses collaboration signals to flag early warning signs of stress and overload. For example, elevated meeting volume, declining focus blocks, and frequent after-hours work are highlighted so HR and people analytics teams can intervene proactively.
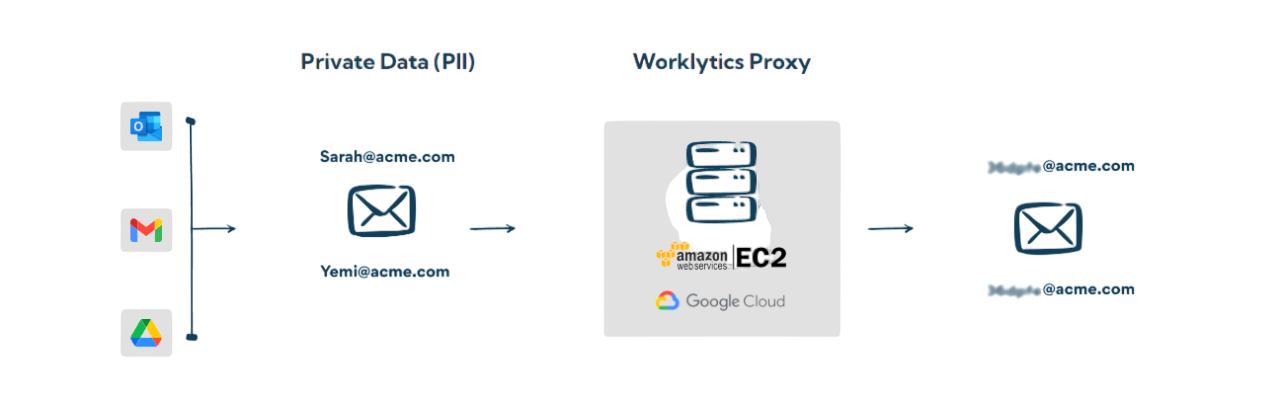
Traditional analytics can feel invasive or reactive, but Worklytics is designed with privacy as a core principle. It aggregates and anonymizes data at the team level, allowing organizations to understand network health and collaboration structures without exposing personal information. This privacy-preserving approach builds trust and transparency while still giving executives the insights needed to strengthen alignment, speed, and accountability.
Change management is accelerated when you have current data to act on. With Worklytics, dashboards update as collaboration networks evolve, enabling leaders to measure the impact of interventions — such as meeting redesigns or new communication norms — and refine strategies when they fall short.
Finally, Worklytics doesn’t just optimize workflows; it helps shape culture. By mapping collaboration and network strength, the platform uncovers patterns linked to belonging, hidden influencers, mobility opportunities, and retention risk. This enables organizations to build healthier systems of work that support long-term performance. focus, clarity, and recovery time needed to deliver consistently high results without burning out in the process.
Worklytics turns collaboration data into clarity, giving leaders the insight to build healthier, more productive organizations. Discover how visibility can drive sustainable performance and prevent burnout. Request a Worklytics demo today.


