TLDR: A manager effectiveness scorecard tracks how each manager supports their team, one measure at a time. What to know:
Your engagement survey says one team is struggling, but not why. Its manager says the team is fine. A scorecard built from how the team actually spends its week shows what is behind the survey result: 1:1s that keep getting cancelled, a calendar with no time to focus or messages that arrive late every night.
This guide lists the metrics for a manager effectiveness scorecard, shows an example layout, and explains how to set targets, use benchmarks and run reviews.
A manager effectiveness scorecard is a short set of measures, shown side by side for each team, that tracks how a manager supports the team week to week. Manager effectiveness has several parts, and a single blended score hides which part needs work. A scorecard keeps the measures separate, so a manager can see, for example, that 1:1s are steady but the team's focus time is shrinking.
Surveys tell you that a team is struggling. A scorecard built from work patterns helps explain why, and it updates every week instead of once a year.
The metrics below map to five manager habits, explained in depth in our post on manager effectiveness metrics that matter more than eSat scores:
Google's Project Oxygen reached a similar list. Google analyzed over 10,000 data points about its managers and found 10 behaviors of highly effective managers, including being a good coach, empowering the team without micromanaging and collaborating across the company.
Each metric is calculated per team, over a week or 4 weeks, from data most companies already have. Reporting lines from the HR system matter: without them you cannot tell a manager's 1:1 from any other 1:1.
Start with five or six of these, not all twelve. Add more once managers trust the first ones.
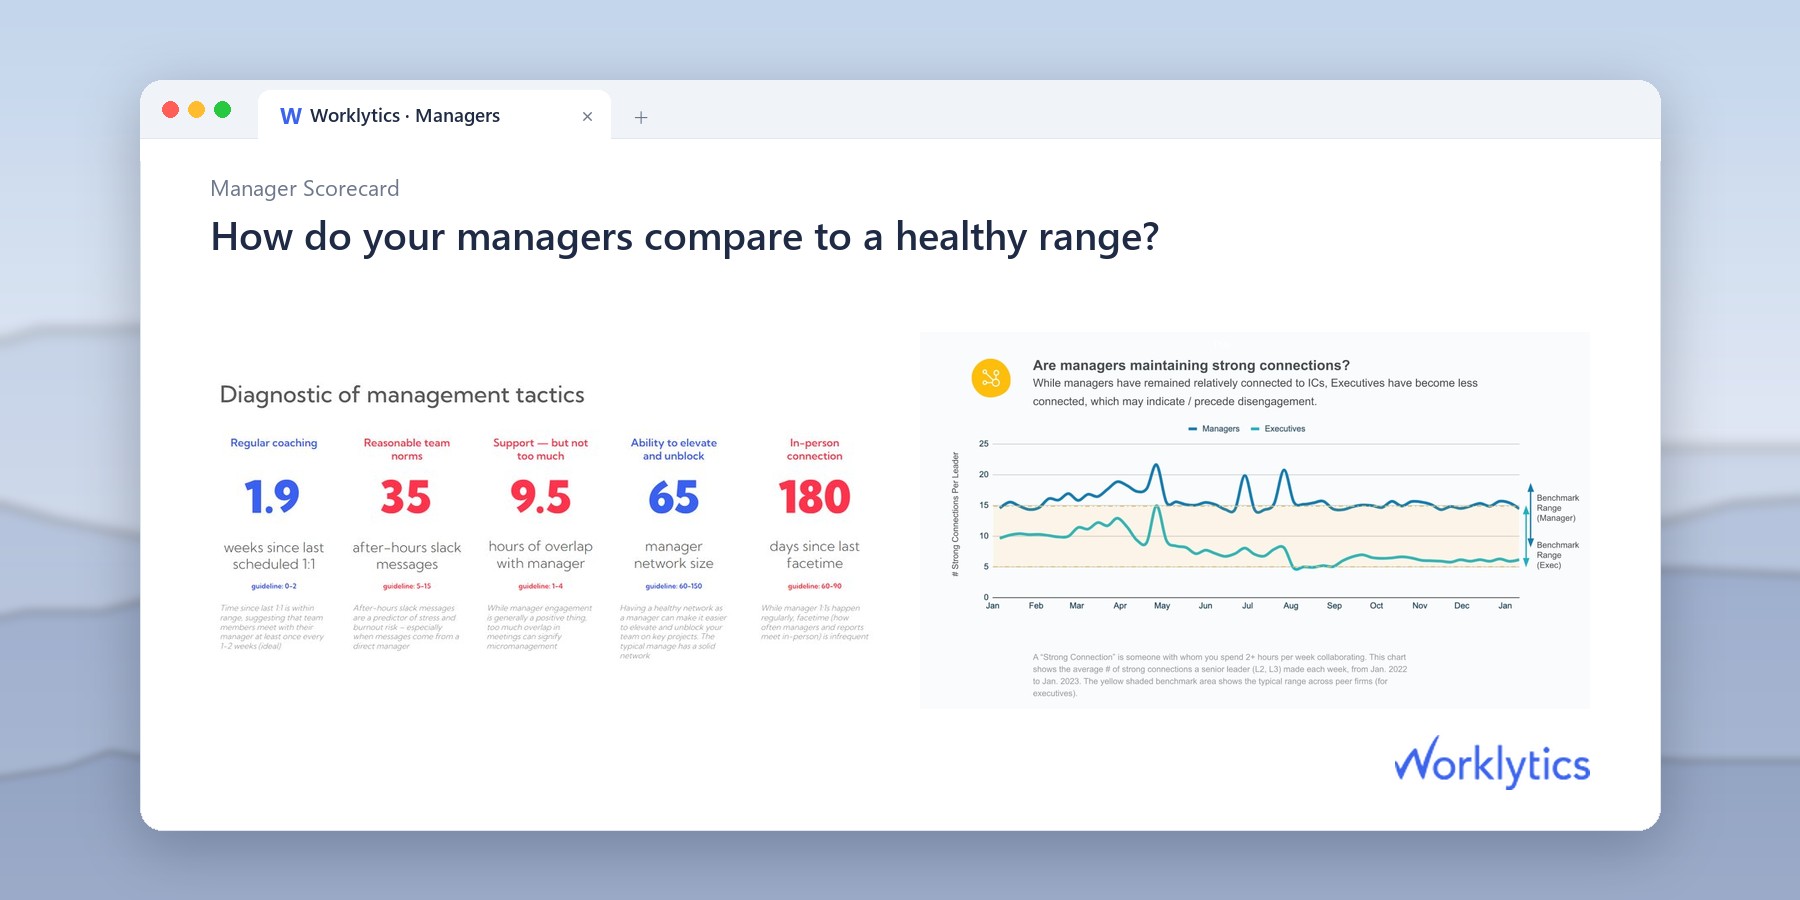
One row per metric for each team, with the organization median for context and the trend over the last 12 weeks. The numbers below are made up, and the flags are examples to adapt, not industry benchmarks.
Reading this example: the team gets more 1:1s than the median, but its focus time is falling and its manager joins far more of its meetings than most managers do. That is the conversation to have, not the 1:1 count.
Published benchmarks for manager metrics often have no source or come from very different companies. Set targets from evidence you can check:
There is no single right number of 1:1s. A new team member or a struggling project usually needs more; an experienced team on steady work may need fewer. Rather than a fixed target, watch three things together: 1:1s per direct report, cancelled 1:1s and weeks since each person's last 1:1. The last one finds the people who are being skipped while the team average looks fine.
Span of control is the number of people who report directly to a manager. A manager with many direct reports has less time for each 1:1 and each team meeting, so read the coaching metrics next to it. Split the count into individual contributors and managers, because managing managers takes a different kind of time.
For ways to help managers improve once you see the gaps, see how to improve manager effectiveness.
Measure teams, not individuals, and never use message or document content. Worklytics strips personal identifiers when data is first collected, shows results only for groups with at least 8 people and does not process or store any work or message content, as its privacy page explains. Tell managers what is measured and why before the first scorecard goes out.
Worklytics connects to over 25 work tools, then anonymizes, cleans and aggregates the data into more than 400 metrics (how it works). The manager metrics in the table above, including manager 1:1s, cancelled 1:1s, weeks since the last 1:1, manager and skip-level co-attendance, after-hours messages from the manager, focus and fragmented hours, collaboration with other groups and span of control, are part of its metric catalog. See the Worklytics Manager Scorecard for how the results are presented.
Start with manager 1:1s per direct report, cancelled 1:1s, how often the manager joins team members' meetings, team focus time, after-hours messages from the manager and collaboration with other groups. Add retention and engagement as outcome measures, so you can check which habits matter in your organization.
A management scorecard is a short set of measures, shown side by side for each manager or team, that tracks how a manager supports the team: how often they coach, how they protect the team's time and how they connect it to the rest of the company. It keeps the measures separate instead of blending them into one score.
Be careful with published figures: many have no source. The most reliable comparison is your own organization's median and quartiles, by function, over time. Benchmark data from a vendor that collects manager metrics across many companies can add an outside view.
There is no single right number; it depends on the role and the team. Many teams aim for weekly or every other week. Track the count per direct report, cancellations and weeks since the last 1:1, and look for people who are being skipped.
It works best as a coaching tool. Share it with the manager first and agree on one change at a time. If the scorecard decides ratings or pay, managers will work on the numbers instead of the habits behind them.