In today’s software-driven world, engineering productivity functions as a direct driver of business performance. Companies allocate substantial budgets to software development, and executives expect these investments to produce measurable value.
Data from top-quartile engineering organizations confirms this link:
Teams with higher scores on the Developer Velocity Index generate revenue growth four to five times faster than competitors, along with stronger innovation output and shareholder returns.
These outcomes occur because faster delivery cycles, fewer quality issues, and more efficient collaboration reduce time-to-market and increase the volume of customer-impacting improvements.
Yet, despite its financial impact, software development has historically been “perennially undermeasured.”
Other business functions have long relied on established performance indicators, while engineering orgs lack equally standardized measures.
Organizations can effectively evaluate engineering productivity using multidimensional frameworks.
Modern research emphasizes evaluating factors such as delivery speed, code quality, collaboration patterns, operational reliability, and developer experience because each dimension reflects a distinct contributor to business value.
When these indicators are combined, they provide a more accurate view of how efficiently teams convert time and resources into customer-impacting outcomes. The following sections outline the specific metrics and methods that enable this structured, evidence-based approach to measuring and improving engineering productivity.
Below is a short, practical set of metrics derived from Worklytics Engineering Effectiveness, selected to illuminate code review flow, collaboration load, focus time, and where engineering hours actually go. Each metric is defined briefly so you can instrument it quickly and review trends at the team level. Prefer medians and trendlines, and treat these measures as indicators that guide improvements rather than targets for individuals.
What it shows: The elapsed time from pull request creation to merge.
Why it matters: Captures end‑to‑end friction in the developer loop and is a direct signal of delivery flow health. Shorter cycle times usually reflect clearer ownership, right‑sized PRs, and fewer review or CI delays.
What it shows: Hours between PR creation and the first reviewer response.
Why it matters: Long waits stall momentum and inflate total cycle time. Monitoring this lets you spot review bottlenecks and rebalance review load when needed.
What it shows: Average number of substantive code reviews completed by each engineer in a period.
Why it matters: Helps ensure review work is shared, not concentrated. Balanced participation reduces queues and keeps knowledge spread across the team.
What it shows: Open PRs divided by the number of contributing engineers.
Why it matters: A rising backlog signals review debt or too much work in progress. It is an early warning that context switching will grow and throughput will fall.
What it shows: How long tickets or tasks sit in each workflow state, especially “In Review”, “Blocked”, or “Waiting on Others”.
Why it matters: Makes bottlenecks visible so you can fix the slowest handoffs and remove cross‑team friction.
What it shows: Total scheduled meeting time per engineer per week.
Why it matters: High collaboration load limits maker time and slows delivery. This metric supports meeting hygiene changes and async alternatives.
What it shows: Uninterrupted blocks of heads‑down work, typically 60–120 minutes or longer.
Why it matters: More sustained focus correlates with faster problem solving and fewer defects. Use it to protect maker blocks and reduce calendar fragmentation.
What it shows: Percentage of work activity that occurs outside agreed business hours.
Why it matters: Persistent after‑hours activity is a sustainability and burnout risk. It also points to upstream planning or staffing gaps.
What it shows: Where engineering time is spent across internal organizations and customers.
Why it matters: Quantifies who consumes the most engineering capacity so you can reset interfaces, improve documentation, or add self‑service where requests are heavy.
What it shows: Items completed per week or sprint at the team level.
Why it matters: Pairs with cycle time and WIP to reveal capacity trends without rewarding busywork. Track it alongside the metrics above so speed never hides quality or sustainability issues.
In summary, measuring software engineering productivity requires a balanced scorecard. You should capture how much value is delivered, how quickly it’s delivered, how reliable the deliveries are, and how healthy and effective the team's work process is. No single number will capture all of this, but a handful of key metrics in each area will. With these measurements in hand, the next step is to use them to drive improvement.
Improving engineering productivity starts with understanding how much inefficiencies actually slow teams down. Studies across software organizations show that developers lose between 40-60 percent of their potential productive time due to waiting on reviews, environment delays, unclear requirements, context switching, excessive meetings, and manual processes.
Metrics bring these issues into focus, but the real gains come from addressing them directly. The following strategies provide detailed guidance on identifying the causes of slowdowns and improving overall delivery performance.
Bottlenecks typically cause the largest productivity losses. Even a single slow stage can extend the entire delivery timeline and delay every feature behind it.
How to identify bottlenecks with real clarity:
Examples of common bottlenecks and how to address them:
Why this matters:
Removing bottlenecks reduces overall cycle time and increases throughput. It also decreases the number of work items in progress, reducing context switching and improving predictability.
Tools shape engineers' daily workflow. When the toolchain creates friction, even small tasks take longer and require more manual effort. Strong automation removes that friction and gives teams predictable, repeatable processes. Integrating insights from an AI software consultancy can further enhance these workflows by identifying inefficiencies, recommending intelligent automation strategies, and implementing AI-driven tools that adapt to evolving development needs. This not only reduces operational overhead but also empowers teams to focus on innovation and higher-value problem-solving.
High-impact areas for automation:
How to choose the right tools:
Result:
Teams with strong automation see faster delivery, more reliable releases, and less stress during staging or production cycles.
Focus is the biggest predictor of engineering output. A single interruption can cost 20 to 30 minutes of recovery time. Frequent context switching can double or triple delivery time for even simple tasks.
Common sources of distraction:
Strategies to protect focus time:
Using analytics to address focus problems:
Outcome:
More uninterrupted focus leads to better code quality, faster completion, and fewer bugs, thereby reducing time spent on rework.
Culture influences how teams communicate, escalate issues, and support each other. A healthy engineering culture removes friction, increases collaboration, and enables engineers to be more effective with less effort.
Key cultural practices that drive productivity:
Specific examples of cultural improvements:
Impact:
A supportive culture increases trust, reduces unnecessary overhead, and helps teams maintain a steady, sustainable pace.
Productivity improvement is a continuous process. What works today may not work six months from now as the team grows or the product evolves.
How to operate an iterative improvement cycle:
Examples of iterative improvements:
Outcome:
Teams learn what actually drives performance, avoid guesswork, and build long-term habits that create measurable improvements.
Worklytics integrates with more than 25 tools in your tech stack, including GitHub, Jira, Google Workspace, Microsoft 365, Slack, Zoom, and others. This creates a single unified view of how engineering work happens across code commits, issue tracking, communication channels, and calendars. With all data in one place, leaders can see the full workflow without jumping between disconnected dashboards.
Worklytics surfaces collaboration signals such as meeting volume, Slack activity, shared documents, and cross-team interactions. These patterns reveal where engineers may be losing focus time or experiencing unnecessary context switching. By understanding how teams collaborate, you can identify when productivity drops due to meeting overload, excessive dependencies, or fragmented workflows.

Worklytics provides benchmarking against internal teams or industry peers. This allows you to see when engineering teams spend significantly more time in meetings, take longer to resolve issues, or have heavier after-hours workloads compared to similar organizations. These insights help leaders set improvement targets while also identifying areas that impact employee well-being, such as meeting pressure or workload distribution.
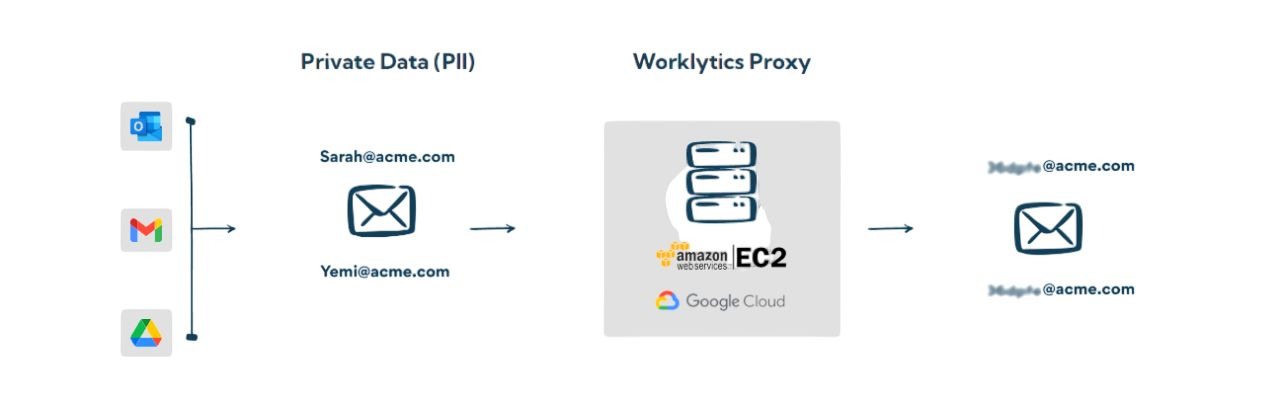
Worklytics is designed with privacy protections at the core. All data is aggregated and anonymized to focus on team-level trends rather than individual behavior. This approach maintains trust with engineering teams and ensures leaders use analytics to improve systems and processes rather than monitor people. Privacy controls and role-based access reinforce this trust-centered approach.
Worklytics transforms raw activity signals into clear and actionable insights. These include trends in focus time, cycle times, workday intensity, collaboration networks, and tool adoption patterns. These insights help engineering leaders understand the underlying reasons productivity is changing, rather than just presenting surface-level data.
Real-time dashboards provide visibility into key engineering metrics such as code throughput, issue age, meeting load, and cross-team dependencies. This enables continuous monitoring rather than waiting for static quarterly reports. Leaders can launch improvement initiatives and immediately track their effects through clear, measurable indicators.
With a complete view of engineering operations, Worklytics helps pinpoint bottlenecks such as long cycle times, meeting saturation, process friction, or unclear ownership. Once identified, teams can redistribute work, adjust processes, reduce meeting volume, or strengthen tool usage. The impact of these actions can then be tracked in real time through Worklytics metrics.
If you are ready to build a more efficient, engaged, and high-performing engineering organization, now is the time to put your data to work. Worklytics gives you the visibility and clarity you need to remove friction, strengthen collaboration, and unlock the full potential of your software teams. Do not wait for productivity issues to surface before acting. Take control with real insights that drive real improvement. Explore how Worklytics can transform your engineering operations and help your teams do their best work.