
Hello!
This month's Worklytics updates make it easier to see what's happening across your organization and turn behavioral data into clear, targeted action—from a new pulse-check landing page to deeper visibility into how AI is shaping work.
Scroll on for details 👇
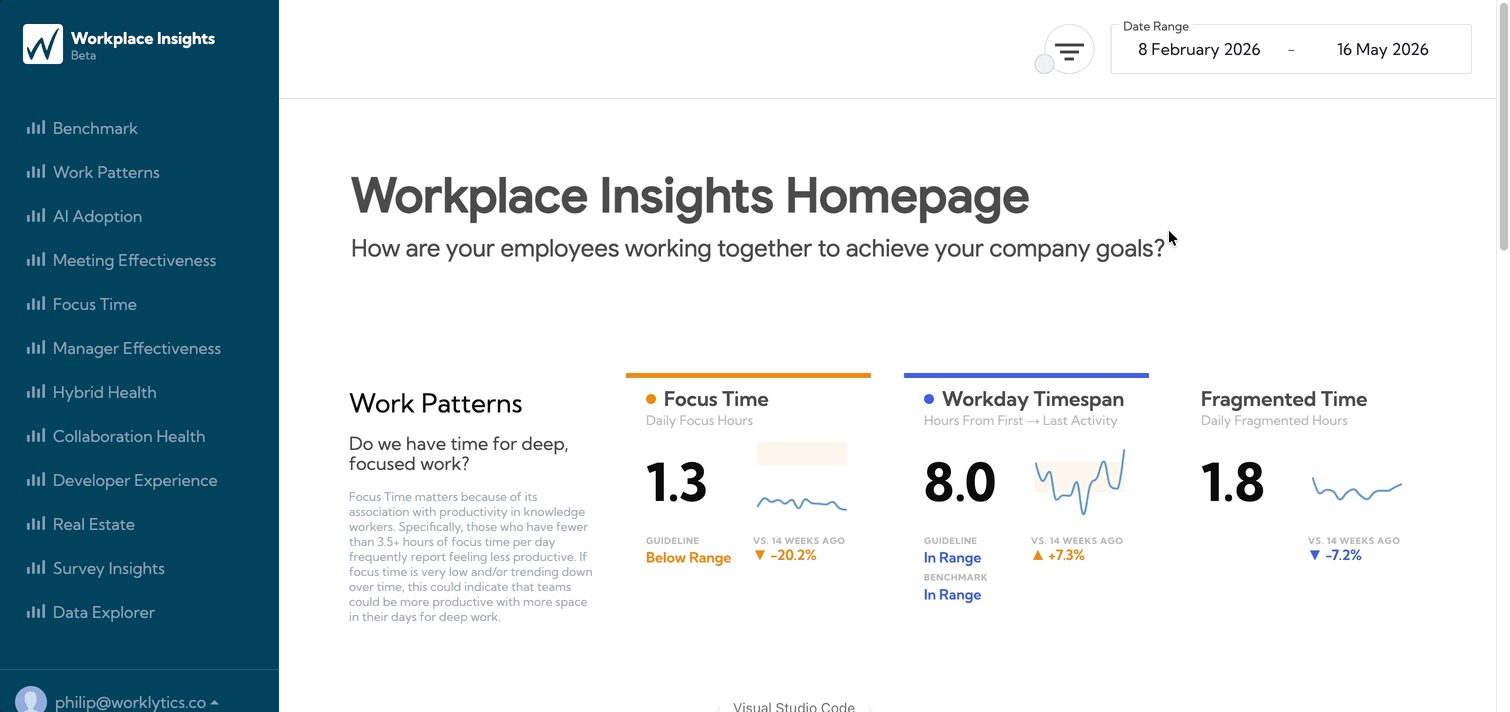
How healthy is your organization right now—and where should you actually look first?
The new Workplace Insights Homepage is a single pulse-check across work patterns, meeting culture, collaboration, and manager load. Metrics are scored against recommended guidelines and benchmarked to peer companies, where relevant. You can now:
Check out the new homepage in your Worklytics Dashboard!
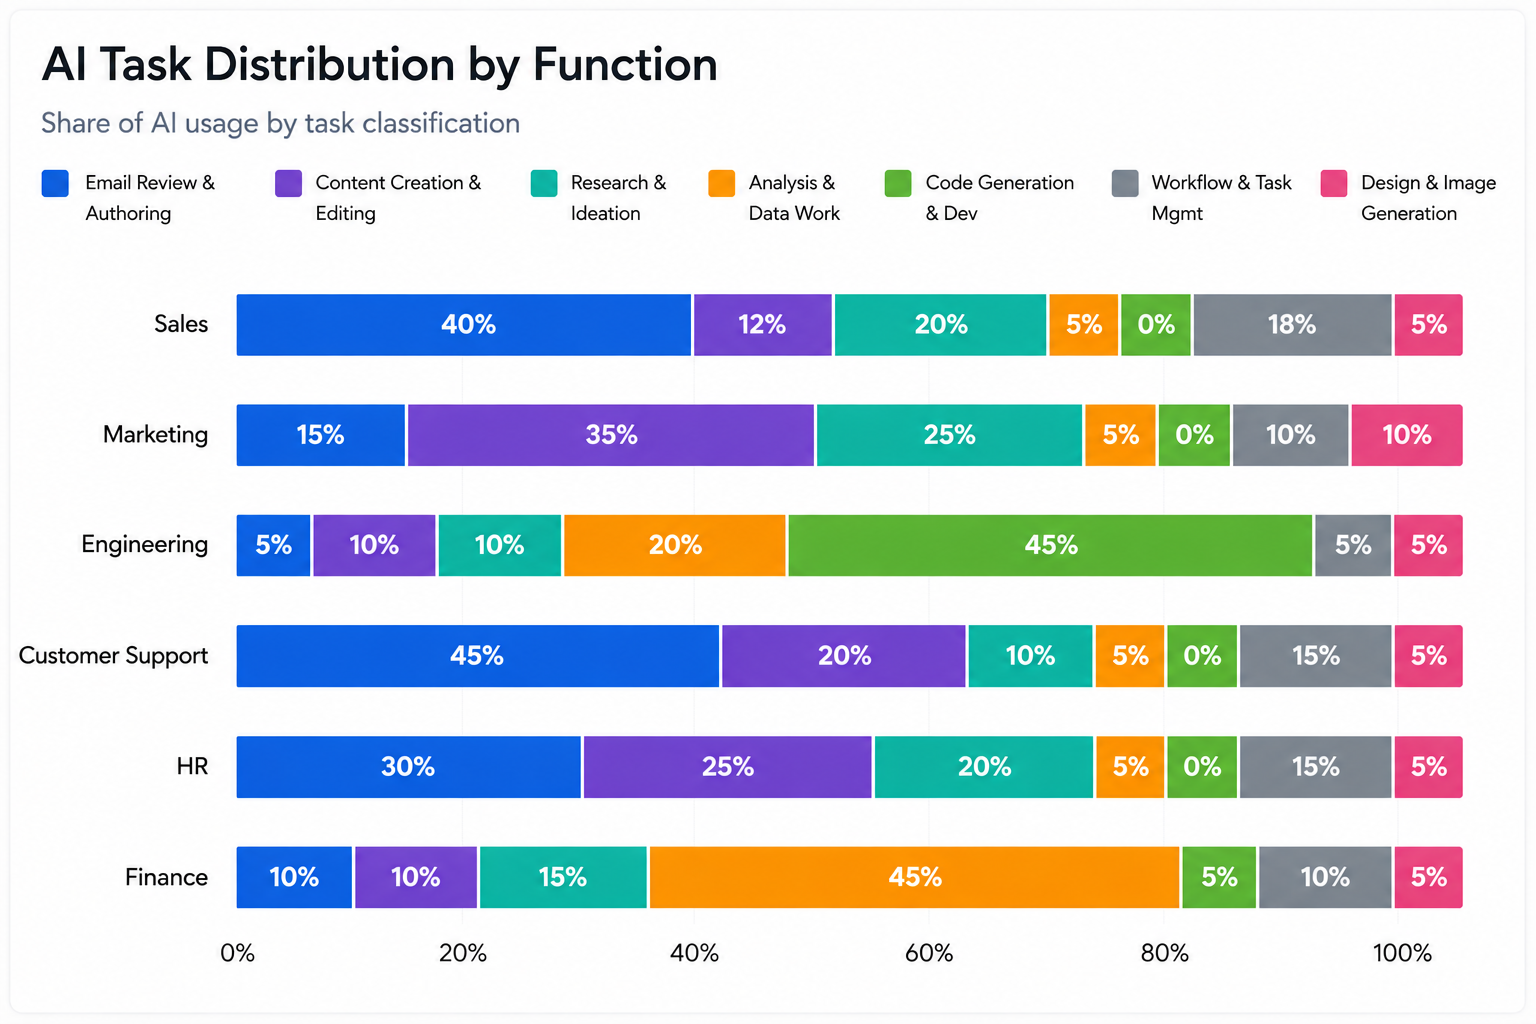
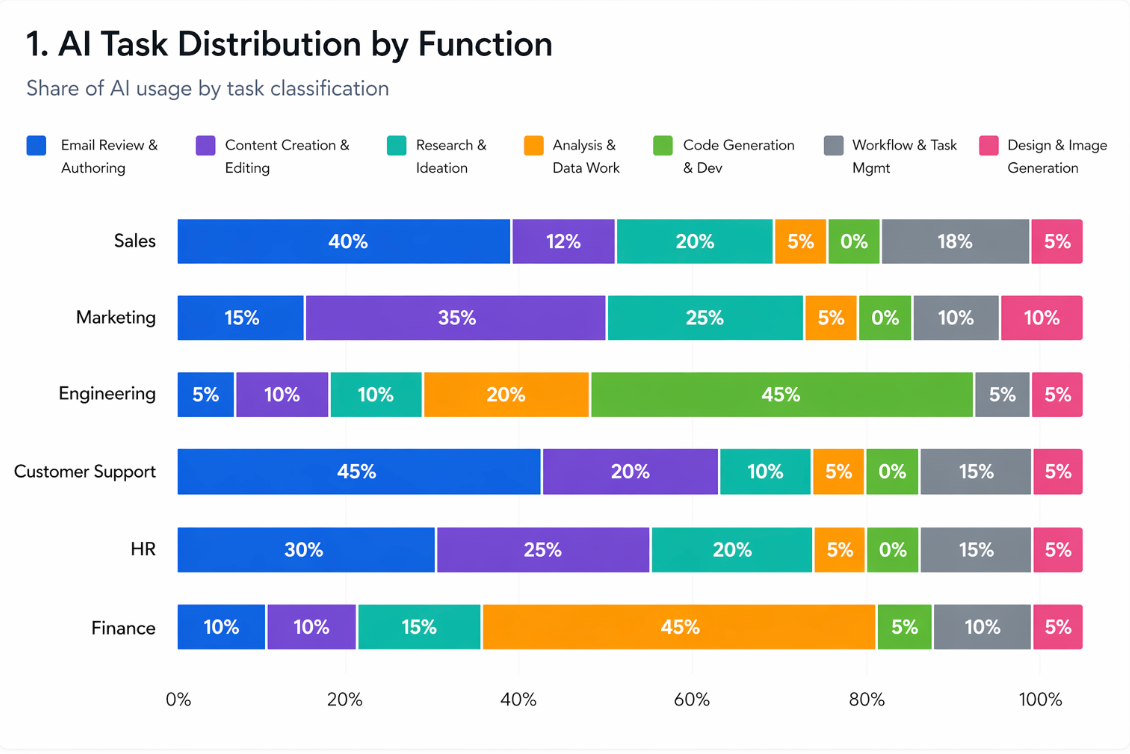
Knowing how much AI is being used is one thing—knowing what it's being used for is what makes it actionable.
We're piloting a new capability that classifies AI prompts into use-case categories—like email authoring, analysis, code generation, and content creation—then combines them with adjacent events and metadata to show how AI is being applied across functions.
This helps you:
This is currently in alpha. Respond to this email if you'd like to learn more or pilot it with your organization.
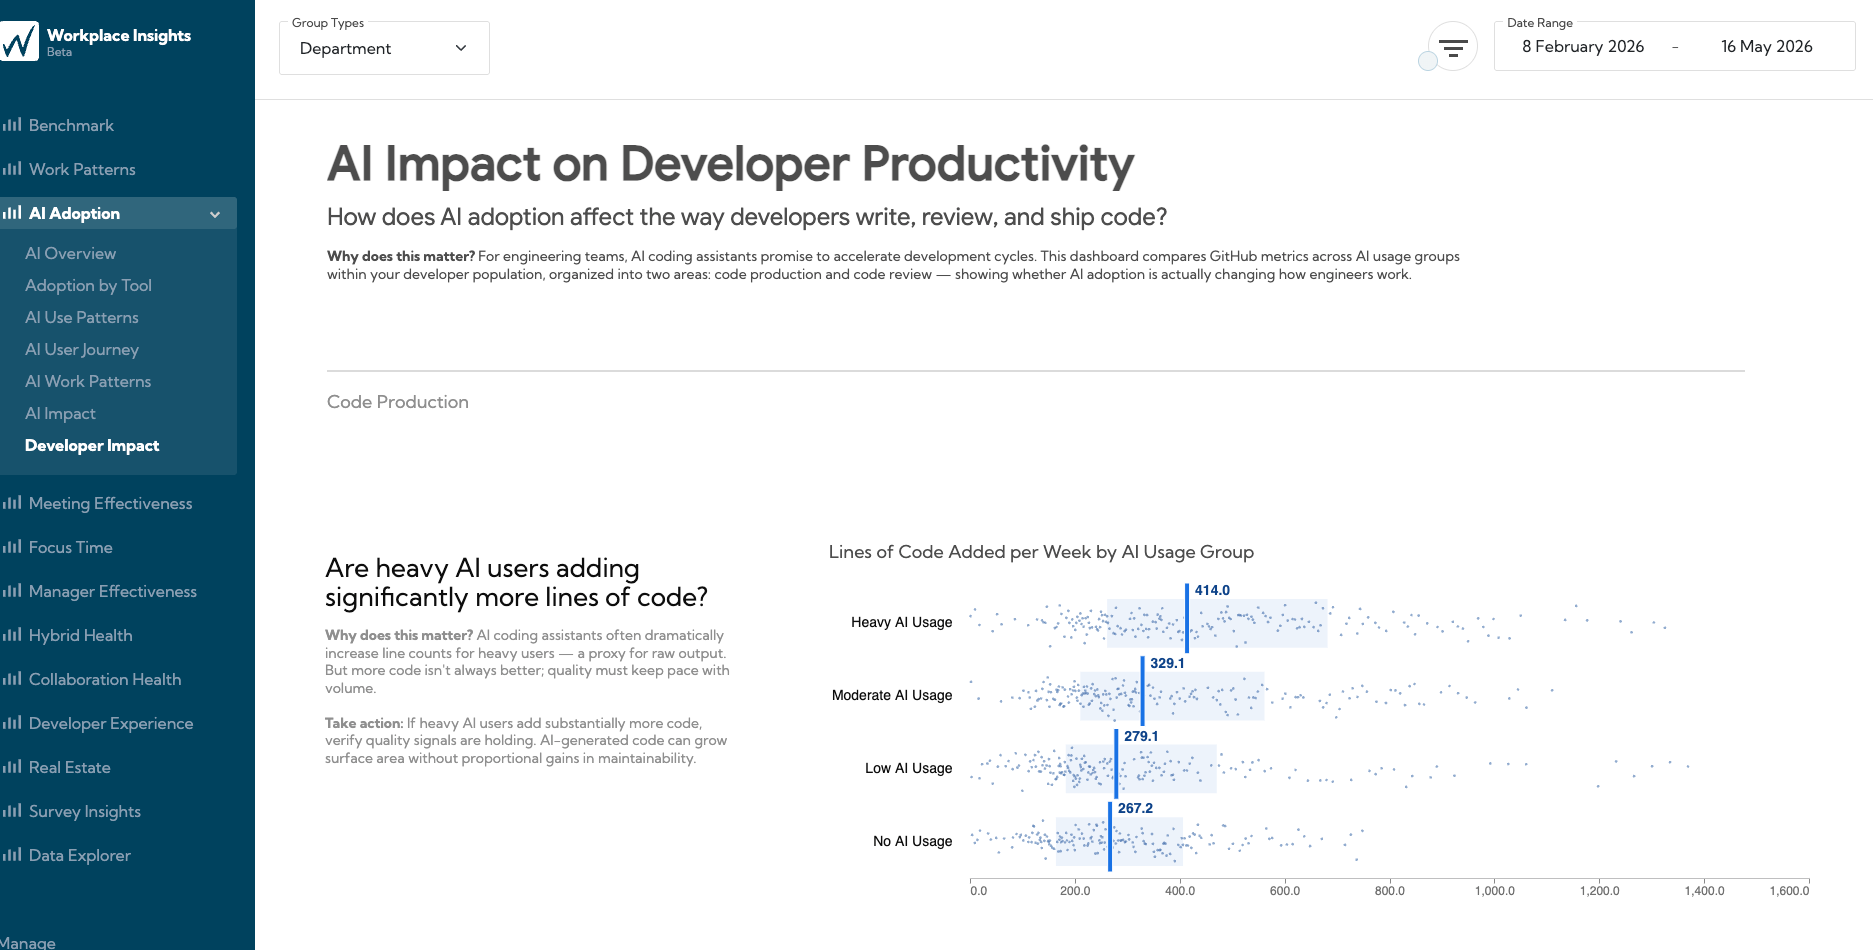
Does using AI actually change how developers write, review, and ship code?
Compare GitHub metrics across AI usage cohorts—Heavy, Moderate, Low, and No AI Usage—to see whether AI adoption is shifting engineering output, and where to watch for quality risk.
With this dashboard, you can:
Check out the new dashboard in your Worklytics Dashboard!
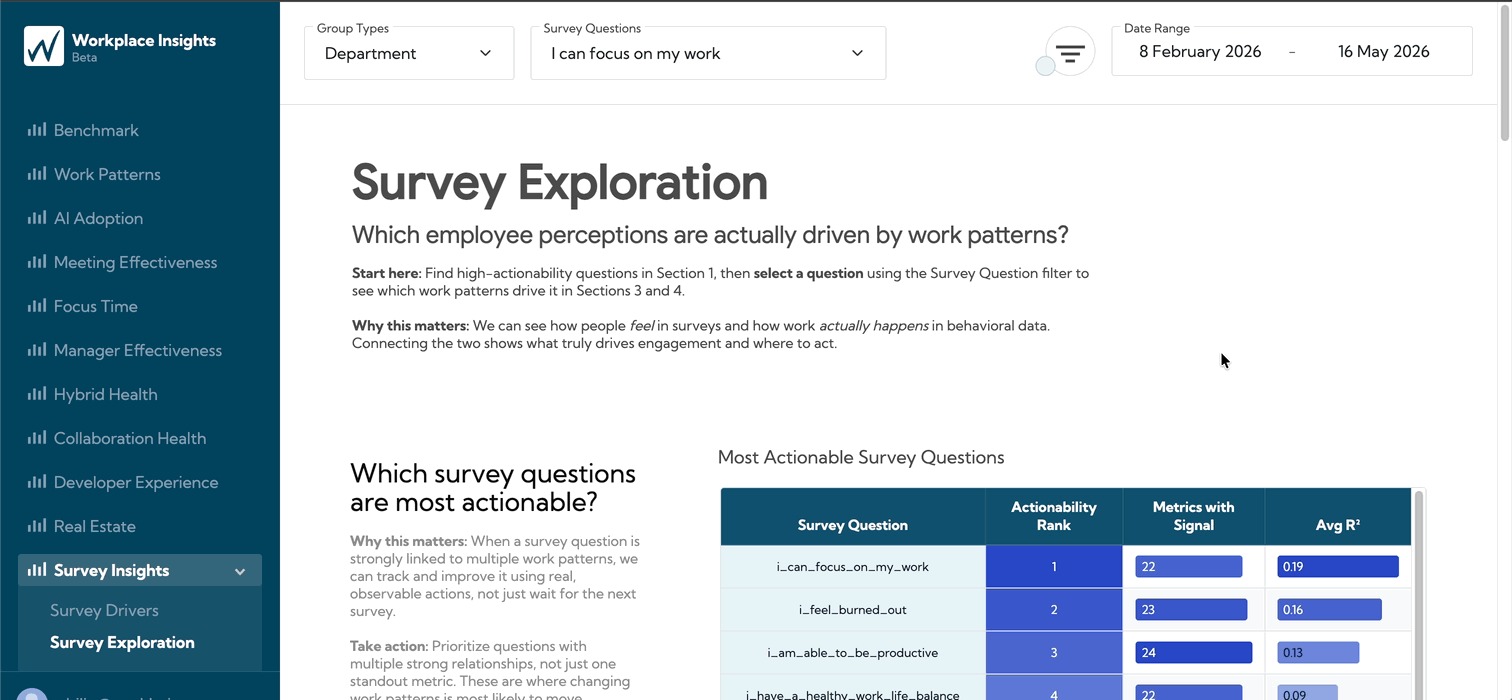
Survey data can be hard to act on—you see the score move, but not what's causing it.
The new Survey Exploration Dashboard surfaces the strongest relationships between sentiment and measurable work patterns, so you can spot which behaviors actually move the needle—and start changing them without waiting for the next survey cycle.
You can now explore questions like:
Check out the new dashboard in your Worklytics Dashboard!
If you'd like a walkthrough of any of these updates, or want help rolling them out across your organization, just reply—we're happy to help.


