
Most turnover programs fail because insight arrives after the decision is already made. By the time a resignation is submitted, the organization has few remaining levers. Predictive analytics changes the timeline by flagging where retention risk is rising, while work conditions are still adjustable.
This is not a promise of perfect individual prediction. It is a disciplined approach to measuring risk at the level where intervention is responsible and effective: teams, roles, locations, work types, and manager spans.
For consistent external definitions of separations and quits, the BLS JOLTS Latest Numbers page provides monthly context and terminology you can align to internally.
Model performance and business usability both depend on outcome clarity because every modeling choice upstream, including feature selection, evaluation metrics, threshold setting, and operational workflows, is anchored to the label. If the label is loosely defined, the model will learn a blended pattern that does not map to a real decision. The result is typically high apparent accuracy but low actionability because leaders cannot tell what to do, for whom, and within what timeframe.
Minimum specification:
This prevents a common misalignment: a model that predicts “any separation” while the organization only intends to prevent avoidable, voluntary departures.
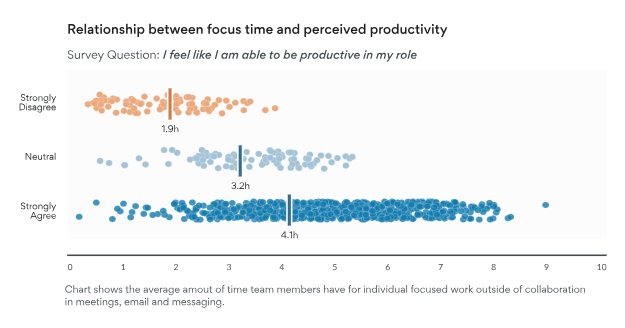
Turnover risk increases when conditions change in ways that employees experience as worsening, such as reduced growth opportunity, deteriorating manager relationships, sustained overload, or isolation from important work. The most valuable inputs are not just correlated with turnover; they change early enough to create an intervention window.
Keep the first version focused on three signal categories:
This fusion is practical because each data type compensates for the other’s limitations.
Net effect: you get earlier, more actionable alerts for the subset of voluntary exits that are both preventable and expensive, which is the only segment where predictive analytics creates business value.
A retention model is only useful if it supports consistent decisions and withstands scrutiny. Build for three properties:
Evaluate with precision and recall at your intervention threshold, and check that the model is not simply using tenure or job level as a proxy for “leaving.”
A predictive program succeeds when non-technical leaders can use it without translation. Present results in a simple structure:
This packaging turns analytics into an operating signal, not a quarterly slide.
Prediction alone does not reduce turnover because models do not change employee experience. Decisions and actions do. Without a defined execution path, even a highly accurate model becomes a passive dashboard that managers consult after it is too late to intervene.
A workable retention workflow must translate a probabilistic signal into a repeatable operating process with clear owners, timelines, and decision rules.
Refresh risk and drivers on a fixed cadence and assign ownership: People Analytics curates, HRBPs triage, managers execute, and leadership reviews outcomes.
Action triggers exist to prevent two failure modes: constant alert fatigue and silent inaction. They define when a risk signal is strong, sustained, and scoped enough to justify managerial attention. Define triggers in operational terms:
Reserve individual-level triggers for programs with documented governance, strict access control, and a clearly supportive use policy.
Predictions are only useful if they map to actions that address the underlying cause. Driver-linked playbooks reduce variation in response while preserving managerial discretion. Tie each driver category to a small set of actions so execution is consistent:
Worklytics positions real-time dashboards as essential for this cadence, stating that real-time work data can detect changes quickly enough to intervene before attrition becomes unavoidable.
Predictive analytics in employment contexts must be designed for defensibility and trust. Governance is part of the system specification.
Minimum controls:
The NIST AI Risk Management Framework provides a lifecycle structure for identifying, measuring, and managing AI risks that maps directly to predictive HR analytics programs.
For a plain-language checkpoint on discrimination risk, the EEOC “Employment Discrimination and AI for Workers” guidance (PDF) summarizes how federal anti-discrimination laws apply even when AI is involved in employment decisions.
Keep leadership reporting intentionally compact to ensure it is reviewed on a recurring cadence.
Track, by priority cohort:
Together, these metrics establish a closed operational loop: emerging risk is detected, causal drivers are isolated, interventions are executed, leading indicators shift, and outcomes validate impact.
Predictive retention programs often stall because signals live in different systems and update at different speeds. Worklytics is positioned to reduce that friction by linking HRIS context with collaboration dynamics and converting them into retention-ready metrics.
If your goal is to operationalize employee turnover analytics with predictive signals, Worklytics aligns in four relevant ways:
Worklytics describes predictive analytics that incorporate real-time work data and driver analysis to detect early signals of regrettable attrition and clarify what is causing risk to rise.
Its retention materials emphasize real-time metrics and explicitly distinguish drivers for in-office, hybrid, and remote employees, supporting practical cohort segmentation.
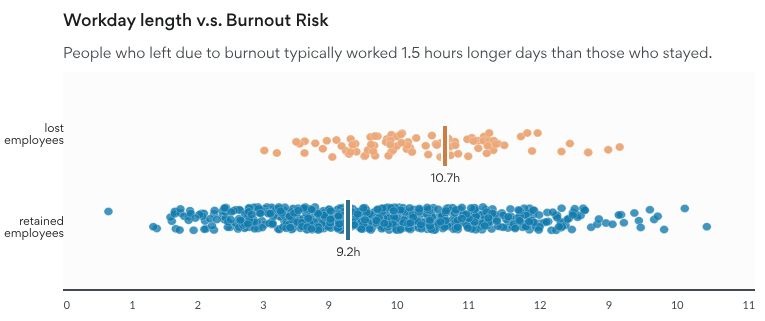
Worklytics’ burnout and wellbeing solution focuses on work-life balance cadence, leading indicators, and composite metrics across collaboration tools to surface retention risk earlier.

For more detail on Worklytics’ retention-specific approach, see its employee retention data analytics software page.
What is the difference between employee turnover analytics and turnover prediction?
Employee turnover analytics reports historical separations and rates. Turnover prediction estimates the probability of voluntary departure within a defined future window and identifies which measurable drivers increased that probability.
Should we focus on individuals or cohorts first?
Start with cohorts and teams. Cohort-first design targets systemic drivers, reduces privacy risk, and produces interventions managers can execute consistently. Move to individual-level scoring only with a documented, supportive use policy and strict controls.
What makes a turnover model usable in practice?
Calibration, driver transparency, and stable performance across key segments. If leaders cannot interpret probability, see ranked drivers, and trust the model across their workforce, the score will not change behavior.
How do we reduce bias risk in predictive turnover analytics?
Minimize sensitive inputs, run fairness checks on error rates and false positives, require human review, and document prohibited uses. Align build and monitoring to a recognized risk framework, then audit regularly.
What actions are appropriate when risk rises for a team?
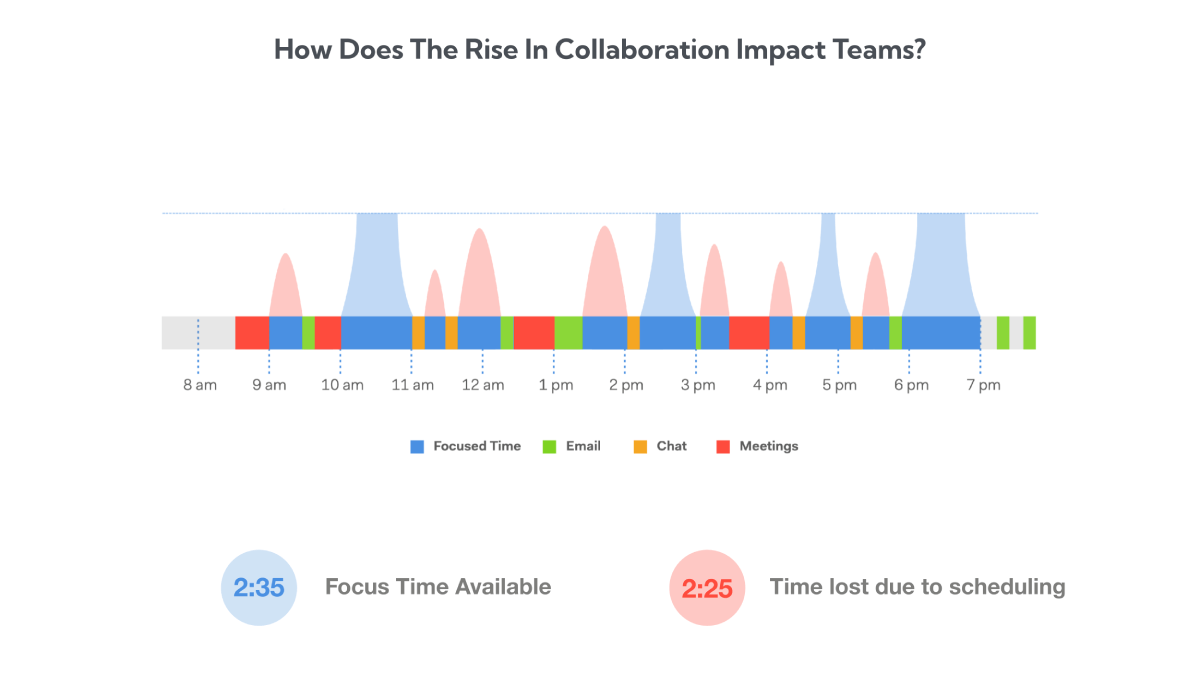
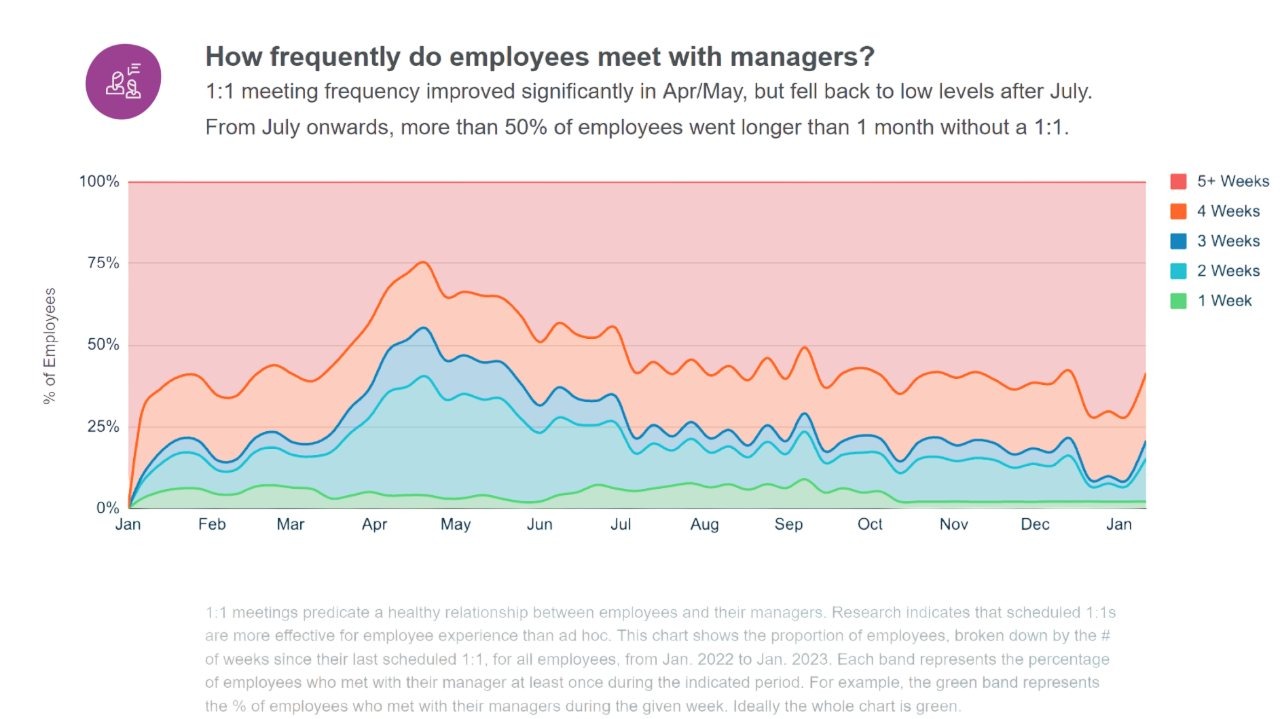
Address the driver category that moved risk. If the driver is meeting overload, reduce meeting volume and protect focus time. If it is isolation risk, increase structured manager contact and restore stakeholder access. If it is manager transition volatility, implement a defined transition plan with checkpoints.
Can AI adoption data be used in retention analytics?
Yes, if it is used as a change and enablement signal at the cohort level. Use adoption gaps to target training and support, not as a proxy for performance evaluation.


