We’re often asked about using data from collaborative tools to measure the productivity of individuals. While it’s natural to think about productivity at the individual level, this approach often misses the mark. Productivity in today’s knowledge-driven organizations is far less about how many tasks a single person checks off and far more about whether teams are working in focused, collaborative, and healthy ways.
Does the environment and structure at the team level support productivity?
After all, you can hire the best talent available, but if you place people in a chaotic and unfocused environment, they are likely to be unproductive.
We’ll explore three critical areas where ONA transforms productivity: how it helps us understand team dynamics more deeply, the key benefits it delivers for organizations, and the ways it empowers leaders to make smarter, data-driven decisions.
Organizational Network Analysis (ONA) goes beyond traditional metrics by showing how work really flows across teams. Instead of just measuring output, it reveals hidden influencers, collaboration bottlenecks, and whether teams are too dependent on external stakeholders.
A healthy balance between internal and external collaboration is critical — teams that lean too heavily on outside input often lose focus and autonomy.
ONA also highlights the impact of collaborative overload, where meetings, emails, and constant pings eat into focus time. By surfacing these dynamics, ONA gives leaders a clear view of where productivity is being drained. With Worklytics, these insights are made practical, connecting data from collaboration platforms into clear patterns leaders can act on.
ONA helps organizations improve productivity by making team dynamics visible. Leaders can spot where teams are aligned with their goals — and where distractions or silos are slowing progress.
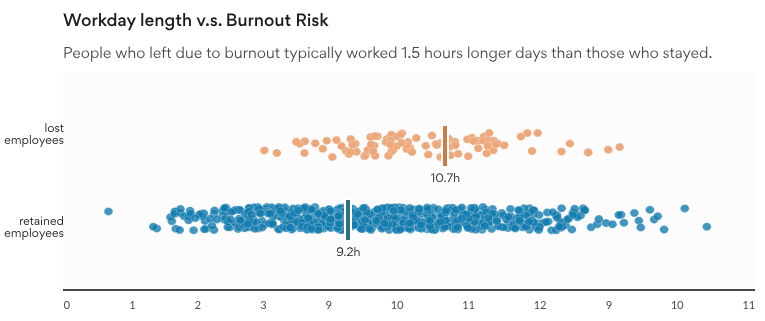
It also exposes uneven workload distribution, allowing managers to rebalance collaboration demands and prevent burnout. Beyond efficiency, ONA improves employee engagement by ensuring teams have the time and space for meaningful work.
This builds resilience and reduces turnover, as employees feel more supported in their roles. Worklytics enhances these benefits by benchmarking patterns across industries, giving organizations a standard to measure their performance against.
For leaders, ONA provides the evidence needed to make smarter decisions about people and teams. It identifies emerging leaders who act as key connectors, even without formal titles, helping organizations strengthen succession planning. ONA also informs staffing and resource allocation by showing which teams are overextended and which have capacity to take on more.
Leaders can use this data to streamline decision-making processes, removing bottlenecks that slow execution. Over time, ONA helps shape future team design, ensuring structures reflect real collaboration patterns rather than just hierarchy.
With Worklytics, these insights become ongoing and predictive, giving leaders the foresight to act before productivity issues escalate.
We recently collaborated with a marketing company that was struggling with productivity issues. Some of their project teams were consistently delivering late or poor quality work and they had a sense that this was down to individual productivity. We used organizational network analysis to take a closer look at how their teams were working together, with the goal of providing insight into the issue.
Productive project teams tend to be autonomous and focused. Having multiple external stakeholders or shared resources can create bottlenecks and slow decisions.
We performed an analysis of external vs internal (E/I Analysis) collaboration in project teams using data from email, calendar, document repository, and project management tools.
E/I Analysis compares the percentage of time team members spend collaborating with each other, against time they spend collaborating with individuals outside of their team. This data is used as a proxy for how focused and autonomous a project team is.A highly focused team should ideally invest a significant portion of its time in internal collaboration. This of course differs from team to team but in our analysis of over 150 organizations we’ve found that a ratio of around 60/40 (internal/external) is about average for teams of knowledge-workers. Below are the results of our analysis for one of the project teams.
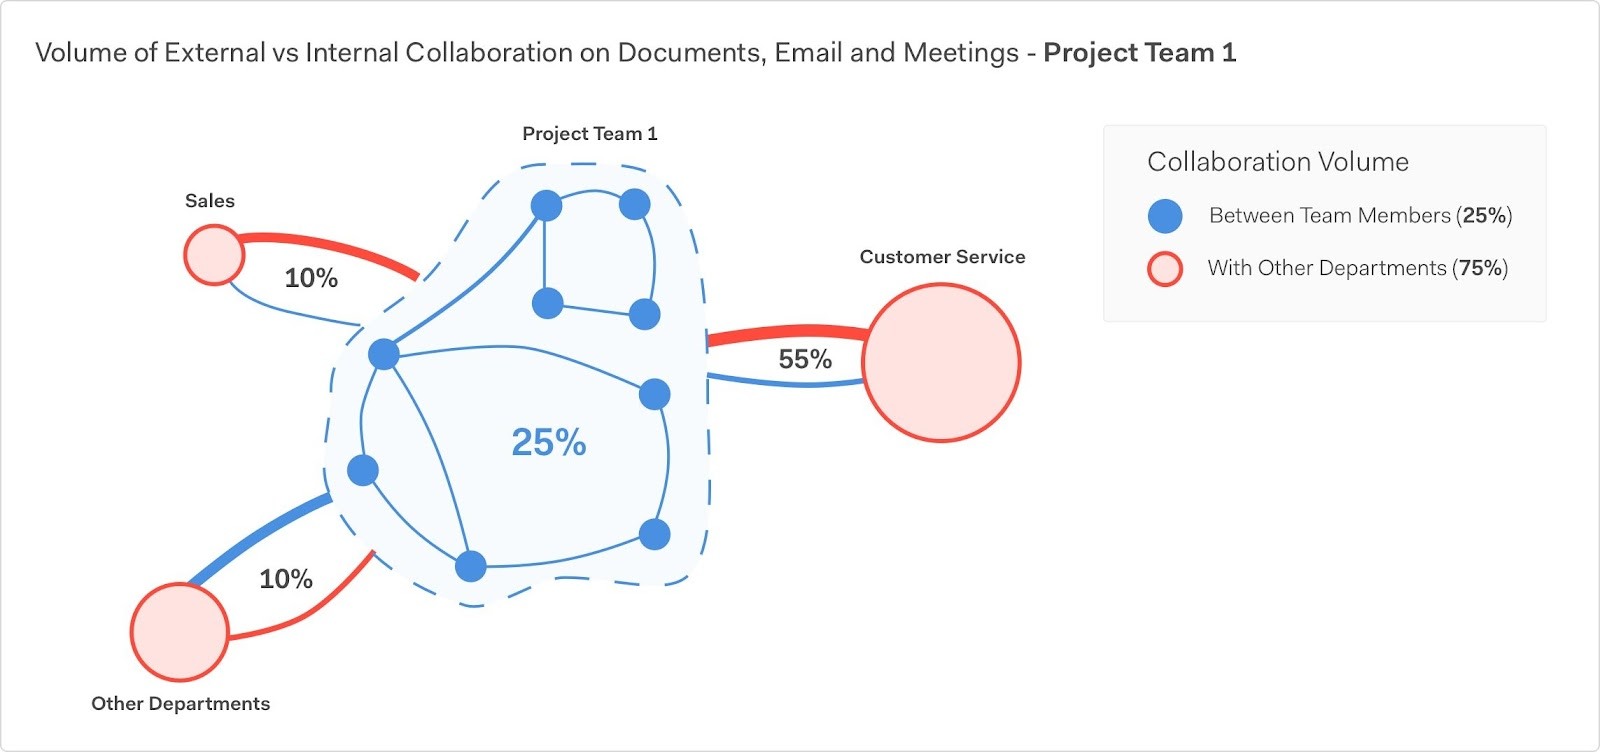
Diagram illustrating collaboration between team members inside a team as well as outside with other departments
They appeared to be spending all of their time sending email, in meetings, chatting, writing documentation and working on tickets with other teams and departments.
In this case, our analysis showed that a few of the project teams were spending upwards of 75% of their time on external collaboration. In other words, their project teams appeared highly dependent on external resources or stakeholders.
They appeared to be spending all of their time sending email, in meetings, chatting, writing documentation and working on tickets with other teams and departments. Far from what we would expect of a focus and autonomous project team.We also looked into which departments the external interactions were with.
Interestingly we found that the majority were with only two other departments: Customer Service and Sales. These two customer-focused teams accounted for over 65% of the interaction with the underperforming project teams.
To highlight the impact of these external interactions, we performed an activity analysis using data from calendar, email and messaging platforms within the organization. The activity analysis is designed to give a sense of the typical day-to-day life of team members and the impact that external interruptions have on this.Research indicates that knowledge workers require significant periods of uninterrupted time to focus and problem solve. Before and after every interruption there is a ramp up and ramp down time while people get back into the problems they were working on. This is best illustrated by the image below:
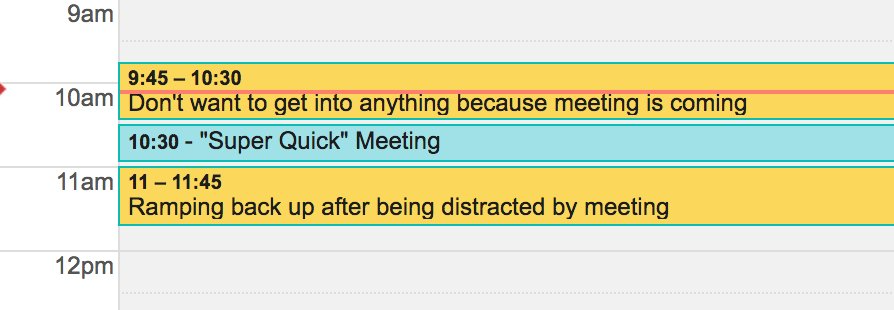
The impact of a small meeting on the schedule of a knowledge worker - source
Our analysis highlighted that several individuals within the underperforming project teams had highly disrupted schedules, with multiple meetings and other interruptions per day.
Our analysis highlighted that several individuals within the underperforming project teams had highly disrupted schedules, with multiple meetings and other interruptions per day. This indicated that people had limited time available to focus on important tasks and deliverables. The diagram below illustrates a typical day in the life of a team member and highlights estimated impact on productivity.
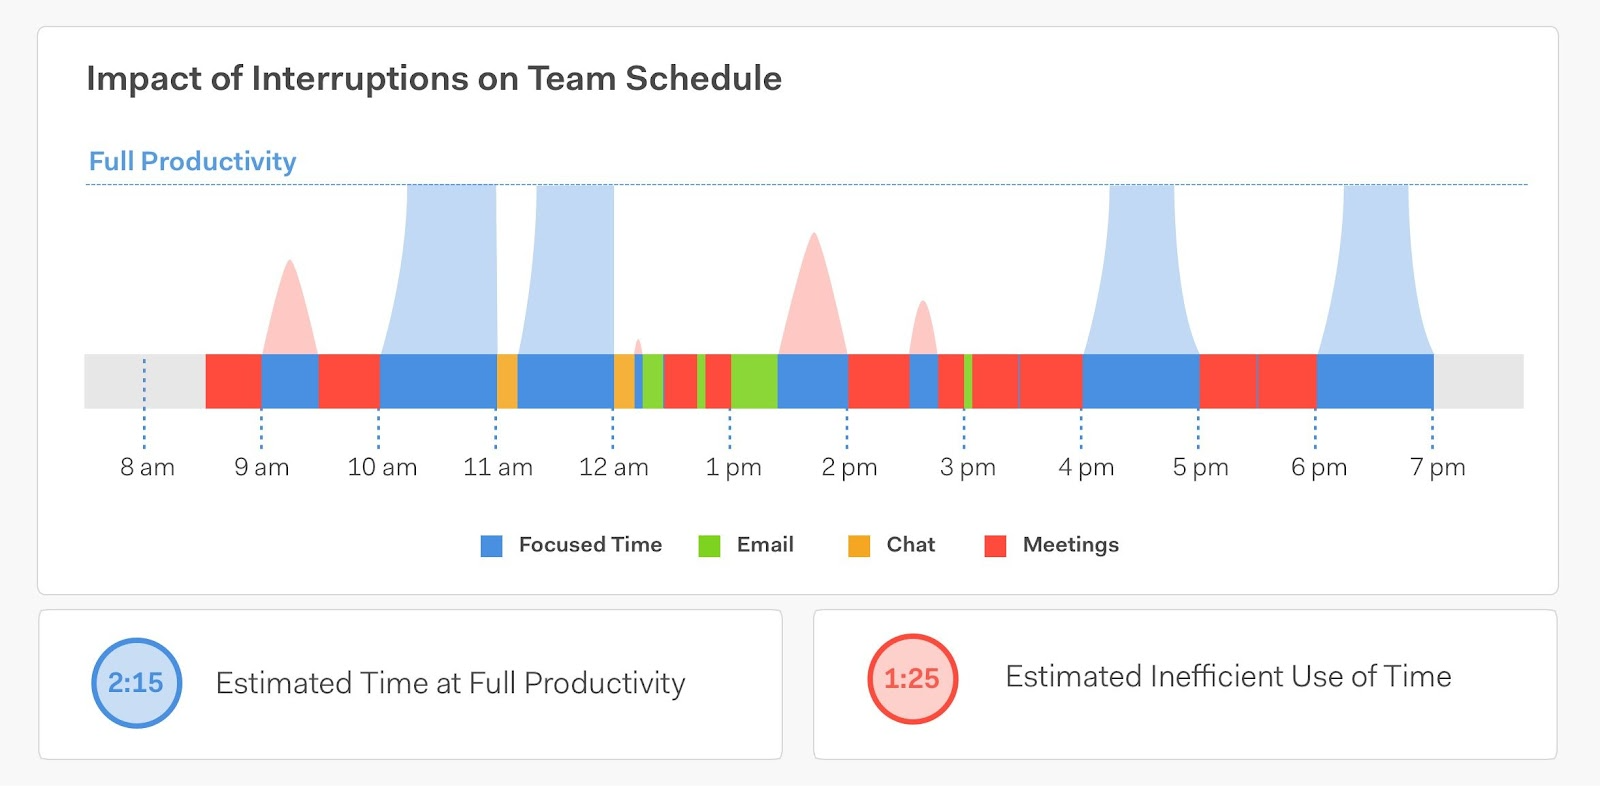
Diagram highlighting the impact of interruptions on the productivity of a team member. Even though they are in the office for 8 hours a day they only have around 2 hours to really focus on the work that matters
Our results indicated that the environment and work habits at the team level were likely a significant driver of productivity issues. Consistent interruptions and collaborative overload appeared to be making it hard to get work done. Direct feedback from the team members confirmed these findings. People had previously complained about the environment being disruptive but without the data not much was done about it.We provided managers with a series of recommendations to help them build more focused team environments. This included actions such as providing single points of contact between Customer Service and project teams. We have also worked to provide “focused time” as a core metric for success on teams and as a way to ensure that similar issues are rapidly identified in future.
While ONA gives organizations the framework to understand collaboration and productivity, tools like Worklytics transform these insights into real-world impact. Worklytics connects seamlessly to existing collaboration platforms — including Slack, Google Workspace, Microsoft Teams, and Jira — and translates raw activity data into clear, actionable metrics that leaders can trust.
One of the first signals Worklytics surfaces is collaboration load. This metric highlights how much time employees spend in meetings, emails, chats, and other collaborative activities. While collaboration is essential, too much of it creates overload, leaving teams little time to focus on deep, high-value work. With Worklytics, leaders can track whether collaboration is balanced or tipping into unsustainable levels, allowing them to intervene before productivity declines.
Worklytics also makes focus time visible — something most organizations overlook. Knowledge workers need uninterrupted blocks of time to solve problems, think strategically, and create meaningful outputs. When employees’ days are fragmented by constant interruptions, they end up with only small pockets of usable focus. By quantifying focus time, Worklytics gives leaders a tangible way to protect and prioritize it, turning it into a core productivity metric alongside traditional KPIs.

Because Worklytics provides continuous monitoring, it can flag risks such as excessive external collaboration before they derail performance. Instead of waiting until deadlines are missed or employees burn out, leaders get proactive alerts that help them correct course quickly. This predictive capability makes Worklytics more than just a reporting tool — it becomes a strategic early warning system for organizational health.
Ultimately, the value of Worklytics is not just in improving short-term output but in ensuring long-term sustainability. By balancing collaboration and focus, preventing overload, and ensuring workloads are fairly distributed, Worklytics helps organizations avoid burnout and retain top talent. This holistic approach to productivity means companies can grow without sacrificing employee well-being, creating a healthier, more resilient workforce.