
To track Windsurf usage across a team, start with the Windsurf team dashboard and its Analytics API, which report each user's active days, last activity time and credits used, and which are available to Enterprise accounts. To see adoption by team, role or manager, and next to the other AI coding assistants your engineers use, bring that data into a people analytics platform that reports at group level.
One thing has changed since many teams bought Windsurf: Cognition acquired it in July 2025, windsurf.com now points to Devin Desktop, and the documentation lives alongside Devin's. The team dashboard and the Analytics API still work for Enterprise accounts, so the question for leaders is the same: are the people we pay for using it, is use growing, and how does it compare with Cursor, GitHub Copilot or Claude Code? This guide covers where Windsurf reports usage, what its own analytics leave out, which group-level metrics to track, and how to see Windsurf next to the rest of your AI stack.
Buying Windsurf seats is only half the job. The other half is making sure people use them and that the use pays off. Here is why tracking Windsurf adoption is worth the effort:
Rolling out Windsurf doesn’t guarantee adoption, so tracking usage helps you see which teams have embraced it and which haven’t. Usage data creates a clear picture of adoption patterns across the organization. With this visibility, leaders can justify licensing costs, assess ROI, and decide whether more enablement or adjustments are needed. Without these insights, it’s difficult to know if the investment is paying off or underused.
One of Windsurf’s biggest promises is improved productivity, but you need data to confirm it. Tracking usage alongside outcomes like delivery speed, code quality, or project completion helps you see whether the tool is actually moving the needle. If teams with higher usage consistently perform better, that’s a signal to expand support. Over time, these insights allow you to replicate success and strengthen efficiency across the board.
Usage metrics can highlight disparities between teams or roles, showing where AI confidence may be lacking. If one team uses Windsurf heavily while another barely touches it, it often signals a need for training or guidance. Leaders can then step in with workshops, peer mentoring, or onboarding programs to close the gap. This ensures every group has equal access to the benefits, rather than leaving adoption uneven and siloed.
Tracking also reveals who is getting the most out of Windsurf, often uncovering “power users.” These employees can be tapped as champions to share tips and workflows with peers. Their habits can inform best practices, such as using the tool during code reviews or for repetitive tasks. By spotlighting and spreading these approaches, you help scale effective usage across the organization.
Usage data also tells you whether Windsurf is used where your policies allow it. If a group that is not licensed for it shows activity, or a licensed group shows none, that is a conversation to have with the team lead, not a reason to inspect individual work. Adoption data at group level is enough to spot both patterns and to confirm that paid seats are in use.
Finally, usage insights can feed into broader workforce planning. High adoption of AI tools often signals an innovative culture and can inform where to invest in training or new roles. Linking usage to outcomes like engagement, retention, or project success helps leaders plan for the future of work. Over time, Windsurf usage becomes not just a measure of productivity but also a marker of organizational adaptability.
Those are the reasons. The next question is where the data comes from.
Tracking employees’ usage of Windsurf can be approached from a few angles. Often, the best solution combines multiple methods. Here are some strategies to consider:
Windsurf Enterprise accounts get a team dashboard at windsurf.com/team, where admins manage members, groups, SSO and billing, plus an Analytics API for pulling usage data. The teams page, and the matching User Page Analytics endpoint, report per user: name and email, last activity time, active days in a chosen period, and prompt credits used. A day counts as active when the user had any autocomplete acceptance, Cascade use or command use that day.
Two API generations are documented. The v1 Analytics API covers autocomplete, chat, command and Cascade metrics, with a Cascade Analytics endpoint and a Custom Analytics endpoint for your own selections and filters, and its data refreshes every 3 hours. The newer v2 API, still in alpha, reports active users (a user is active in a period if they have any billing event in it), credit or ACU consumption, accepted lines of code inserted and deleted by the agent, and agent tool calls. It is rate-limited to 10 requests per hour per team and is meant for periodic reporting and bulk export, not live dashboards.
Since the Cognition acquisition, the docs refer to the product as Devin Desktop and to existing accounts as "legacy Windsurf Enterprise". The dashboard and API paths above still carry the Windsurf name. The self-serve Teams plan lists an admin dashboard with analytics, and the Analytics API needs a service key created in team settings, so check which plan you are on before you plan around the API.
| Windsurf dashboard and Analytics API | |
|---|---|
| Per-user active days, last activity, credits used | Yes, on the teams page and the User Page Analytics endpoint |
| Active users by day or month | Yes, v2 Analytics API (alpha) |
| Accepted lines of code, tool calls, Cascade metrics | Yes, through the API, not as a team-level trend over time |
| Filter by group | Yes, by Windsurf group name or a group-scoped service key |
| Adoption by department, manager or role from your HR system | No, Windsurf only knows its own groups |
| Trend of weekly active share per team, with a minimum group size | No |
| Other coding assistants (Cursor, GitHub Copilot, Claude Code) | No, Windsurf only reports Windsurf |
| Live or near-real-time data | No, the v2 API is hourly-aggregated and limited to 10 requests per hour |
In short, Windsurf tells you who was active and how much they consumed. It does not tell you which departments have adopted it, how adoption is trending against your rollout plan, or how Windsurf compares with the other assistants your engineers use.
Surveys remain a simple yet effective way to understand Windsurf adoption. Developers can share how often they use it, in what contexts, and whether it’s helping them. This feedback offers qualitative insights that raw metrics can’t provide, such as why usage may be low. Combined with data, surveys round out the picture by showing sentiment as well as activity.
Repositories carry indirect signs of AI-assisted work: changes in commit frequency, pull request size or review turnaround after a rollout. None of these prove Windsurf use on their own, and they say nothing about who used it, but they are the outcomes you will want to put next to adoption data later. Treat them as the impact side of the picture, not as a way to detect usage.
Device management and software inventory tools can confirm that Windsurf is installed on company machines. That answers "is it present?" and nothing more. It does not show depth of use, and it is a poor basis for an adoption program, so keep it for licensing and policy checks rather than for measuring adoption.
For adoption by team and over time, a people analytics platform combines Windsurf's usage data with your org structure and the rest of your AI stack. Worklytics, for example, connects to AI coding assistants such as Windsurf, Cursor, GitHub Copilot and Claude Code, and to the work tools your teams already use, and turns their usage metadata into group-level metrics. It shows which teams use Windsurf each week, how that is trending, and how it compares with the other assistants in use, without exposing any individual's activity.
These approaches are not mutually exclusive. A common pattern is to start with the Windsurf dashboard for a headcount of active users, add a quarterly developer survey for the why, and move to a cross-tool platform once leadership asks for adoption by team or for Windsurf next to Cursor and Copilot. If you only need an overall adoption rate, the dashboard is enough. If you need to run an adoption program, you need the group-level view.
Windsurf's dashboard gives you a per-user list of active days and credits. If you need adoption by group, a trend over time, and Windsurf next to your other AI tools, you need a platform that brings Windsurf's data together with your org structure and the rest of your AI stack. Here is what that looks like in Worklytics.
Worklytics imports Windsurf's usage data through Windsurf's Analytics API, which requires a Windsurf Enterprise subscription. Windsurf exposes adoption-level data only: for each person, the number of active days and the time of their most recent activity. There is no per-session, token or code-change detail available from the source, so Worklytics does not report accepted suggestions or AI-generated code share for Windsurf. What it does report, by team, role or manager group, is:
Because the connector is newer, availability may be limited, so check with your Worklytics customer success contact. For a broader list of adoption KPIs, see which AI adoption metrics matter.
Windsurf is rarely the only coding assistant in use. Most engineering organizations also have Cursor, GitHub Copilot, Claude Code or Codex in play, and each vendor's dashboard only shows its own product. Worklytics brings them into one view, with the same team and role breakdowns, and groups coding assistants into a single "code" category next to conversational tools (ChatGPT, Claude, Gemini) and embedded AI features (Microsoft 365 Copilot, Slack AI). It currently covers tools including Windsurf, Cursor, GitHub Copilot, Claude Code, ChatGPT, Claude, Gemini, Microsoft 365 Copilot, Glean, Slack AI, Atlassian Rovo, Miro AI and Gong.
In that view you can:
For a tool-by-tool approach, see our AI usage checker guide to tracking AI by team and role, or see how it works on the AI adoption page.

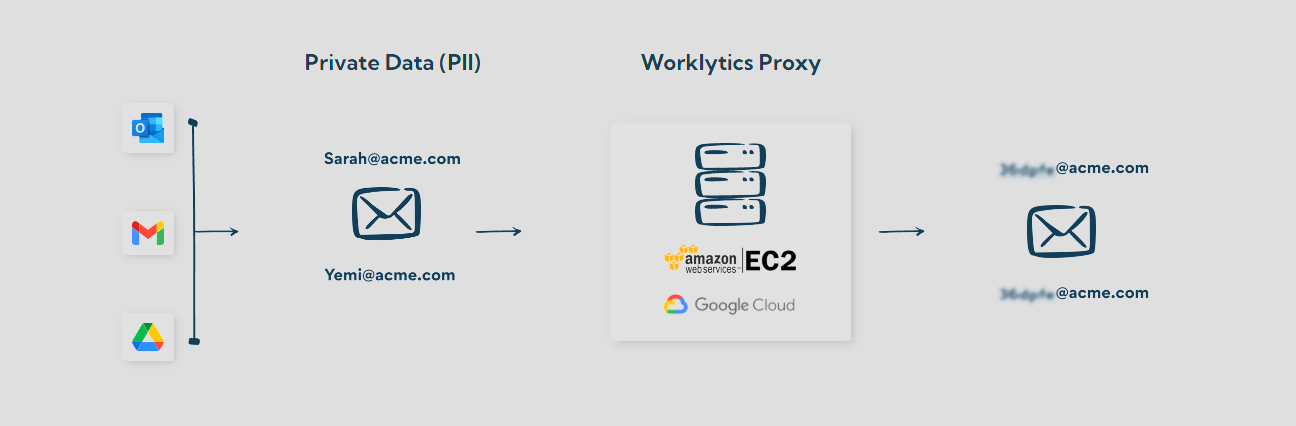
Tracking adoption should never turn into watching individual engineers. Worklytics analyzes usage metadata, never code, prompts or AI outputs. Personal identifiers are pseudonymized (hashed with SHA-256) before analysis, and results are only shown for groups above a minimum size, typically 5 to 8 people. Windsurf's data arrives as active days and last activity, so there is no record of what anyone wrote. What you get is a team-level view, such as "70% of the Platform team used Windsurf this week", which is enough to run an adoption program on.
Worklytics also places your adoption in context. Peer benchmarking, available in beta, shows how your AI adoption compares with other organizations, so a number like "half of engineering uses a coding assistant weekly" becomes a position rather than a bare figure. Benchmarks help leaders set realistic targets and show executives whether the organization is ahead of or behind its peers.
Once Windsurf and your other development tools are connected, the pattern usually appears within a few weeks: some teams use Windsurf most days, others tried it and stopped, and a few never started. The group-level view lets you act on each: target enablement at the teams that stopped, find the teams whose use is steady and ask what they do differently, and set an adoption target per group that is tied to the licenses you pay for. Over the following quarters, put adoption next to delivery metrics from your repositories to show executives whether greater Windsurf use went with faster cycle times, with data rather than anecdotes. For the method, see how to tell whether AI coding assistants are saving time.
In summary: Windsurf's own dashboard and API answer "who was active?" for Enterprise accounts. Group-level tracking answers "which teams have adopted it, is that growing, and how does it compare with our other assistants?", which is what you need to run an adoption program and to report on the investment.
For an Enterprise account, open the Windsurf team dashboard at windsurf.com/team, which lists each member's last activity time, active days and prompt credits used, or pull the same data from the Analytics API. To see adoption by department, role or manager, and to compare Windsurf with other coding assistants, bring that data into a people analytics platform such as Worklytics, which reports Windsurf adoption at group level.
Yes. Windsurf Enterprise accounts have a team dashboard for members, groups, SSO, billing and per-user activity, and the self-serve Teams plan lists an admin dashboard with analytics. Since Cognition acquired Windsurf in July 2025 the documentation refers to the product as Devin Desktop, but the dashboard and the Analytics API still carry the Windsurf name.
The v1 API reports per-user active days, last activity time and prompt credits, plus Cascade and custom analytics on autocomplete, chat and command use, refreshed every 3 hours. The v2 API, in alpha, reports active users by day or month, credit or ACU consumption, accepted lines of code and agent tool calls, limited to 10 requests per hour per team. Both require a service key from team settings.
Windsurf's teams page lists activity per user, which is useful for license management. For adoption tracking, Worklytics reports Windsurf use by team, role or manager group only, with personal identifiers pseudonymized and results shown for groups above a minimum size, so leaders see which teams have adopted Windsurf without a per-person view.
Not inside Windsurf, which only reports its own product. A cross-tool platform such as Worklytics puts Windsurf, Cursor, GitHub Copilot and Claude Code in one view, counts AI coding days once per person across tools, and breaks adoption down by the same teams and roles, so you can see which assistant each group has settled on.