

Implementing a powerful AI tool like Glean is a significant investment – but the real value only comes if employees actually use it. Many firms roll out AI tools enterprise-wide only to later find that only a fraction of employees use them regularly. This gap between availability and active usage is why tracking who is using Glean and how often is so critical.
Tracking usage is about ensuring return on investment (ROI). Glean promises to make knowledge discovery seamless, and it can indeed save substantial time when embraced. In fact, a Forrester study found Glean delivered an impressive 141% ROI to a composite organization over three years. Much of this value comes from time saved – up to 110 hours per employee per year recouped by reducing the time people spend searching for information.
By tracking Glean’s usage, companies can verify whether the tool is being adopted as intended, identify roadblocks to adoption, and take action to maximize the value from Glean.
Beyond ROI, usage data provides insights that anecdotal evidence or assumptions cannot. You might assume that after rollout, everyone is happily using Glean to find documents or get AI answers. However, without metrics, it’s difficult to know for certain.
To effectively track if employees are using Glean, you'll want to monitor a variety of metrics. Glean’s own Insights dashboard provides a rich set of usage statistics that answer important questions about adoption and engagement. Here are some of the key metrics to watch, and what they tell you:
This is the percentage of all employees who have signed up for Glean out of the total employee count. Glean’s dashboard refers to this as “Coverage” and calculates it as Signups / Employees, essentially measuring awareness and initial adoption across your company. A high coverage means most employees are indicating good initial rollout and communication. If this number is low, it suggests many employees haven’t even tried Glean yet – a sign of either insufficient awareness or onboarding friction.
These are classic engagement metrics showing the number of unique users active in a given day, week, or month. Glean defines an active user as anyone who performs a key action (like searching, asking a question, running an agent, etc.).
You can track how many active users you have in the last 24 hours (DAU), in the last 7 days (WAU), and in the last 28 days (MAU).
By comparing these, you gain a sense of the depth of engagement. For instance, if you have 500 monthly active users but only 100 daily active users, many employees use Glean infrequently.
This metric examines habit formation – specifically, how consistently users return. Glean computes “Stickiness” as Weekly Active Users / Monthly Active Users.
It represents the percentage of monthly users who are active in a given week. Higher stickiness (closer to 100%) means people aren’t just trying Glean occasionally; they’ve integrated it into their weekly workflow. Low stickiness (say, 20-30%) means many users touch Glean only sporadically. Tracking stickiness helps you gauge whether Glean is becoming a regular tool versus a once-in-a-while resource.
These metrics measure the level of engagement by looking at how much each active user is doing with Glean. In the Insights dashboard, "Searches per user per week" is calculated as the total number of search queries divided by the number of users who performed at least one search during that time period.
Similarly, Chats per user per week tracks the usage of Glean’s conversational AI assistant, measuring the average number of chat queries sent by each chat user.
These metrics indicate depth of use: for example, if active users are only doing 1–2 searches per week on average, they might be just dipping their toes. If they’re conducting 20–30 searches per week, Glean is likely their go-to daily tool.
Comparing search and chat usage can also reveal which feature is more popular – you might find that employees heavily use the search function but few use the AI assistant chat, or vice versa. Such insights can guide you in promoting underutilized features (e.g., perhaps employees need training or encouragement to try the chat feature if it’s underutilized).
It’s not just about the quantity of usage, but also the quality. Glean provides a Search Session Satisfaction (SSAT) metric, which measures how often users actually find what they are looking for.
Specifically, the SSAT is the percentage of search sessions in which at least one result was clicked by the user.
If a user enters a query and finds a useful result to click, that session is considered “satisfied.”
A high SSAT means Glean’s search results are relevant and helpful, whereas a low SSAT means people often search and don’t click anything, implying they might be hitting dead ends or irrelevant results. Tracking SSAT helps you identify if content gaps or result quality issues are hindering the usefulness of Glean.
Adoption might not be uniform across your organization. Glean’s admin Insights enable you to identify your most active users and filter usage metrics by department or team. Examining top individual users can highlight “power users” – those employees who have truly embraced Glean. These folks can be great champions or evangelists to help bring others on board (more on that later).
Meanwhile, segmenting by department reveals which teams have high or low adoption.
You may discover, for instance, that your Engineering department heavily uses Glean for code and document searches, while the Finance department barely uses it at all. This kind of insight is crucial: low usage in a department could mean that the team hasn’t been trained, doesn’t see the relevance of Glean to their work, or maybe the tool doesn’t yet index the systems they rely on. By tracking usage at the group level, you ensure that no team is left behind in adopting the new tool.
By regularly tracking these metrics, you gain a comprehensive understanding of Glean’s adoption. The goal isn’t to collect data for data’s sake, but to use it to understand how deeply Glean is (or isn’t) embedded in daily work. Next, we’ll discuss how to interpret and act on these numbers.
Tracking and boosting Glean usage can be complex, especially in a large organization with thousands of employees, multiple departments, and other AI tools in use.
While Glean’s built-in Insights give you a solid starting point, you may want to go further in analyzing adoption patterns and correlating Glean usage with other aspects of work.
This is where Worklytics comes in as a powerful ally. Worklytics is a people analytics platform designed to help organizations measure and improve the way employees collaborate and utilize tools (all while respecting privacy). When it comes to ensuring your employees are using Glean effectively, Worklytics provides a more holistic, customizable view of usage data and outcomes.
One of the advantages of Worklytics is that it can consolidate data from multiple sources to provide context for Glean usage. For example, Worklytics can ingest log data from Glean and combine it with data from other work tools your company uses. This means if you’re also using tools like Slack, Microsoft 365 Copilot, or other AI and collaboration platforms, you get a unified view of AI adoption across your organization.
Why is this valuable? It enables you to benchmark Glean’s adoption relative to other tools and identify how overall “AI at work” is trending.
Usage Breakdown by team
Within the context of Glean specifically, Worklytics takes the metrics we discussed and adds more analytic muscle to them. For instance, Worklytics can track usage by team, role, seniority, or location with great flexibility. Glean’s dashboard already allows department filtering, but Worklytics can enhance this by integrating organizational data.

Meaningful Insights
You could ask questions like: Do new hires use Glean more or less than veteran employees? Or is Glean usage higher in engineering roles than in project management roles?

With Worklytics, these kinds of segmented analyses are straightforward – the platform enables tracking AI tool usage broken down by various attributes important to your business.
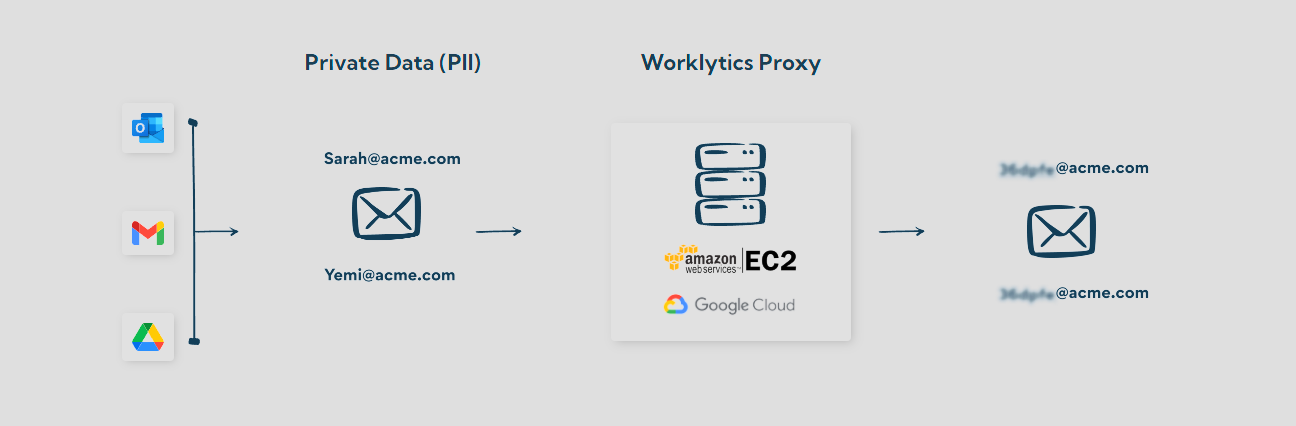
Crucially, Worklytics is built with privacy in mind, which is important when tracking employee usage of any tool, and no confidential information is ever disclosed.
In fact, Worklytics explicitly does not analyze the content of documents or messages; it only uses metadata and usage logs.
This privacy-by-design approach helps maintain employee trust. People analytics can sometimes raise concerns of “big brother” watching, but Worklytics alleviates that by anonymizing data and omitting any sensitive content. As an organization, you get the insight you need to improve tool adoption, while employees retain privacy regarding their specific search queries or activities.
In the context of Glean, Worklytics essentially acts as a solution to ensure you realize the full potential of your investment. It provides the measurement framework and analytical depth to answer the tough questions: Are employees truly using Glean? Who isn’t, and why? How can we turn occasional users into habitual users? And what impact is Glean having on our business outcomes? With those answers in hand, you can take targeted actions to drive adoption and track the results, creating a virtuous cycle of improvement.
Ready to take your Glean adoption to the next level? Worklytics can help you get there. It’s the data-driven ally in your corner, ensuring that when you deploy cutting-edge tools like Glean, they truly transform the way your employees work for the better. To see Worklytics in action and discover how it can tailor insights to your organization’s needs, consider requesting a demo. With a live demo, you’ll see firsthand how quickly you can pinpoint usage patterns, identify opportunities to improve, and ultimately foster a more engaged, productive workforce. Don’t let your Glean deployment plateau – with the right analytics and approach, you can turn it into a resounding success story for your company. Worklytics is here to help make that happen.


