Imagine your company has invested heavily in Databricks as a unified data and AI platform. Multiple teams, from data engineering to analytics, now have access to this powerful toolset. But do you know who is actually using Databricks, how often, and to what effect? Are the data science teams leveraging it daily, while finance or marketing barely touch it?
Without visibility, you’re flying blind on adoption and ROI. We’ll explore why tracking Databricks usage across your organization is so important, what key metrics to monitor, how to measure usage effectively with available tools, and how to turn those insights into actionable steps.
Why Visibility into Databricks Usage Matters
Databricks is widely adopted in the enterprise. By 2024, it was reported that over 10,000 organizations worldwide use Databricks to drive data insights and AI solutions. Within a single company, however, adoption can be uneven. Often, tech-savvy teams eagerly embrace Databricks, while other departments lag behind. This disparity matters. If only a fraction of your employees use the platform, you’re not reaping the full benefits of your investment. Tracking usage highlights these gaps, allowing you to address them effectively. Here are some specific reasons visibility into usage is crucial:
Optimize ROI: Databricks isn’t cheap, so executives want to ensure it’s delivering value. Usage data helps quantify that value by showing whether capacity is underutilized or driving faster delivery and new insights. If usage aligns with productivity gains, that success can justify further investment.
Identify Adoption Gaps: Usage tracking shows which teams have embraced Databricks and which haven’t. You might discover the data engineering group is running hundreds of notebooks a week while the marketing team hasn’t run a single query. These insights highlight where enablement or training is needed to spread usage more evenly.
Prevent Shadow IT and Data Silos: If certain departments aren’t using the sanctioned Databricks platform, they may turn to unsanctioned tools or manual work. Tracking usage reveals these gaps, giving IT the opportunity to intervene, align workflows, and establish a single source of truth.
Resource and Cost Management: Tracking usage is also a matter of cost control and performance. Databricks usage translates into compute costs, so visibility into who is spinning up clusters and for how long helps pinpoint inefficiencies. Observability enables accountability: when teams see how their usage affects cost, they are more likely to adopt efficient practices and right-size workloads.
Governance and Compliance: In regulated industries, tracking who is accessing what data and running which workloads is critical. Usage logs provide an audit trail that ensures teams adhere to security policies and flag suspicious activity early. Even for general governance, usage data helps set smart policies, such as limiting access to powerful compute resources or scheduling heavy jobs during off-hours.
In summary, tracking usage isn’t about peering over employees’ shoulders – it’s about insight, not oversight. The goal is to enable better decisions: where to invest in training, how to allocate resources, and how to continuously improve your data and AI initiatives. With the “why” established, let’s look at what exactly we should be measuring.
What to Measure in Databricks Usage
“Databricks usage” can have different meanings for different stakeholders. It’s helpful to define the key metrics and usage aspects you might want to track:
Active Users: How many people are actually using Databricks on a regular basis? You might track daily active users (DAU) or monthly active users (MAU) of the platform. Breaking this down by department or role is even more insightful:
For example, 50% of engineers use Databricks on a weekly basis, but only 5% of analysts do.
Frequency and Duration of Use: Beyond logins, consider how often users run workloads and for how long they run. Some may run jobs daily while others only once a month. Measuring session duration or commands executed per session helps gauge engagement depth.
Workloads Run: Track notebooks executed, jobs run, and queries executed to see the volume of work. An increase over time suggests growing reliance on Databricks. Breaking it down by workload type (ETL pipelines, ML training, ad-hoc analytics) or by scheduled pipelines provides sharper insight into how the platform supports daily operations.
Resource Consumption: This is crucial for cost and capacity planning. Monitor compute usage, including cluster hours, CPU/memory utilization, and Databricks Units (DBUs). Tagging clusters and jobs enables you to attribute usage to teams and identify imbalances. Tracking trends over time also aids in forecasting and budget planning.
Feature Adoption: Databricks is a comprehensive platform with numerous capabilities – ranging from basic Spark notebooks to MLflow, Delta Lake, Databricks SQL, and new features like Databricks Assistant (an AI-powered code assistant). It’s valuable to track which features are being used. Feature-specific usage can reveal if certain tools are underutilized. If nobody in your org is using MLflow for model tracking, you might investigate why – perhaps data scientists are using a different tool, or they need training on this feature.
User Satisfaction or Productivity: Though harder to quantify, correlating usage with outcomes is key. Do high-usage teams deliver projects faster or produce better results? Surveys can also reveal whether Databricks improves productivity. High usage with positive feedback indicates healthy adoption, while heavy use accompanied by frustration suggests areas that need attention.
In essence, think of Databricks as a product and your employees as the users of that product. The same metrics product managers track for software adoption apply here – active users, frequency, feature usage, retention, etc.. By measuring these, you get a 360° view of how Databricks is (or isn’t) becoming ingrained in daily work.
How to Track Databricks Usage: Tools and Techniques
Knowing what to track is half the battle – the next step is figuring out how to collect this data. The good news is that Databricks and its ecosystem offer several methods for gathering usage metrics. Below are the primary methods to monitor and measure usage across your Databricks workspaces:
Databricks Audit Logs: Available in Premium and higher tiers, audit logs capture nearly every user action, including logins, notebook runs, job starts, and cluster activity. They’re delivered in JSON to cloud storage or exposed via system tables. By querying them, admins can see how many commands each user has run or how often clusters have been created. They provide rich raw data, although it often needs processing to be human-readable.
System Tables for Usage (Unity Catalog): A newer and more powerful option is to leverage Databricks system tables. With Unity Catalog enabled, Databricks provides a set of read-only tables in a system schema that automatically capture usage and operational metrics across your account. In fact, system tables act as an analytical store of your account’s operational data, enabling historical observability. Relevant system tables for tracking usage include:
Audit (system.access.audit as mentioned above).
Query History (system.query.history), which captures a record of every SQL query run on a SQL warehouse or Databricks notebook. This is incredibly useful, for example, to see how many queries a particular analyst ran over the past month or to identify the most commonly queried tables.
Clusters and Warehouse Events (system.compute.clusters, system.compute.warehouse_events), which log changes to clusters and SQL endpoints (e.g., created, started, terminated). These can help track how often teams spin up clusters or how long warehouses run.
Billable Usage (system.billing.usage), which logs all billable usage events (compute, storage, etc.) across the account. This ties usage to cost, down to a very granular level. By joining this with tags or workspace info, you can get cost/usage per team or project for chargeback or optimization purposes.
Job Runs (system.lakeflow.job_run_timeline and related tables), which track pipeline/job execution history.
MLflow Usage (system.mlflow.* tables for experiment and run metadata) to see how heavily the ML tracking features are used.
UI and Built-in Dashboards: For quicker access, admins can use the Account Console’s usage page or import pre-built dashboards. These provide visual breakdowns of DBU consumption by workspace, tags, or product SKU, and highlight top operations. There’s also a Query History panel in Databricks SQL, which allows you to see who ran which queries, making it useful for tracking analytics adoption without writing code.
REST APIs: Databricks provides APIs that allow you to fetch usage data programmatically. The Query History API returns metadata like execution time, user, and query text, while other APIs expose job runs and cluster events. These are handy for automation or consolidating usage data with other tools, especially if you want daily ingestion into your own reports.
Cloud Tracking & Third-Party Tools: Cloud-native services, such as AWS CloudWatch or Azure Log Analytics, can capture Databricks events and costs. Tools like Datadog can also monitor Spark metrics and cluster stats, offering real-time alerts. These work well for live Tracking but should complement, not replace, Databricks system tables as the main source of record.
Manual Surveys and Feedback: Beyond system data, direct feedback from teams helps explain usage patterns. For example, low adoption in logs may reflect usability issues or missing features. Adding lightweight surveys can surface these insights, though quantitative logs remain the most reliable usage data.
In practice, you will likely use a combination of these methods. Many organizations start with the basics – downloading audit logs or billable usage reports – and later evolve to more real-time dashboards via system tables or integrate data into a BI tool. The key is that the data exists. Databricks has ensured that nearly every aspect of usage can be captured, whether through logs, tables, or APIs. It’s up to you to retrieve and analyze it.
Bringing It All Together with Worklytics
Tracking Databricks usage across an entire organization can involve numerous data points and systems, ranging from audit log files to SQL queries on system tables and manual spreadsheets. It can feel like piecing together a puzzle. This is where a solution like Worklytics comes in as a powerful ally.
Worklytics is a people analytics and productivity insights platform that specializes in aggregating and analyzing work tool usage data (while keeping it privacy-safe).
In the context of Databricks adoption, Worklytics can provide a unified, digestible view of how Databricks (and other tools) are being used across teams and roles.
Unified Dashboard with meaningful insights
Imagine having a single dashboard that shows, for example, the number of Databricks active users by department, the top teams by compute hours used, and trends in usage month-over-month – all without you having to manually query logs.
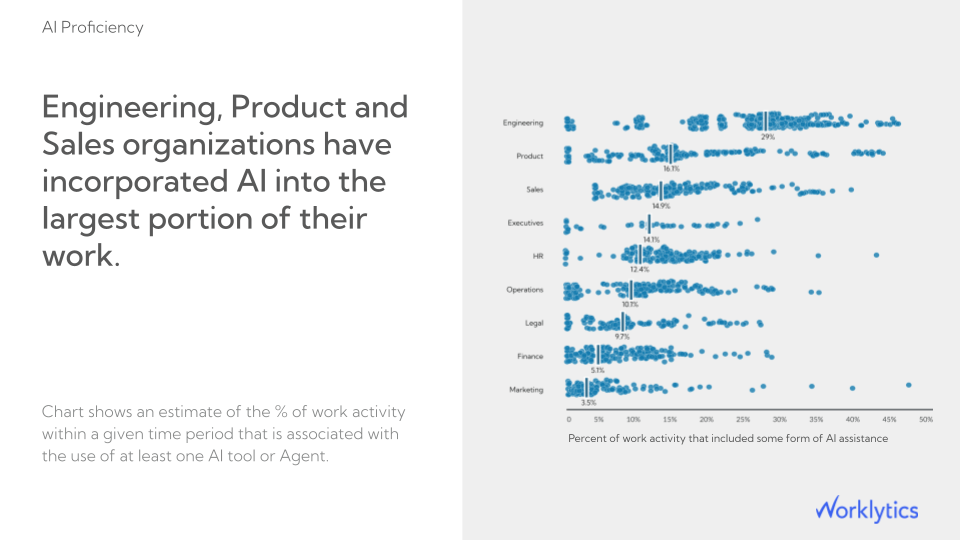
Sample Report of Worklytics in Actionable Insights
Integrated with various AI agents and collaboration tools
Worklytics’ AI Adoption Dashboard is designed to integrate usage logs from various tools into one place. It already connects with sources like Slack, GitHub Copilot, Microsoft 365 Copilot, Zoom, and many others to track AI and collaboration tool usage.
By feeding in Databricks usage data (such as audit logs or system table extracts), Worklytics can correlate that with other productivity metrics. For instance, you could see how Databricks usage overlaps with code collaboration in GitHub or with BI tool usage, painting a fuller picture of your digital workflow.
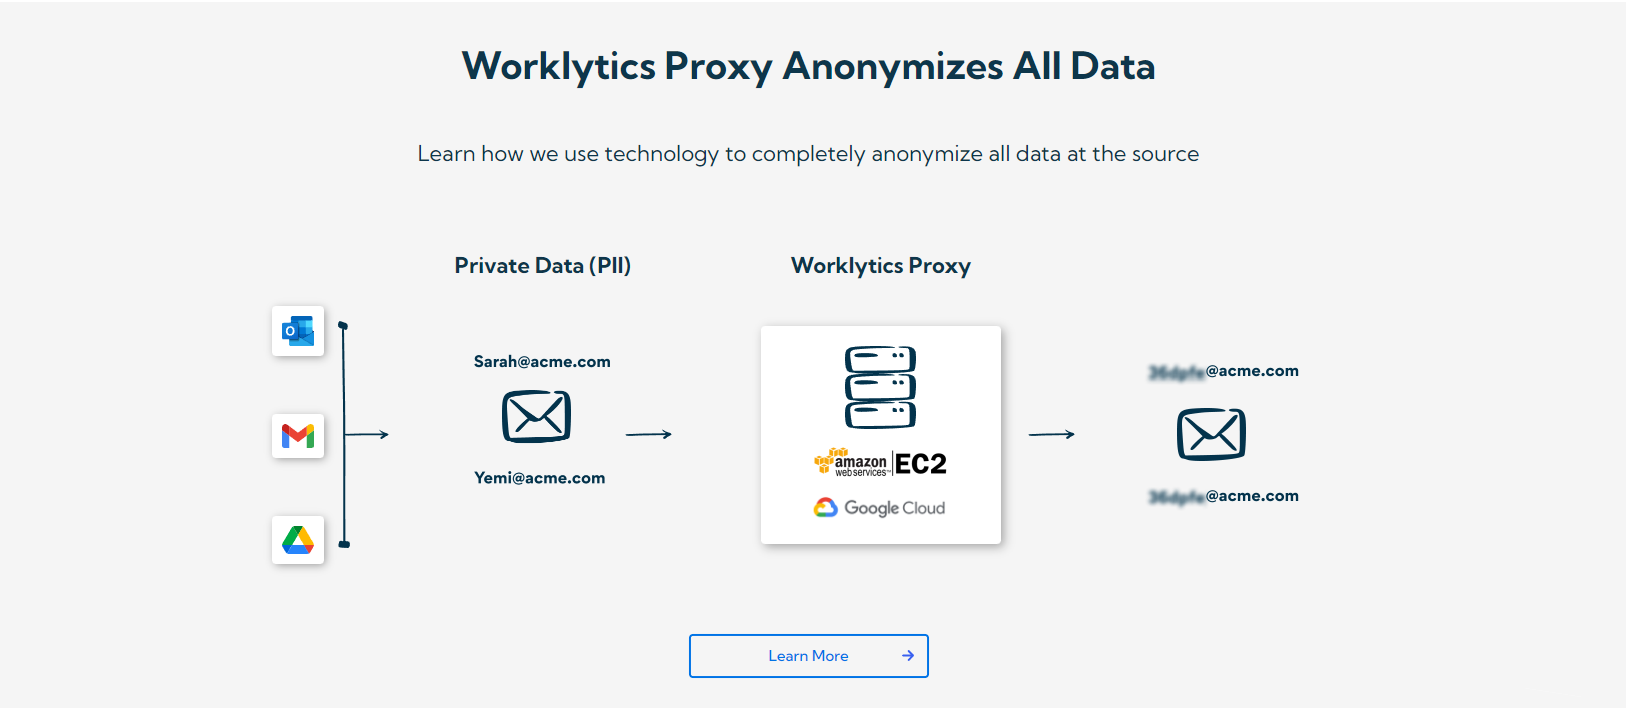
One of the strengths of Worklytics is its privacy-first approach to analytics. As mentioned earlier, Worklytics ingests and pseudonymizes system logs, then displays who is using which features, how often, and in what context – broken down by team, role, geography, and other relevant factors. This means you can confidently share insights with HR and executives without exposing individual identities or raw data. You get a “living baseline” of AI and tool usage that updates continuously, rather than relying on one-off surveys or manual reports.
Privacy Design of Worklytics
In conclusion, tracking Databricks usage across your organization is a game-changer for maximizing the impact of your data and AI investments. It provides the visibility needed to manage adoption, optimize costs, and drive cultural change around data-driven work. Rather than let your Databricks deployment run on autopilot and hope everyone is using it well, you can actively guide and nurture its growth – with data to back your decisions. As we’ve discussed, Databricks offers plenty of logs and tools to get you started on this Tracking journey. And with advanced solutions like Worklytics, you can elevate those efforts by bringing disparate data together into actionable insights.
Share this post
Request a demo
Schedule a demo with our team to learn how Worklytics can help your organization.