

Individual productivity and team productivity operate at different levels of the organization. Confusing them leads to distorted incentives, weak measurement, and the wrong fixes.
Here is the precise distinction.
Individual productivity measures how effectively one person turns their time, skills, and tools into defined outputs. The focus is the role holder. The question is:
Is this person delivering what their role requires, at the expected quality and pace?
Examples of what belongs at the individual level:
Team productivity, by contrast, measures how effectively a group turns coordinated effort into shared outcomes. The focus is on the workflow and the collective result. The question is:
Is this team reliably converting coordinated work into customer, revenue, or delivery outcomes?
Examples of what belongs at the team level:
The core difference is simple. Individual productivity is about personal execution. Team productivity is about system performance.
Individual productivity is influenced heavily by personal capability, clarity of expectations, and local constraints.
Team productivity is influenced primarily by structural factors:
An individual contributor can optimize their calendar. They cannot eliminate redundant cross-team approvals. When team productivity is low, the bottleneck usually sits in coordination design, not personal effort.
This is why measuring employee productivity purely at the individual level often mislabels system friction as underperformance.
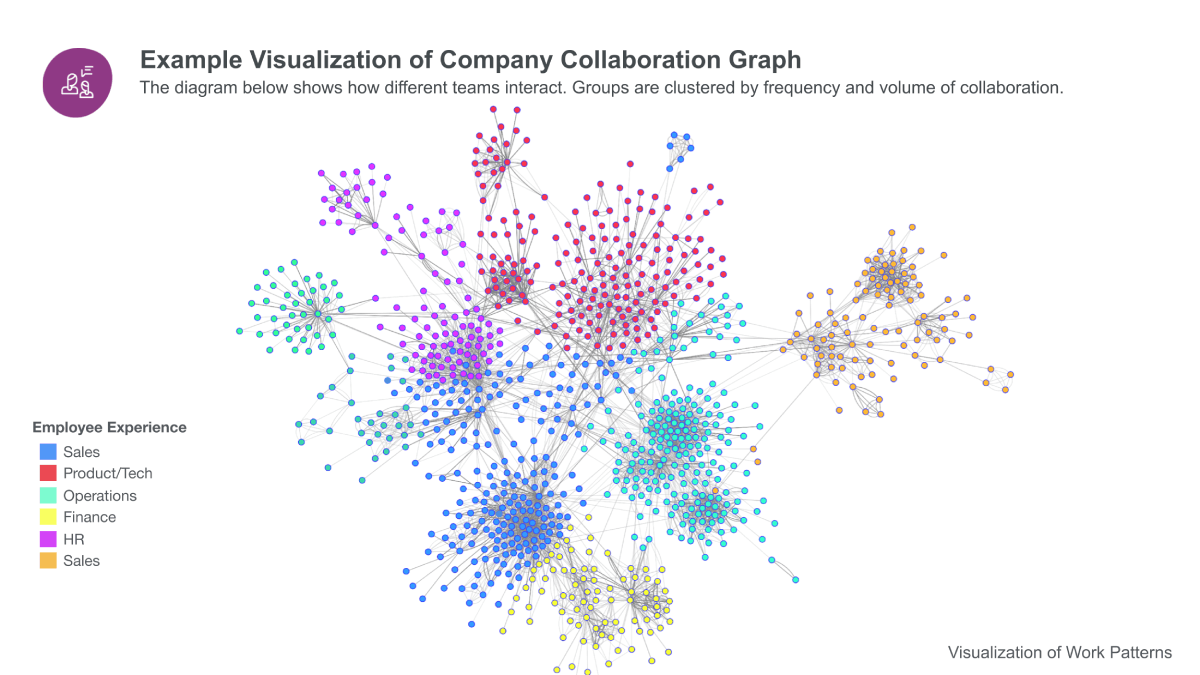
When organizations use Worklytics to measure employee productivity, they see this distinction clearly. Worklytics surfaces group-level patterns such as meeting load, focus fragmentation, and cross-team collaboration density. These patterns expose structural constraints that no individual can fix alone.
Individual productivity metrics often drift toward effort signals:
These are proxies. They show intensity, not necessarily impact.
Team productivity metrics focus on flow:
Flow metrics reveal system efficiency. Effort metrics reveal how busy people are.
If activity rises but cycle time does not improve, the team system is inefficient. That is a team productivity problem, not an individual one.
Worklytics supports this distinction by measuring meeting effectiveness, collaboration, and focus capacity at the team level. If meeting time consumes half of the available capacity and focus blocks shrink, throughput will decline regardless of individual effort. That is a structural productivity tax.
Individual productivity varies across people. Team productivity varies across workflows.
If one person consistently misses deadlines while peers with similar constraints deliver reliably, that is an individual performance issue.
If an entire team experiences rising delays, increased after-hours work, and falling focus time, that is a system issue.
This is where manager effectiveness becomes a differentiator. Poor clarity, inconsistent prioritization, or excessive meeting creation will depress team productivity even if every individual is capable. Worklytics’ Manager Scorecard helps identify these enabling or constraining behaviors at scale without invasive monitoring.
The pattern of underperformance tells you where to intervene.
Individual productivity is often evaluated in short cycles. You can assess deliverable quality this sprint or this month.
Team productivity is cumulative. It reflects coordination quality, decision clarity, and sustainable pace over time. Chronic meeting overload or unclear ownership may take months to degrade delivery speed.
This is why guardrails matter at the team level:
If engagement drops and after-hours work rises, team productivity will decline later, even if short-term output appears stable.
Worklytics connects these guardrails to operational data so leaders can see when productivity gains are being financed by burnout.
Individual productivity metrics carry a higher gaming risk.
When people know they are judged on output counts or visible activity, behavior adapts. Work gets fragmented into smaller units. Meetings multiply to signal visibility. Necessary collaboration declines if it is not directly credited.
Team productivity metrics reduce this risk because they evaluate shared outcomes and system efficiency rather than personal activity.
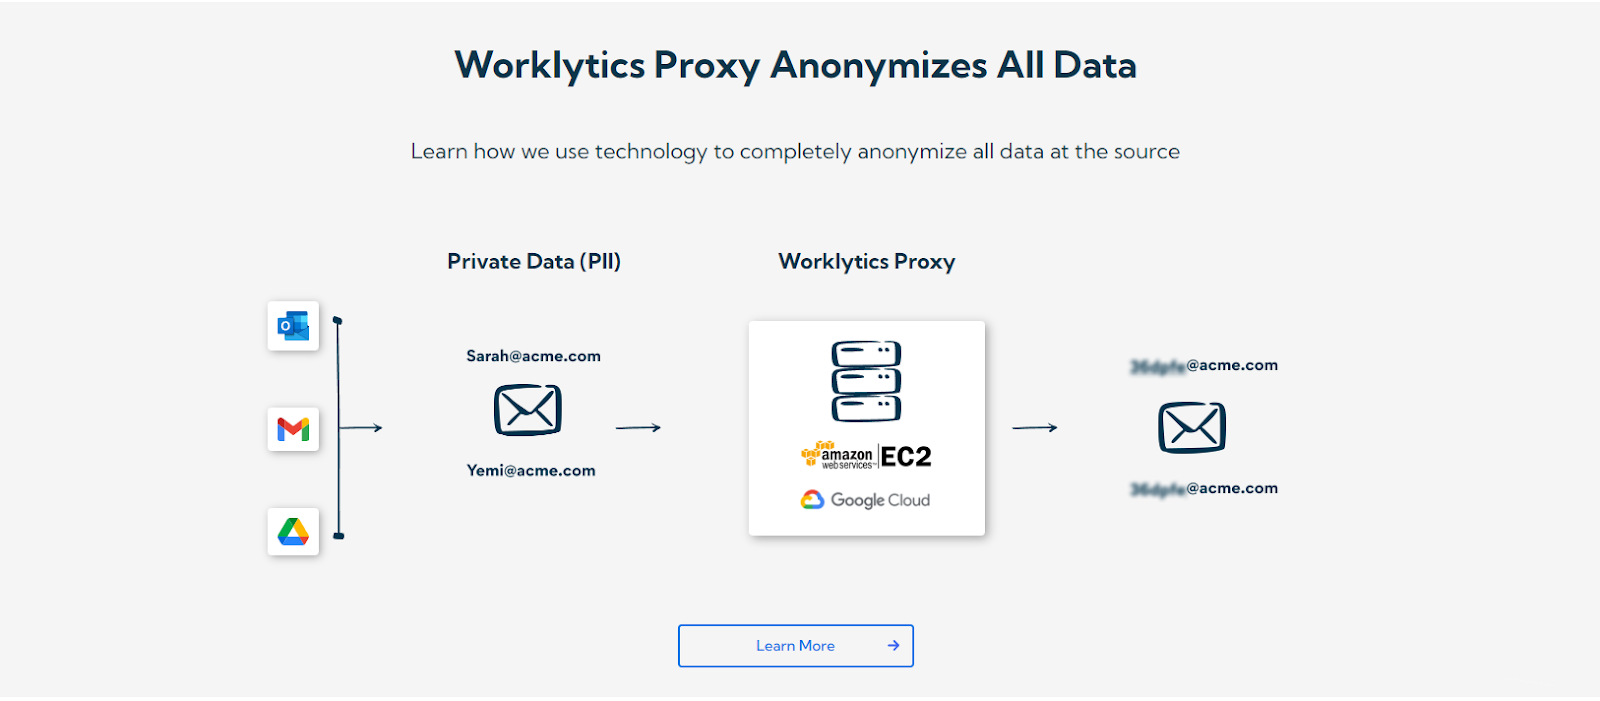
That is why modern productivity measurement emphasizes anonymized, group-level analytics. Worklytics avoids analyzing work content and presents aggregated insights, allowing leaders to fix friction without turning productivity into surveillance.
Team productivity is best understood as delivery flow plus collaboration health. Leaders should prioritize metrics that diagnose bottlenecks and predict outcomes, not just explain the past.
Below are the most durable categories.
For software and product teams, DORA’s metrics are a mature example: throughput metrics (change lead time, deployment frequency, failed deployment recovery time) and instability metrics (change fail rate, deployment rework rate).
DORA also notes that speed and stability are not tradeoffs for top performers, so leaders should not assume “faster” requires “breakier.”
Outside of engineering, translate the same logic: Lead time: time from request to completion. Throughput: completed work per time period. Rework: proportion of work that must be redone. Failure recovery: time to restore service or process when something breaks.
Harvard Business Review has documented the risk of collaborative overload. Microsoft’s recent Work Trend Index reporting shows meetings and pings now fragment attention continuously, with heavy meeting load happening during natural productivity spikes.
When leaders talk about measuring meeting effectiveness, Worklytics is a practical solution because it provides real-time visibility and benchmarking so you can see which meeting habits create bottlenecks.
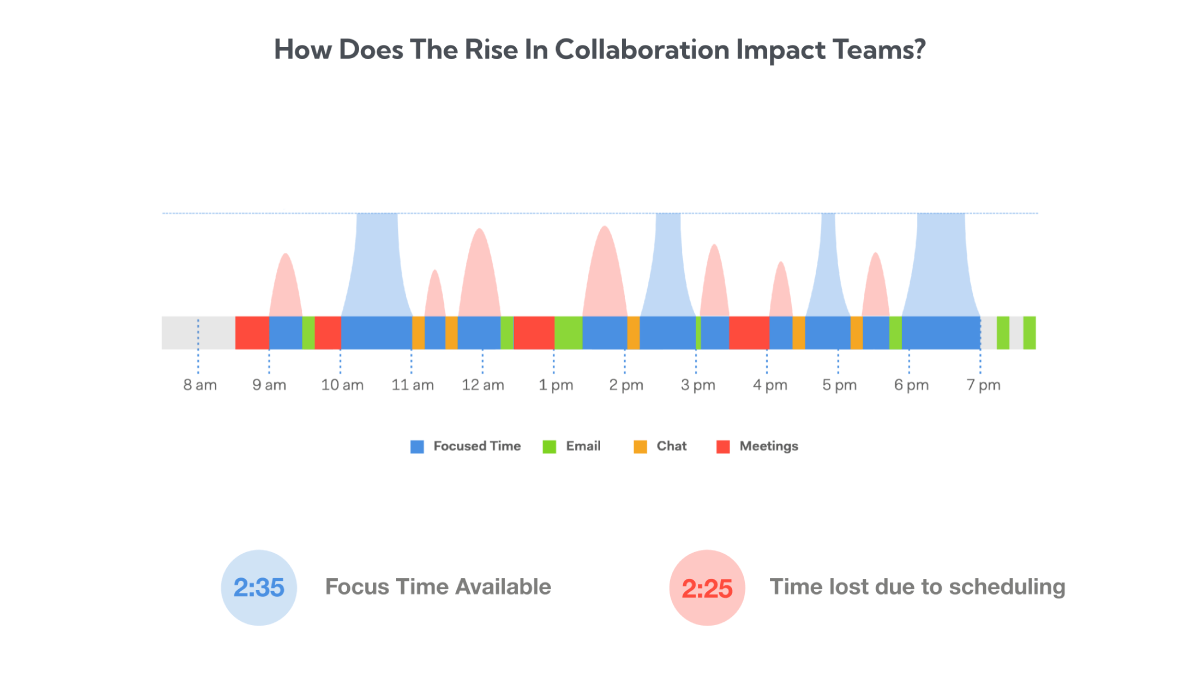
For team productivity measurement, these meeting metrics are usually enough: Time spent in meetings. Impact of meetings on focus (two-hour blocks). Meeting size distribution and average meeting length. Meeting quality proxy. Meeting mix (within the team, other internal teams, external organizations). Estimated meeting cost, to quantify the tradeoff between alignment and overhead.
The leadership action is meeting governance: define when meetings are required, when async updates are preferred, and what decisions must be made in which forums.
Teams lose productivity when work depends on information held by a small number of people, or when cross-team coordination becomes a maze.
Worklytics can support measuring employee productivity at the team level by analyzing collaboration patterns and communication data to reveal team dynamics and help leaders intervene sooner.
Track whether dependencies and cross-team coordination are rising, and whether work is concentrated in a few “always on” individuals. The leadership actions are to clarify decision rights, reduce approval layers, and invest in documentation.
Engagement is not optional. In Gallup’s April 2025 release, global engaged employees fell from 23% to 21% between 2023 and 2024, driven primarily by a drop in manager engagement from 30% to 27%. Gallup also estimated US$438B in lost productivity.
When measuring employee engagement, Worklytics helps detect early signals by analyzing collaboration patterns and communication data, and by combining survey data with behavioral data from work tools so leaders can identify drivers rather than guessing.
When measuring manager effectiveness, Worklytics’ Manager Scorecard is designed to leverage existing data, benchmark best practices, and provide concrete recommendations while staying fully anonymous and not analyzing work content.
A manager effectiveness lens that ties directly to team productivity includes: Consistency of one-on-ones and coaching touchpoints. Manager time allocation, including overload patterns that can cascade into the team. Indicators of after-hours outreach that signal unstable priorities or lack of planning. Cross-functional connectivity, which predicts unblocking ability.
AI adoption is already mainstream. Leaders should track whether AI is being used, where it is being used, and whether it is changing delivery outcomes and employee experience, not just licenses purchased.
To measure AI adoption and connect it to productivity, Worklytics’ AI Adoption Dashboard consolidates tool usage data across platforms so leaders can track adoption by team and role, set targets, and monitor progress over time.
Add engagement, well-being, and manager effectiveness. This is not a “culture” side project. It is the risk management layer that prevents short-term output from turning into attrition and quality collapse.
ISO 30414:2025 explicitly includes productivity, health, safety, and well-being, and leadership, culture, and engagement as core reporting areas. NIOSH also stresses anonymity and ethics in well-being measurement, which should extend to operational analytics.
Worklytics supports this scorecard because it offers real-time dashboards, over 200 metrics designed to model work and collaboration, and privacy-preserving analytics that anonymize data at the source and avoid analyzing work content.
Using individual activity metrics as a proxy for value. This encourages gaming. DORA explicitly warns against setting metrics as goals and against relying on one metric to capture a complex system.
Yes, but only for coaching and barrier removal. If you want scalable signal without surveillance, Worklytics provides group-level, anonymized views into meeting load, focus impact, and collaboration patterns rather than invasive individual monitoring.
Use behavioral signals: meeting time, focus-time impact, meeting size and duration, and multitasking proxies. Worklytics’ Meeting Effectiveness metrics include time spent in meetings, “Impact of Meetings on Focus,” and a meeting quality proxy that looks at email or chat during meetings.
Pair a validated survey with anonymous operational signals. The NIOSH WellBQ emphasizes protecting anonymity when assessing worker well-being. Worklytics supports measuring employee well-being with group-level indicators of work-life balance and leading signals of burnout.
Adoption by team and role, frequency of use, and whether usage correlates with improved flow or reduced rework. Worklytics’ AI Adoption Dashboard is designed to consolidate signals across AI tools to track progress over time and support ROI reporting.
Measure enabling behaviors: consistent one-on-ones, sustainable meeting load, and cross-team connectivity. Worklytics’ Manager Scorecard is designed to benchmark manager practices and provide recommendations while staying anonymous and not analyzing work content.
If you want leaders to make better decisions, measure what leaders can actually change. Track team outcomes, then diagnose the work system with metrics that reveal coordination costs, meeting overload, and focus constraints. Use individual signals only to coach and remove blockers. Keep sustainability guardrails non-negotiable, because exhausted and disengaged teams do not stay productive. Worklytics makes this practical by using anonymized, group-level analytics and real-time dashboards.


