We’re kicking off 2026 with a set of Worklytics updates designed to make insights easier to explore, safer to share, and more actionable across your organization.
TL;DR — What’s New (and Why It Matters)
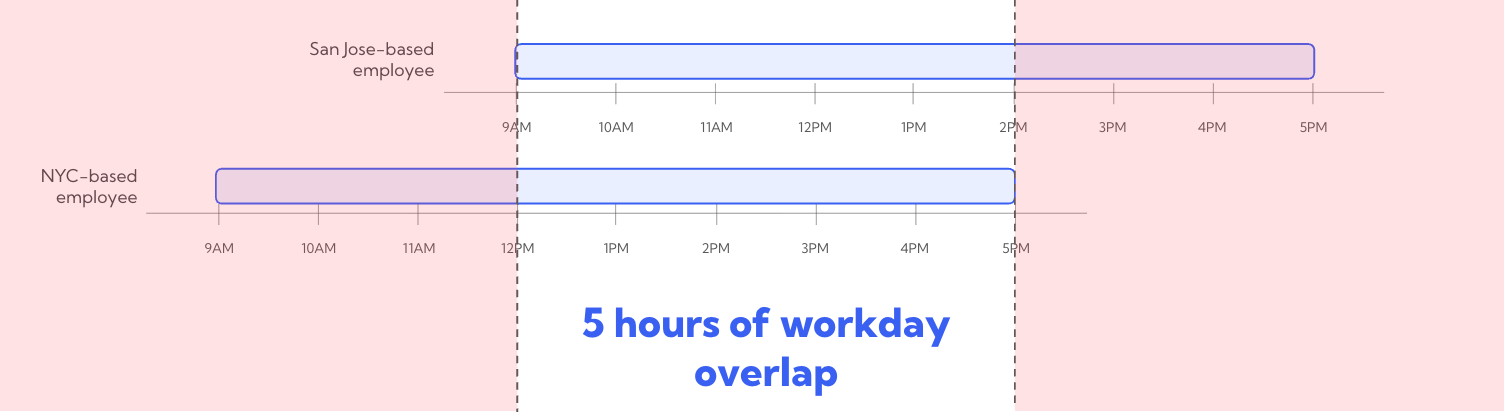
🌍 Deeper global collaboration insights→ New metrics for understanding cross-timezone work
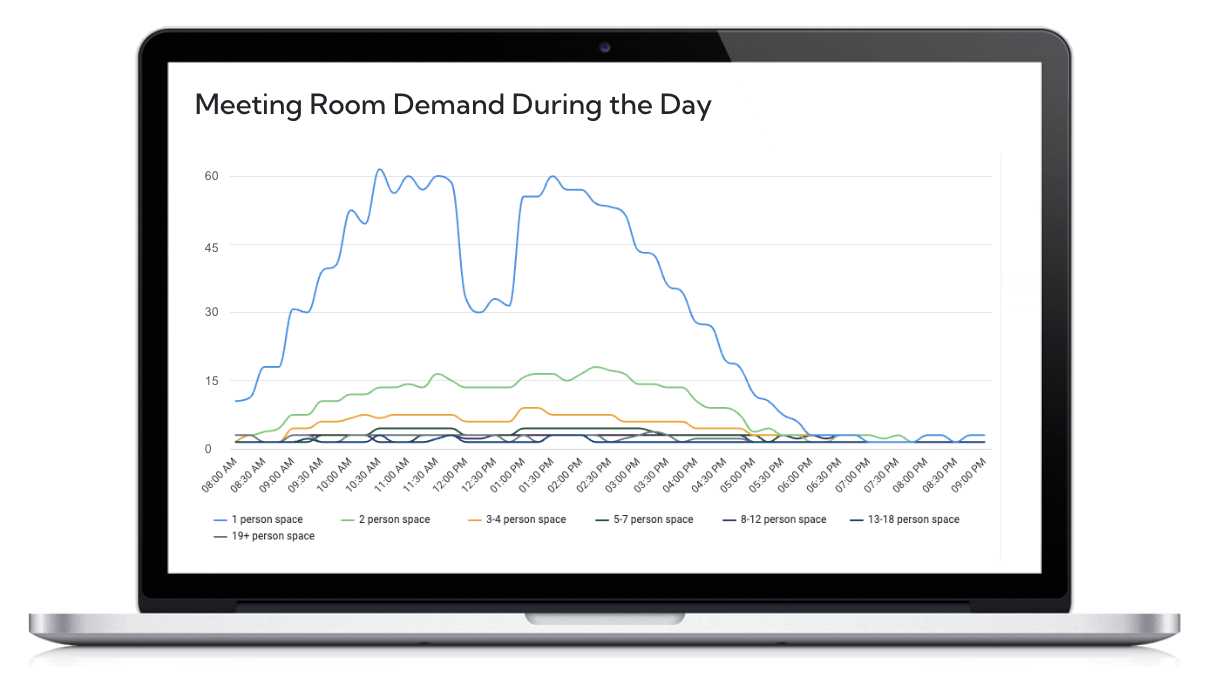
🏢 New workplace insights → Meeting room demand trends that inform smarter space planning
🔌 New AI data connectors → A new Glean connector coming soon
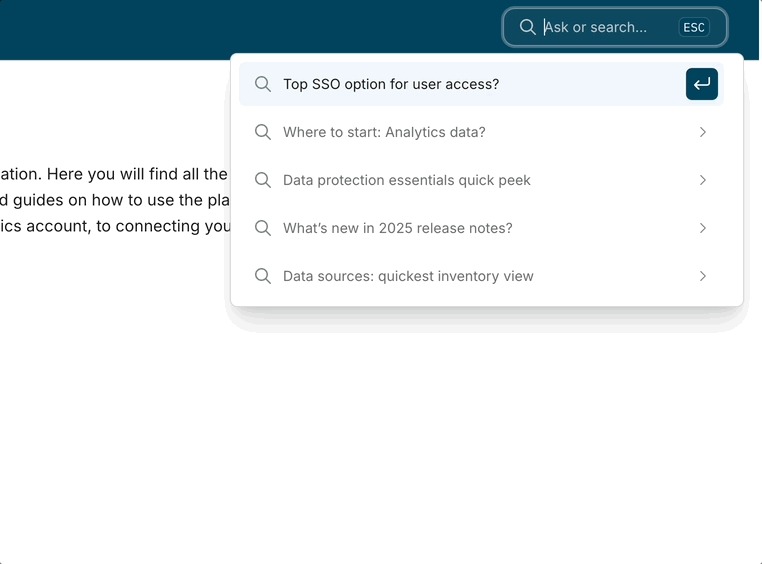
🤖 Faster answers → AI-powered search in the Worklytics help portal
🔍 Improved filter transparency→ Instantly see who your insights represent and how filters impact coverage
⚡ Faster exploration, less noise → Smarter filters that adapt as you explore
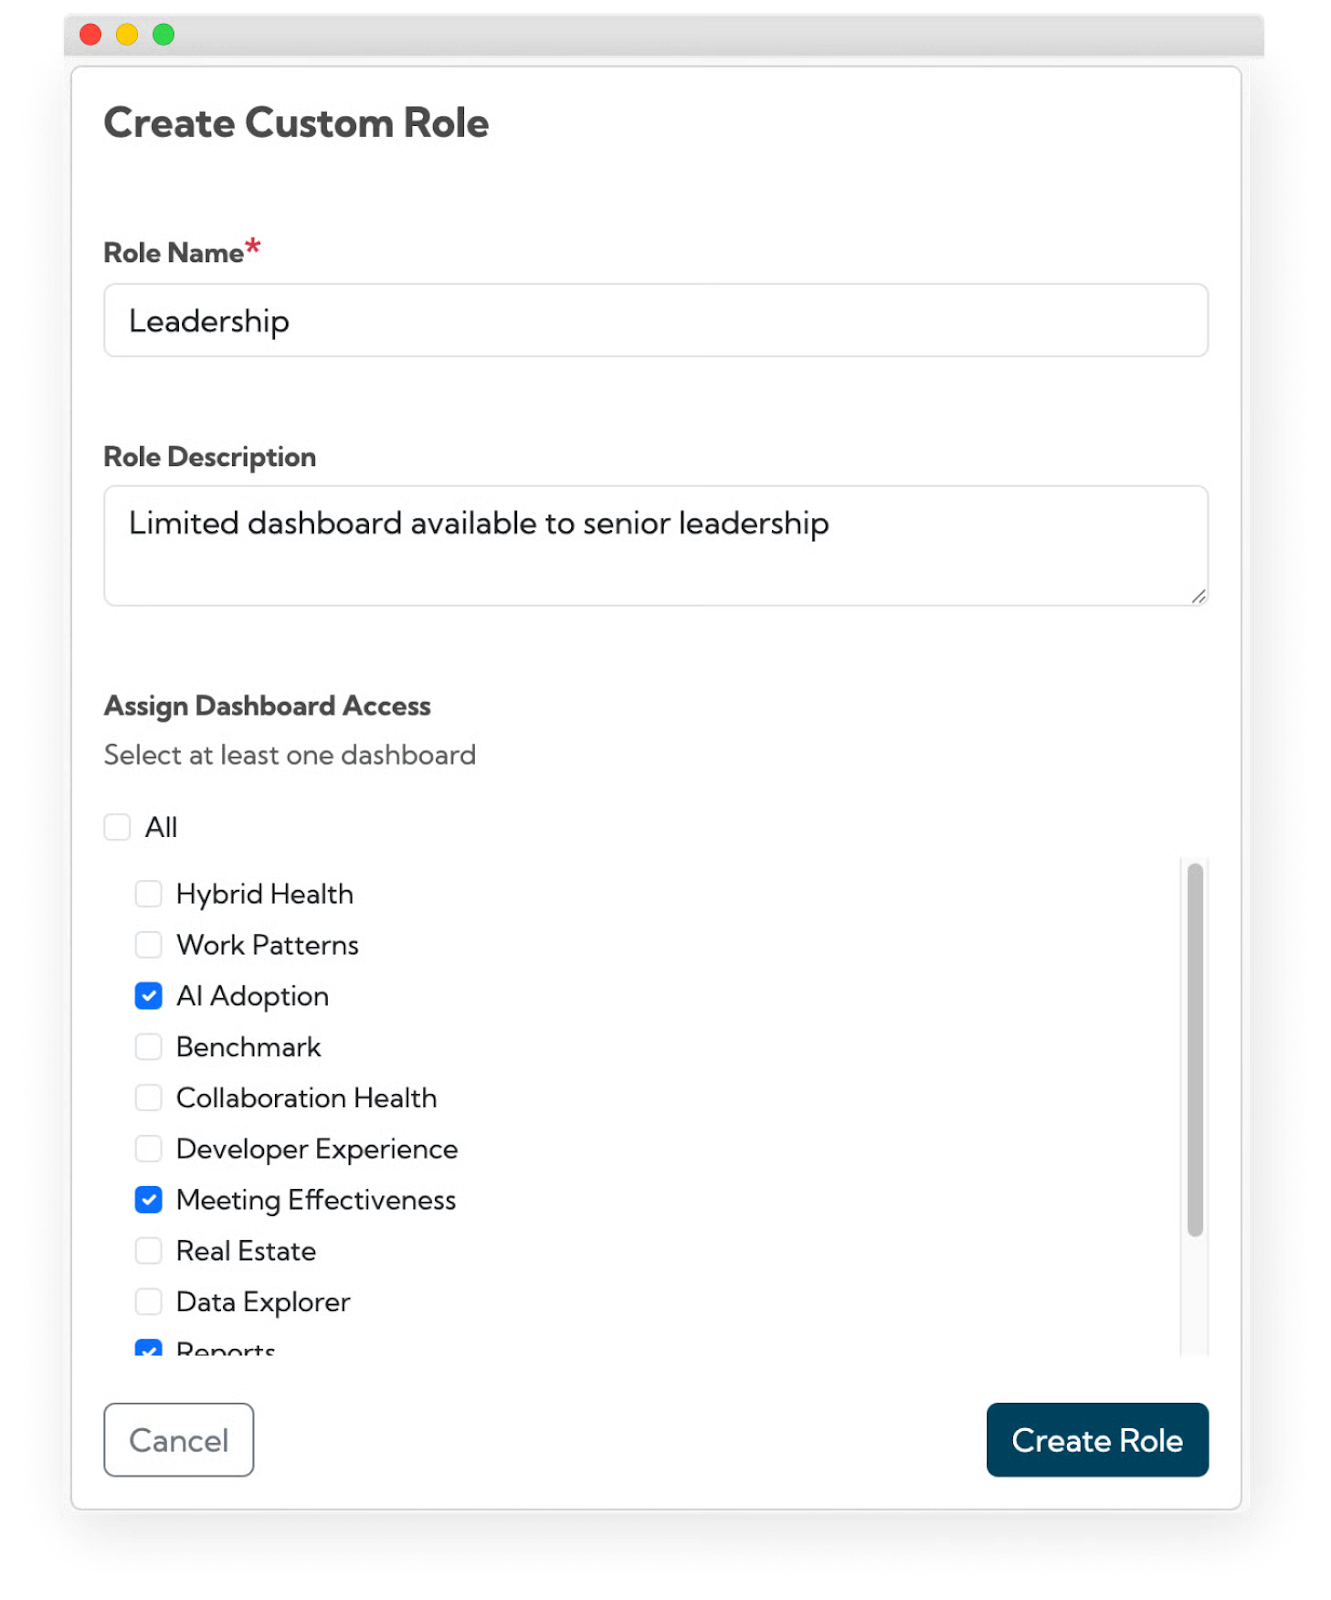
🔐 Customized, secure sharing→ Role-based dashboard access without extra admin work
Scroll on for details 👇
🌎 Understand How Time Zones Shape Collaboration
New Cross-Timezone Collaboration Metrics
We’ve launched a new set of metrics that help quantify how collaboration across time zones impacts teams—giving distributed organizations clearer visibility into coordination challenges and opportunities.
This new dashboard shows how physical meeting room usage evolves over time—helping you plan space more effectively.
You can now:
Optimize your conference room sizes — track if demand is shifting towards phone booths or large conference rooms over time.
Identify when meeting room demand spikes during the day to manage office capacity & encourage departments to shift recurring meetings to low usage hours.
🔌 Connecting More AI Tools to Deepen Work Insights
You can now use AI-powered search in the Worklytics documentation portal to quickly find answers, explore metrics, and get guidance—without digging through pages of docs.
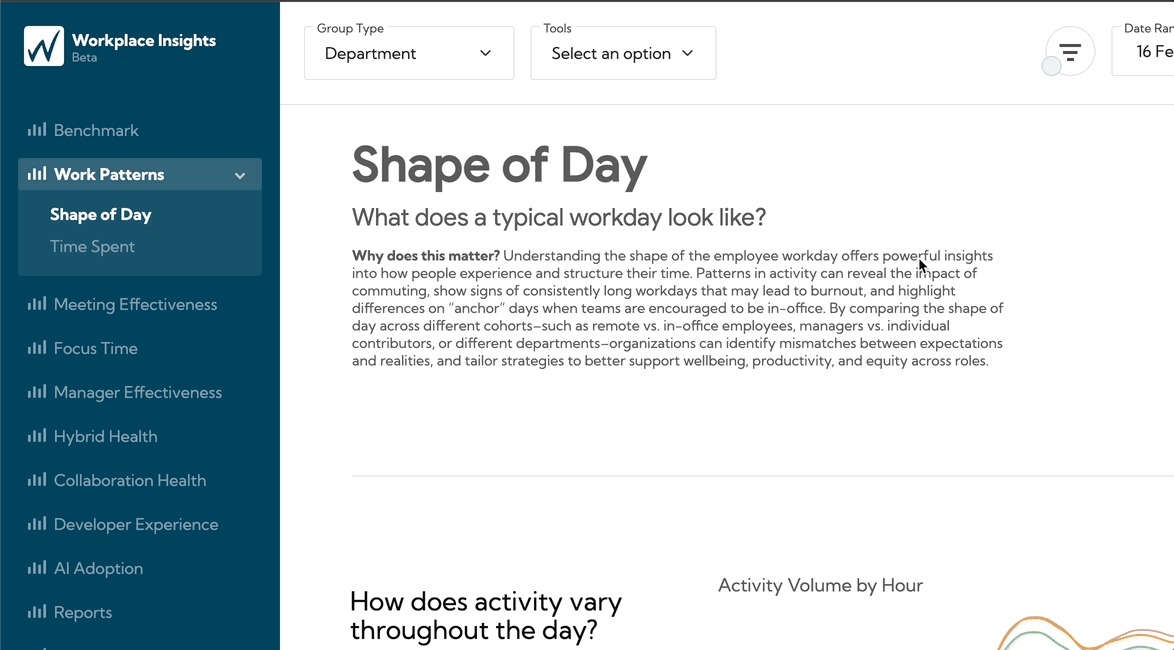
🔍 Explore Insights with More Confidence
Population Size Insights
It’s now easier to understand who your insights represent.
Instantly see the size of your total population
Watch population counts and percent coverage update dynamically as you apply filters
Get immediate context on how representative each view really is