TL;DR:
Organizations today face constant change – new technologies, market shifts, and evolving work models. Organizational agility refers to a company's ability to sense these changes and respond quickly with effective solutions.
Enterprise leaders recognize that agility is now a key competitive advantage in the digital age. The challenge lies in measuring agility in actionable terms. Traditional metrics (like project completion time or ROI) only tell part of the story.
To truly gauge agility, leaders need insight into the organization’s inner workings – how information flows, how teams collaborate, and how quickly knowledge and decisions propagate. This is where Organizational Network Analysis (ONA) comes in.
Organizational agility is the ability to detect change and respond quickly. Agile companies reallocate resources, adopt new technologies, and adjust strategy without friction. When generative AI emerged, these organizations moved fast, piloting tools and embedding them into daily work. Less agile firms stalled due to silos, slow approvals, or rigid culture.
Agility now determines competitiveness. Technology cycles are shorter, work models keep shifting, and customer expectations evolve constantly. Companies that adapt continuously innovate faster, reach the market sooner, and maintain stronger employee engagement. Agility is no longer optional; it is a defining advantage.
Measuring agility is not straightforward. It spans decision speed, cross-team coordination, and the spread of knowledge across the organization. Traditional metrics capture outputs but overlook how work actually flows between people. Worklytics Organizational Network Analysis fills this gap by revealing the collaboration patterns that enable or constrain agility.
ONA uses data (often from communication tools and work systems) to reveal these networks – who talks to whom, how frequently, and how information or decisions traverse the company.
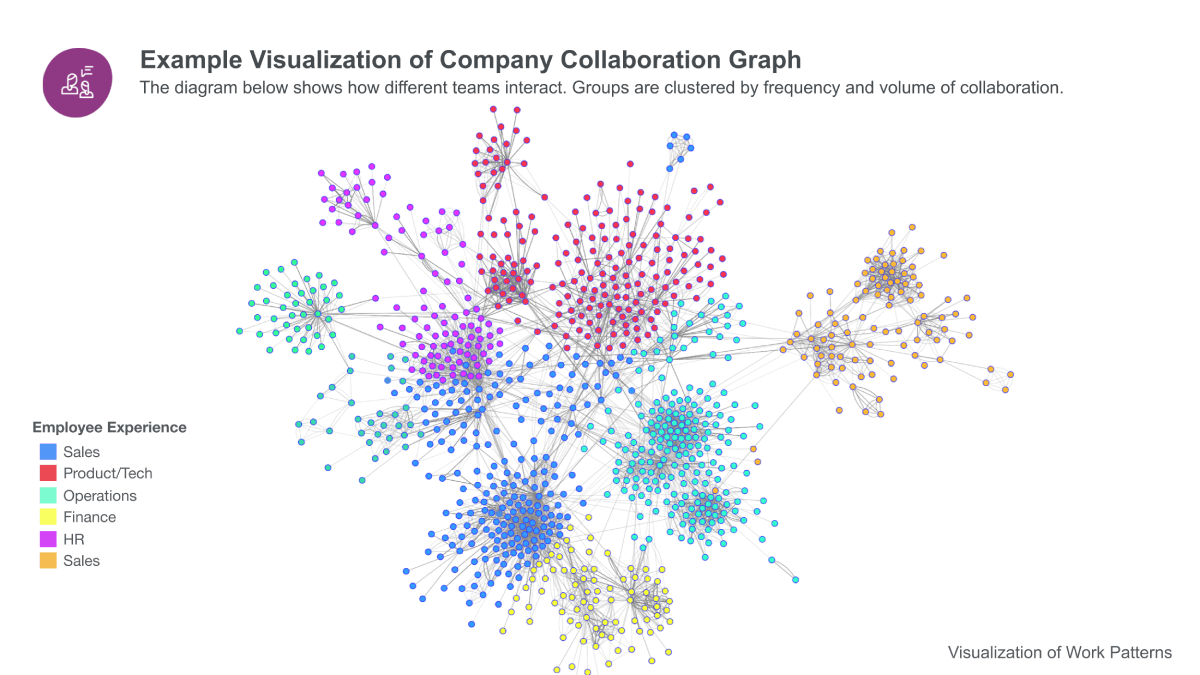
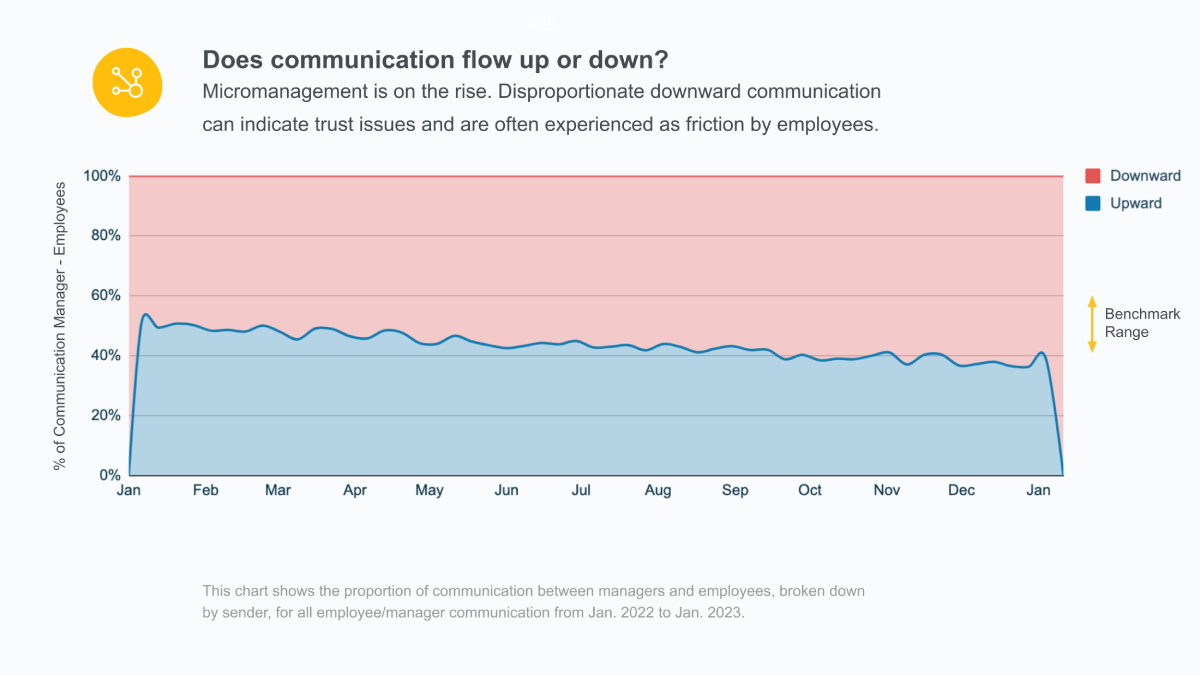
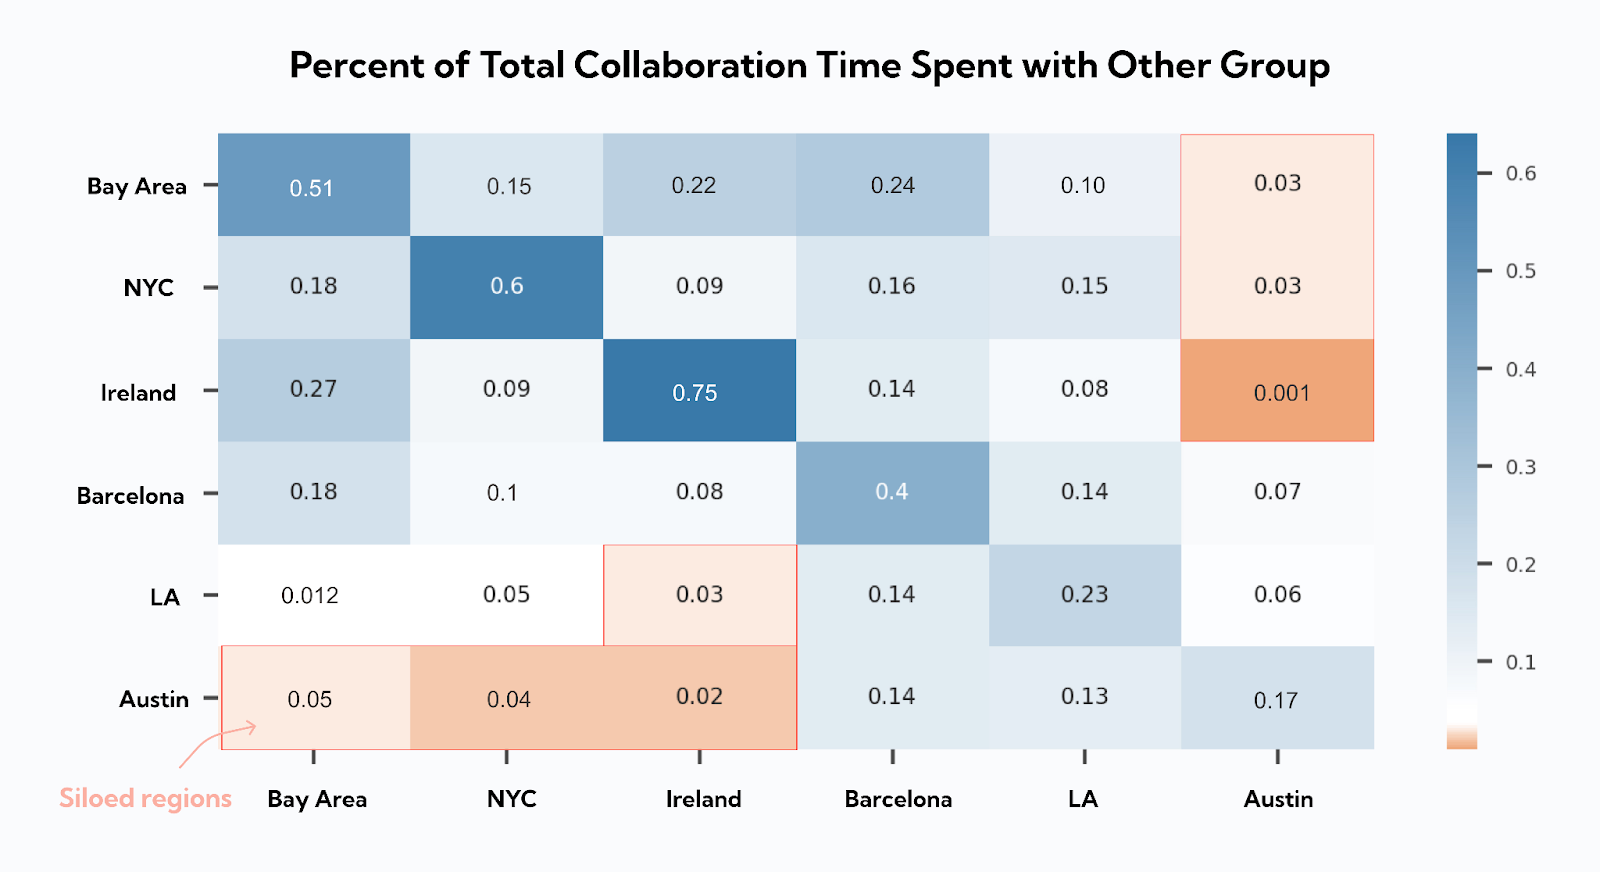
It reveals that a mid-level engineer is actually the central go-to person connecting multiple teams (a hidden influencer), or that an entire regional office is isolated from the rest of the company (a potential silo). These insights are pure gold for understanding agility. Why? An agile organization relies on fast, open information flow and broad collaboration. ONA shows whether those conditions exist.
Crucially, workforce connectivity underpins agility. When employees are well-connected across silos, they can coordinate changes and share knowledge quickly (hallmarks of agility). Conversely, if ONA finds sparse connections or heavy reliance on a few overloaded individuals, it’s a warning sign that the organization may struggle to adapt swiftly.
ONA metrics translate network patterns into numbers that leaders can track. Common metrics include:
In essence, ONA gives leaders measurable insight into organizational agility. Instead of guessing if your company is nimble, you can see concrete network data: Are we siloed or well-connected? Who are the change agents? Where are the collaboration gaps? This network perspective complements traditional performance metrics and often explains why certain teams excel at adapting while others lag.
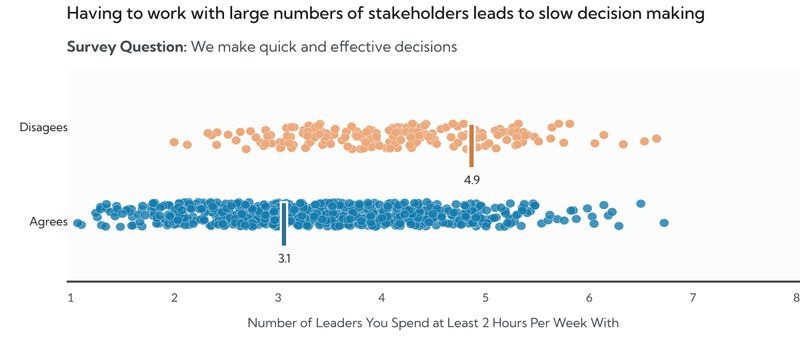
How can we directly measure organizational agility using ONA? First, consider the outcomes of agility we care about – innovation rate, speed of response to market changes, successful adoption of new tools – and then look at network indicators that enable those outcomes.
By focusing on these network-driven measures, leaders gain a more nuanced agility scorecard. It shifts the attention from just outputs (e.g. product launch frequency) to the inputs that make those outputs possible (e.g. high collaboration between R&D and Marketing). As a result, management can proactively strengthen the organization’s capacity to adapt – whether that means mentoring certain connectors, encouraging cross-functional projects, or reallocating resources to relieve a communication bottleneck.
A special case of measuring agility in today’s landscape is looking at AI adoption metrics. As artificial intelligence becomes pervasive, an organization’s agility is tested by how well it adopts and integrates AI tools into everyday work.
AI adoption metrics are indicators of how widely AI is used across teams and processes. These include the percentage of employees using AI-driven tools, the number of workflows automated by AI, the frequency of AI tool use, and the impact of AI on productivity or decision quality.
How does ONA tie into AI adoption? They complement each other. ONA reveals the networks through which knowledge (including know-how about AI) flows. If your AI experts or early adopters are well-connected, they can accelerate AI uptake by influencing others.
To effectively harness ONA and track adoption metrics, organizations often turn to specialized analytics tools. Worklytics is one such solution that enables enterprise leaders to measure and improve organizational agility through data-driven insights. Worklytics acts as an end-to-end ONA platform – from data collection to analysis and reporting – with a strong focus on privacy and actionable outcomes. Here’s how Worklytics helps companies become more agile:
Worklytics passively collects ONA data from the tools employees already use, including email, calendars, Slack, Microsoft Teams, Google Workspace, Zoom, and developer platforms. Pre-built connectors enable continuous insight into collaboration patterns without surveys or manual effort. Data is anonymized at the source and analyzed at the network level, ensuring compliance with GDPR and similar regulations while protecting employee trust.

Worklytics automatically generates core ONA metrics such as centrality, network density, and cross-team connectivity. These metrics reveal influencers, bottlenecks, silos, and overburdened roles through clear visuals. Leaders can quickly identify where collaboration breaks down or concentrates and take targeted action to improve information flow, resilience, and performance.
Worklytics provides continuously updated dashboards that reflect how collaboration evolves over time. Leaders can see the immediate impact of organizational changes, new initiatives, or team restructures without waiting for surveys or reviews. This ongoing visibility turns agility into a measurable operating signal rather than a retrospective assessment.
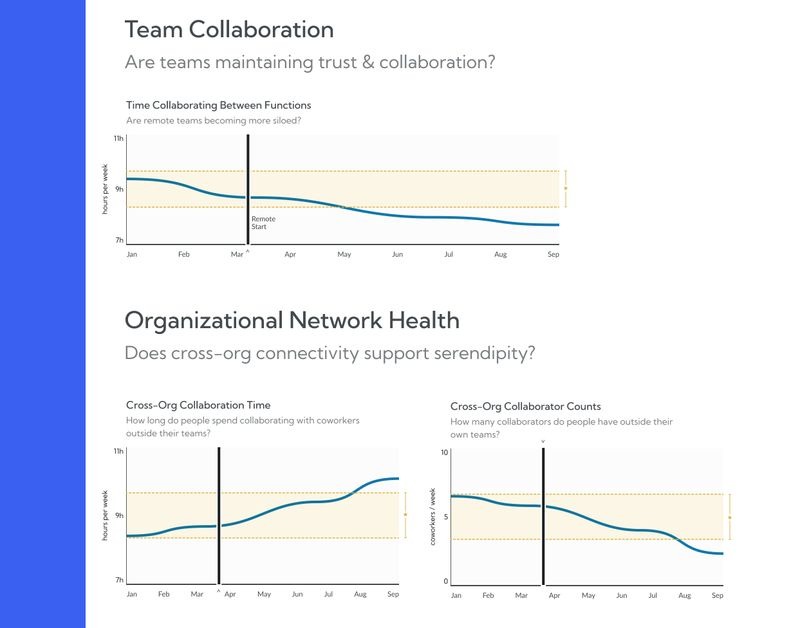
Worklytics benchmarks collaboration and network metrics against comparable organizations. This context helps leaders understand whether their patterns reflect high-performing norms or signal risk. Benchmarks support clearer goal-setting, investment decisions, and progress tracking as collaboration models mature.